Low operating temperature toluene sensor based on novel α-Fe2O3/SnO2 heterostructure nanowire arrays†
Tianshuang Wanga,
Zhangshu Huanga,
Zhangduo Yua,
Boqun Wanga,
Hui Wangb,
Peng Sun*a,
Hui Suoa,
Yuan Gaoa,
Yanfeng Suna,
Tie Li*b and
Geyu Lua
aState Key Laboratory on Integrated Optoelectronics, College of Electronic Science and Engineering Jilin University, 2699 Qianjin Street, Changchun 130012, People's Republic of China. E-mail: pengsun@jlu.edu.cn; Fax: +86 431 85167808; Tel: +86 431 85167808
bTechnology on Micro-system Laboratory, Shanghai Institute of Micro-system and Information Technology, Chinese Academy of Sciences, 800 Yishan Road, Xuhui district, Shanghai 200030, People's Republic of China. E-mail: tli@mail.sim.ac.cn
First published on 25th May 2016
Abstract
In this work, we reported a novel toluene sensor based on α-Fe2O3/SnO2 heterostructure nanowires arrays, which were synthesized via combining an ultrasonic spray pyrolysis (for the SnO2 nanowires arrays) method and the subsequent hydrothermal strategy (for the α-Fe2O3 nanorod branches). Various techniques were employed for the characterization of the structure and morphology of the as-obtained products. The results revealed that α-Fe2O3 nanorod branches grew on SnO2 nanowire arrays with an average length of about 800 nm. As a proof-of-concept demonstration of the function, such novel heterostructure nanowires arrays were used as the sensing material for gas sensors. As expected, the heterostructure composites exhibited good sensing performances for toluene, superior to a single component (SnO2 nanowires arrays). For example, the response of the α-Fe2O3/SnO2 composites was up to 5 times higher than that of the primary SnO2 nanowire arrays at 90 °C.
Introduction
Currently, compared with the various traditional analytical systems, oxide semiconductor gas sensors have been acknowledged as a simple and convenient tool for the detection of inflammable, explosive, and toxic gases.1–3 Over the past few decades, metal oxide semiconductors such as SnO2,4–7 α-Fe2O3,8–10 In2O3,11 WO3,12 and ZnO13,14 have been widely investigated as sensing materials, because they have a high response to the target gases and simplicity of synthesis. For gas sensors based on oxide semiconductors, the interactions between the surface adsorbed oxygen species and target gases lead to a remarkable change in the resistance, so the composition, crystalline size, surface morphology, and microstructure of oxide semiconductors will have a significant impact on their gas sensing properties. In particular, the key factors influencing on gas sensing properties of oxide semiconductors are their receptor function, the transducer function and the utility factor of the sensing body. Those functions are related to the morphology, microstructure, size, crystallinity, and component. Thus, it has long been recognized that the concepts of sensor design are determined by considering each of these three key factors. Compared to the conventional thick film sensors, the nanowires arrays gas sensors exhibit many inspiring characteristics: first of all, nanowires could effectively improve the receptor function and the transducer function of gas sensors because of their inherent high surface to volume ratio and good crystallinity. Moreover, nanowires could provide excellent gas diffusion and mass transport in sensing materials due to their ordered arrangement, these will be helpful for enhancing the utility factor of the sensing body.15–18 Therefore, nanowires arrays may be the potential platform for fabricating high performance gas sensor.Recently, many studies have confirmed that composites of two or more metal oxide semiconductor, which consists of chemically distinct components, showed more outstanding sensing properties than a single metal oxide semiconductor.19–22 Stannic oxide (SnO2)23,24 and hematite (α-Fe2O3),9,25 as two kinds of important n-type semiconductors, have received extensive attention in gas sensing filed because of their unique physical and chemical properties. However, the high operating temperature of these materials usually limits their application in gas sensing devices. Therefore, development new strategies to enhance their sensing properties and reduce operating temperature have great significance in science. Decreasing the grain size is considered an effective method to obtain a improvement in gas response.26 Meanwhile, doping and loading will offer more active sites and accelerate the reduction or oxidation reactions as catalysts during the sensing process. Recently, the construction of heterojunction by combining with different oxide semiconductors can significantly enhance the sensing properties compared with the single component. For these reasons, some heterostructure composites including SnO2/α-Fe2O3,27 ZnO/α-Fe2O3 (ref. 28) and SnO2/ZnO29 have been successfully obtained as excellent sensing materials. It is demonstrated that the microstructure of these composites has an important impact on their sensing properties. In this regard, design and synthesis of composites with novel architectures will be increasingly significant in the fabrication of high performance gas sensors.
In present work, we successfully prepared novel branched nano-heterostructure composed of SnO2 nanowires array stems and α-Fe2O3 nanorod branches by combining a ultrasonic spray pyrolysis deposition and a facile hydrothermal reaction. Various characterization were carried out to obtain the crystal structure and morphology of as-synthesized composites. Furthermore, compared with the primary SnO2 nanorod arrays, the sensor based on α-Fe2O3/SnO2 heterostructure composites exhibited obviously enhancement in gas response and selectivity to toluene. When exposed to 100 ppm toluene, the α-Fe2O3/SnO2 sensor showed a response of 49.7%, which was up to 5 times higher than that of the primary SnO2 nanowires arrays at 90 °C. The improvement of sensing performance can be probably attributed to the unique heterostructure and synergetic effect of α-Fe2O3 and SnO2.
Experimental
Preparation of SnO2 nanowires arrays
All the chemical reagents used in the experiment were analytical grade. The SnO2 nanowires arrays were prepared by ultrasonic spray pyrolysis method. The precursor made by dissolving 1.75 g of SnCl4·5H2O in a mixed solvent composed of distilled water (10 ml) and 0.2 M hydrochloric acid (0.5 ml) was transferred into an ultrasonic transducer and converted into an aerosol, which was carried to the reaction zone by N2 gas (500 sccm).The silicon wafer (area = 1 cm × 1 cm; thickness = 0.2 mm) decorated with Pt was used as the substrate and placed in the reaction zone at the temperature of 400 °C. When the reaction lasted for two hours at this temperature, the SnO2 nanowires arrays were formed on the silicon wafer. Then, the substrate was washed by alcohol and distilled water several times before drying at 80 °C for 6 h. Finally the SnO2 nanowires arrays were sintered for 2 h at the 400 °C. As for the detail process and growth mechanism of such nanowires arrays had been concluded in our previous work.30
Preparation of α-Fe2O3/SnO2 heterostructure composites
The α-Fe2O3/SnO2 semiconductor materials were synthesized by a simple hydrothermal strategy. In a typical process, a piece of silicon covered by SnO2 nanowires arrays was placed within a Teflon-lined stainless-steel autoclave containing a solution consisting of FeCl3·6H2O (0.039 mmol), Na2SO4·10H2O (0.04 mmol), and acetic acid (16 μl). The hydrothermal reaction was conducted at 120 °C for 3 h. After that, the substrate was removed from the solution, rinsed with alcohol and distilled water several times, and dried at 80 °C for 6 h. Finally, the composites were calcined for 2 h at 400 °C.Characterization of sample
The crystal phase of the as-prepared products were analyzed by X-ray power diffraction (XRD) and the morphologies and microstructures were observed by the field emission scanning electron microscopy (FESEM) and the transmission electron microscopy (TEM). The component of the α-Fe2O3/SnO2 heterostructure composites were measured by the energy dispersive X-ray spectrometry (EDS).Measurement of gas sensor
Two copper–gold alloy probes as the electrode were placed on the surface of silicon wafer covered by α-Fe2O3/SnO2 heterostructure nanowires arrays for the measurement of resistance of gas sensing device. A ceramic heating plate (area = 1 cm × 1 cm; thickness = 1 mm) was used as the heater to regulate and control the entire operating temperature of the sensor. The measurement of sensing performances of sensor was processed by a static process. At the beginning, the test chamber was filled with fresh air, after the resistance reaching a constant value (Ra), then a given amount of the test gas was injected into the closed chamber for the measurement of the sensing performance, finally, when the resistance reached a constant value (Rg), we opened the vacuum pump to pump the test gas and the sensors began recovering to initial resistance (Ra). The gas response is defined as S = ((Ra − Rg)/Ra) × 100% for reducing gas. Ra and Rg were the resistances in air and the test gas atmosphere, respectively. The response time and recovery time were defined as the time taken by the sensor to achieve 90% of the total resistance change in the case of adsorption and desorption, respectively.Results and discussion
Structure, composition, and morphological properties of SnO2 and α-Fe2O3/SnO2 heterostructure composites
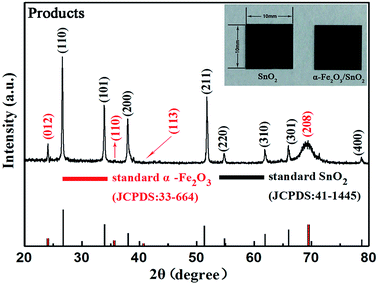
The phase and composition of the final products were identified by powder X-ray diffraction (XRD). Fig. 1 shows the typical XRD pattern of the as-synthesized α-Fe2O3/SnO2 heterostructure composites. It can be found that most of the diffraction peaks could be indexed to the tetragonal rutile structure of SnO2, which were good agreement with the standard card (JCPDS: 41-1445), the residual peaks could be matched with the rhombohedral structure of α-Fe2O3, which was agreed with the standard card (JCPDS: 33-664). By contrast, the peaks of α-Fe2O3 were weaker than those of SnO2 in the composites. The possible reason is that the component of composite is mostly SnO2. But obviously, it could be seen from the image that the color of the pure SnO2 was different from that of composites, further indicating the presence of α-Fe2O3.The morphologies and microstructures of the as-obtained α-Fe2O3/SnO2 composite were analyzed by field emission scanning electron microscopy (FESEM), as shown in Fig. 2(a)–(c). Fig. 2(a)–(c) displays the typical FESEM images of the SnO2 product prepared by the first USP method. It can be seen from the top-surface image of sample at low and high magnification (Fig. 2(a) and (b)) that the aligned nanowires arrays were clearly observed. Moreover, no other morphologies could be detected, indicating a high yield of these 1D nanostructures. Fig. 2(c) is a cross-sectional view of the nanowires arrays, showing that the average length of nanowires was about 800 nm. After hydrothermal reaction, the initially smooth SnO2 nanowires branched out which formed α-Fe2O3/SnO2 heterostructure composites. The FESEM images of heterostructure composites are shown in Fig. 2(d)–(f). It could be seen from the image that the arrays architectures were maintained (Fig. 2(d) and (e)). The high-magnification FESEM image of Fig. 2(f) displays the detailed morphological information of heterostructure composites. It is found that most SnO2 backbone nanowires appeared to surround by α-Fe2O3 nanorods with different orientations, and these nanorod branches had a relatively uniform length (30–50 nm).
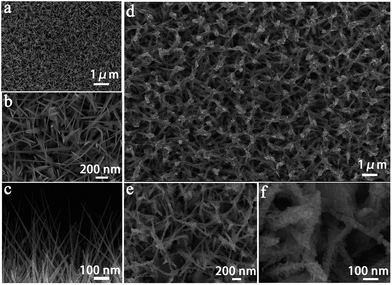 | ||
| Fig. 2 (a–c) Field emission scanning electron microscopy (FESEM) images of the pure SnO2, and (d–f) as-synthesized α-Fe2O3/SnO2 heterostructure composites. | ||
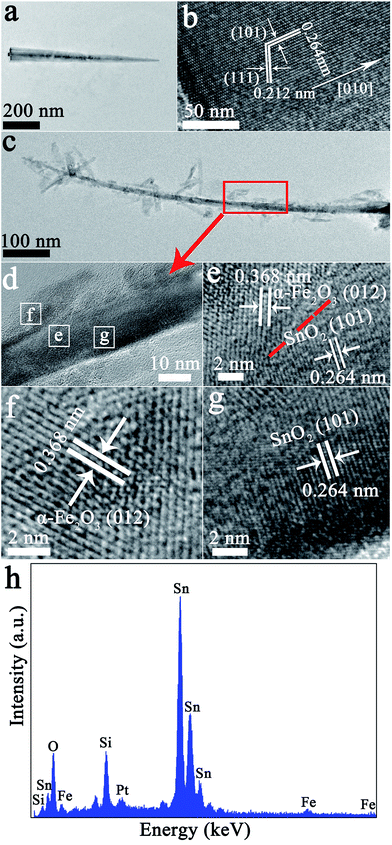
Further structural characterization of the SnO2 nanowires and branched α-Fe2O3/SnO2 heterostructure was carried out by TEM and HRTEM. A typical TEM image of a single SnO2 nanowires is displayed in Fig. 3(a), showing that the nanowires had a smooth surface and the length was about 800 nm. The HRTEM image of Fig. 3(b) shows clear lattice fringes that indicates single-crystalline of the SnO2 nanowires. The lattice fringe spacing of 0.264 nm and 0.212 nm corresponded to the (101) and (111) planes of the rutile SnO2 crystal. And growth appears to occur in the [010] direction. A typical TEM image in Fig. 3(c) shows a part of the α-Fe2O3/SnO2 heterostructure. It is clear that SnO2 backbone nanowires was surround by many α-Fe2O3 nanorods with different orientations, which was good agreement with FESEM observation. A typical HRTEM image of the interfacial region in α-Fe2O3/SnO2 branched nanowires (outlined in red box of the inset of Fig. 3(c)) is displayed in Fig. 3(e)–(g) HRTEM images (corresponding the selected area marked with a white rectangle in Fig. 3(d), respectively), indicating a good lattice compatibility at the interface region. The fringe spacings were about 0.264 nm and 0.368 nm for the backbone SnO2 nanowires and the branched α-Fe2O3 nanorod, respectively, which corresponded to the (101) plane of rutile SnO2 and the (012) plane of rhombohedral α-Fe2O3. The EDS analysis (Fig. 3(h)) demonstrates that the component of heterostructure composites consisted of Sn, Fe and O. Besides, the Si and Pt element signal in the spectrum was attributed to such novel heterostructure composites were grew on the silicon wafer decorated with Pt.
Gas sensing properties of primary SnO2 and the α-Fe2O3/SnO2 heterostructure composites
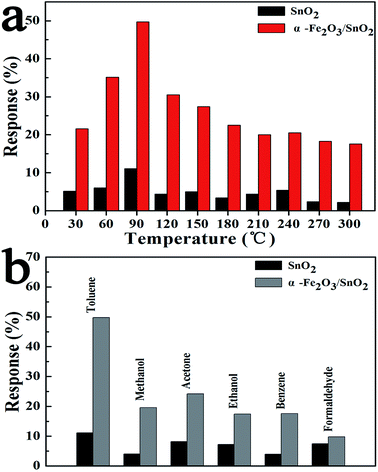
In recent years, environmental pollution and public safety have caused increasing concerns. Consequently, gas sensors with excellent performances have become a hot topic because of their potential application in detecting toxic, flammable and combustible gases, for which a gas sensor based on the as-prepared α-Fe2O3/SnO2 heterostructure composites was fabricated and a series of gas sensing measurements were carried out to evaluate its sensing performances. The gas response of a semiconductor oxide sensor is highly depending on its operating temperature.31 In order to explore the optimum operating temperature of primary SnO2 and the α-Fe2O3/SnO2 heterostructure composites, the relationship between operating temperature and gas sensing response was carried out in Fig. 4(a). It is clearly seen that the response to toluene varied with the temperature with an “increase-maximum-decrease” tendency and reached its maximum at 90 °C. Therefore, this temperature was chosen as the optimal operating for two sensors. Moreover, the responses of the sensor based on α-Fe2O3/SnO2 heterostructure composites to 100 ppm toluene (C6H5CH3) were obviously higher than that of primary SnO2. Compared with the SnO2 nanowires arrays (11.1%), the response to toluene was enhanced about 5 times (49.7%) at 90 °C with α-Fe2O3 nanorod introduced to form the branched α-Fe2O3/SnO2 heterostructure composites.Since the selectivity is a remarkable aspect of sensing properties, consequently, the primary SnO2 nanowires arrays and α-Fe2O3/SnO2 heterostructure composites-based gas sensors to various kinds of test gases with a concentrations of 100 ppm were investigated at 90 °C, respectively as shown in Fig. 4(b). The response of α-Fe2O3/SnO2 heterostructure composites toward toluene, methanol, acetone, ethanol, benzene and formaldehyde were 49.7%, 19.58%, 24.21%, 17.44%, 17.58% and 9.75% (the response of primary SnO2 were 11.11%, 4.1%, 8.21%, 7.25%, 4% and 7.5%). Obviously, the sensor based on α-Fe2O3/SnO2 heterostructure composites exhibited much higher response to all test gases compared with the sensor using primary SnO2 nanowires arrays, and the largest increase can be observed for toluene, which is as 5-fold as high as the primary SnO2 nanowires arrays, and implied the good selectivity in detecting toluene.
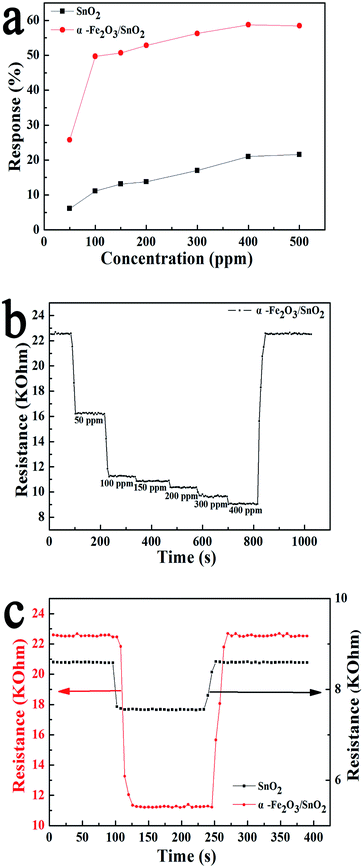
Fig. 5(a) shows the response of the α-Fe2O3/SnO2 heterostructure composites and primary SnO2 nanowires arrays versus the concentration of toluene at 90 °C. Similar to primary SnO2 nanowires arrays, the response of composites increased with increasing concentration of toluene. However, the responses of α-Fe2O3/SnO2 heterostructure composites were obviously higher than that of primary SnO2 nanowires arrays, indicating that the introduction of α-Fe2O3 enhanced the sensing performance. The response and recovery behaviors were further investigated by the α-Fe2O3/SnO2 heterostructure composites sensor being exposed to different concentration of toluene at 90 °C, as shown in Fig. 5(b). It is found that the responses were proportion to the increasing concentration of toluene from 50 ppm to 400 ppm, but slowly tended to saturation when concentrations became higher.
The response was about 25%, 49.7%, 51%, 53%, 55% and 57% to 50, 100, 150, 200, 300 and 400 ppm to toluene, respectively. Moreover, when the sensor was exposed to air atmosphere, the resistance could almost return to the initial quickly. Fig. 5(c) presents the dynamic response and recovery characteristics of SnO2 nanowires arrays and α-Fe2O3/SnO2 heterostructure composites toward toluene (100 ppm) at 90 °C, respectively. The almost square response shape observed indicated that the sensor first responded rapidly to test gases and achieved a near steady state.32 Then the resistance of the sensor changed slightly due to analyte gas diffusing through the material and occupying the remaining surface reaction sites. When the sensor was exposed to air, the resistance returned to the initial resistance. The time of response was within 20 s. After exposure in air, the time of recovery was 15 s. The three reversible cycles of the response curve showed a stable and repeatable characteristic (Fig. S1†).
A comparison between the sensing performances of the sensor and some previously literature reports is summarized in Table 1. It is clear to see that the sensor fabricated in our work exhibits better sensing performances compared with those reported in the literature.33–38 And the gas sensor based on α-Fe2O3/SnO2 nanowires arrays possessed a higher response than most other gas sensors at low operating temperature.
| Materials | Operating temperature (°C) | Toluene concentration (ppm) | The formula of response | Sensor response | References |
|---|---|---|---|---|---|
| SnO2 nanofibers | 350 | 100 | Ra/Rg | 6 | 33 |
| SnO2 nanoparticle | 400 | 100 | (Ra − Rg)/Ra × 100% | 10% | 34 |
| α-Fe2O3 porous nanoshuttles | 440 | 100 | Ra/Rg | 2.3 | 35 |
| La–SnO2 nanorod arrays | 290 | 200 | Ra/Rg | 3 | 36 |
| Cu–α-Fe2O3 | 225 | 100 | Ra/Rg | 1.25 | 37 |
| α-Fe2O3/SnO2 nanotubes | 300 | 100 | Ra/Rg | 4.2 | 38 |
| α-Fe2O3/SnO2 nanowires arrays | 90 | 100 | (Ra − Rg)/Ra × 100% | 49.7% | This work |
Gas sensing mechanism
According to the above results, the sensor based on the as-prepared α-Fe2O3/SnO2 heterostructure composites showed an enhanced sensing characteristics compared with the primary SnO2 nanowires arrays. In general, both α-Fe2O3 and SnO2 are n-type semiconductor oxides and their sensing mechanism is usually explained by the change in thickness of electron depletion layer generated by the adsorption and desorption process of oxygen molecules on the surface of sensing materials.39–41 When a metal oxide semiconductor gas sensor is exposed to air, the oxygen adsorbents (O2−, O−or O2−) are formed due to oxygen molecules capturing free electrons from the surface of the sensing materials conduction band. Thus, the carrier-depleted layer on the surface of materials becomes thicker, resulting in a decrease of electron concentration and conductivity of the gas sensing materials. On exposure to reducing gases, for instance, the toluene molecules will react with the oxygen species on the surface and release electrons back to the conduction band, thereby increasing the electron concentration and decreasing the thickness of the depletion layer and sensor conductivity in toluene, as shown in Fig. 6(a).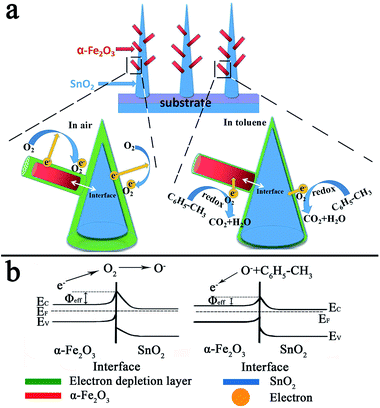 | ||
| Fig. 6 (a) Schematic diagrams of the proposed mechanism of α-Fe2O3/SnO2 heterostructure composites and (b) energy band structure of α-Fe2O3/SnO2 heterostructure in air and in toluene atmosphere. | ||
The enhancement in gas sensing properties on α-Fe2O3/SnO2 heterostructure composites is likely to be the result of two factors. First of all, the synergetic effect of α-Fe2O3 and SnO2.42 For the as-prepared α-Fe2O3/SnO2 heterostructure nanowires arrays, the surfaces of SnO2 hexahedron are not completely enclosed by α-Fe2O3 nanoparticles, results in both of them are highly accessible for the adsorption of oxygen molecules. Then, according to the semiconductor heterojunction theory, the heterojunction with potential barriers will form at the interfaces between α-Fe2O3 (Eg = 2.2 eV, Φ = 5.88 eV) and SnO2 (Eg = 3.5 eV, Φ = 4.9 eV) due to their different band gaps (Eg) and work functions (Φ), the energy band structure of the α-Fe2O3/SnO2 heterojunction can be schematically depicted in Fig. 6(b), in which Φeff is the effective barrier height.43 The electrons in α-Fe2O3 and SnO2 conduction band are trapped in ionized oxygen molecules in air, which will lead to the increase of Φeff, as shown in Fig. 6(b). In this case, the conductivity of the heterojunction is very low because of the higher barrier potential. However, once it contacts with reducing gas on the gas sensitive surface (e.g. HCHO, toluene, etc.), reactions will occur between oxygen ions and target gas molecules,44 resulting in the release of electrons back into the conduction band of α-Fe2O3 and SnO2. Thus, the barrier height of the surface is reduced and the conductivity of the heterostructure will greatly increase,45 as shown in Fig. 6(b). It means that the response of heterostructure nanowires arrays to toluene can be enhanced. Therefore, the synergetic effect and the change in barrier height at different gas atmosphere are likely to the origin of the enhancement.
Conclusions
In summary, novel heterostructure composites composed of SnO2 nanowires arrays and α-Fe2O3 nanorod branches had been successfully synthesized by using USP method and hydrothermal strategy. As proof-of-concept demonstration of the function, such α-Fe2O3/SnO2 composites was used as the sensing material of a gas sensor. The α-Fe2O3/SnO2 sensor exhibited high response and good selectivity to toluene at 90 °C, in comparison to the SnO2 nanowires arrays structures. The synergetic effect exerted by α-Fe2O3 and SnO2 as well as the change of heterojunction barrier at the different gas atmosphere are probably responsible for the enhanced performance.Acknowledgements
This work is supported by the National Nature Science Foundation of China (No. 61520106003, 61503148, 61327804, 61374218, 61134010), Program for Chang Jiang Scholars and Innovative Research Team in University (No. IRT13018) and National High-Tech Research and Development Program of China (863 Program, No. 2013AA030902 and 2014AA06A505). China Postdoctoral Science Foundation funded project No. 2015M580247.Notes and references
- K. Wetchakun, T. Samerjai, N. Tamaekong, C. Liewhiran, C. Siriwong, V. Kruefu, A. Wisitsoraat, A. Tuantranont and S. Phanichphant, Sens. Actuators, B, 2011, 160, 580–591 CrossRef CAS
.
- G. Aleksander, Nanoscale, 2011, 3, 154–165 RSC
.
- B. B. Cao, J. J. Chen, X. J. Tang and W. L. Zhou, J. Mater. Chem., 2009, 19, 2323–2327 RSC
.
- L. Renard, J. Brotz, H. Fuess, A. Gurlo and R. Riedel, ACS Appl. Mater. Interfaces, 2014, 6, 17093–17101 CAS
.
- R. Laetitia, B. Odile, S. Hassan, F. Hartmut, B. Joachim, G. Aleksander, A. Emmanuel, K. Andreas and T. Thierry, Nanoscale, 2012, 4, 6806–6813 RSC
.
- S. Singkammo, A. Wisitsoraat, C. Sriprachuabwong, A. Tuantranont, S. Phanichphant and C. Liewhiran, ACS Appl. Mater. Interfaces, 2015, 7, 3077–3092 CAS
.
- M. Punginsanga, A. Wisitsora-atb, A. Tuantranontb, S. Phanichphantc and C. Liewhiran, Sens. Actuators, B, 2015, 210, 589–601 CrossRef
.
- S. Agarwala, Z. H. Lim, E. Nicholsonb and G. W. Ho, Nanoscale, 2012, 4, 194–205 RSC
.
- P. Sun, Z. Zhu, P. L. Zhao, X. S. Liang, Y. F. Sun, F. M Liu and G. Y. Lu, CrystEngComm, 2012, 14, 8335–8337 RSC
.
- Z. Y. Sun, H. Q. Yuan, Z. M. Liu, B. X. Han and X. R. Zhang, Adv. Mater., 2005, 17, 2993–2997 CrossRef CAS
.
- T. Waitz, T. Wagner, T. Sauerwald, C. D. Kohl and M. Tiemann, Adv. Funct. Mater., 2009, 19, 653–661 CrossRef CAS
.
- S. Vallejos, T. Stoycheva, P. Umek, C. Navio, R. Snyders, C. Bittencourt, E. Llobet, C. Blackman, S. Moniz and X. Correig, Chem. Commun., 2011, 47, 565–567 RSC
.
- N. Tamaekong, C. Liewhiran, A. Wisitoraat and S. Phanichphant, Sensors, 2010, 10, 7863–7873 CrossRef CAS PubMed
.
- X. W. Li, X. Zhou, H. Guo, C. Wang, J. Y. Liu, P. Sun, F. M. Liu and G. Y. Lu, ACS Appl. Mater. Interfaces, 2014, 6, 18661–18667 CAS
.
- M. M. Arafat, B. Dinan, S. A. Akbar and A. S. M. A. Haseeb, Sensors, 2012, 12, 7207–7258 CrossRef CAS PubMed
.
- C. W. Na, H. S. Woo, I.-D. Kimb and J. H. Lee, Chem. Commun., 2011, 47, 5148–5150 RSC
.
- F. Gao, G. H. Qin, Y. H. Li, Q. P. Jiang, L. Luo, K. Zhao, Y. J. Liuc and H. Y. Zhao, RSC Adv., 2016, 6, 10298–10310 RSC
.
- N. Yamazoe, K. Suemastu and K. Shimanoe, Sens. Actuators, B, 2016, 227, 403–410 CrossRef CAS
.
- X. H. Sun, H. R. Hao, H. M. Ji, L. Li, S. Cai and C. M. Zheng, ACS Appl. Mater. Interfaces, 2014, 6, 401–409 CAS
.
- K. Inyawilert, A. Wisitsora-at, A. Tuantranont, P. Singjai, S. Phanichphant and C. Liewhiran, Sens. Actuators, B, 2014, 192, 745–754 CrossRef CAS
.
- X. L. Li, T. J. Lou, X. M. Sun and Y. D. Li, Inorg. Chem., 2004, 43, 5442–5449 CrossRef CAS PubMed
.
- L. Wang, A. Teleki, S. E. Pratsinis and P. I. Gouma, Chem. Mater., 2008, 20, 4794–4796 CrossRef CAS
.
- P. Sun, W. Zhao, Y. Cao, Y. Guan, Y. F. Sun and G. Y. Lu, CrystEngComm, 2011, 13, 3718–3724 RSC
.
- H. K. Wang, F. Fu, F. H. Zhang, H. E. Wang, S. V. Kershaw, J. Q. Xu, S. G. Sun and A. L. Rogach, J. Mater. Chem., 2012, 22, 2140–2148 RSC
.
- N. D. Cuong, T. T. Hoa, D. Q. Khieu, T. D. Lam, N. D. Hoa and N. V. Hieu, J. Alloys Compd., 2012, 523, 120–126 CrossRef
.
- A. Rothschild and Y. Komem, J. Appl. Phys., 2004, 95, 6374–6380 CrossRef CAS
.
- P. Sun, C. Wang, J. Y. Liu, X. Zhou, X. W. Li, X. L. Hu and G. Y. Lu, ACS Appl. Mater. Interfaces, 2015, 7, 19119–19125 CAS
.
- W. Tanga, J. Wanga, P. J. Yaoa and X. G. Li, Sens. Actuators, B, 2014, 2, 13283–13292 Search PubMed
.
- W. Tanga, J. Wanga, P. J. Yaoa and X. G. Li, Sens. Actuators, B, 2014, 192, 543–549 CrossRef
.
- J. B. Sun, P. Sun, D. L. Zhang, J. Xu, X. S. Liang, F. M. Liu and G. Y. Lu, RSC Adv, 2014, 4, 43429–43435 RSC
.
- H. Gong, J. Q. Hu, J. H. Wang, C. H. Ong and F. R. Zhu, Sens. Actuators, B, 2006, 115, 247–251 CrossRef CAS
.
- S. C. Naisbitt, K. F. E. Pratt, D. E. Williams and I. P. Parkin, Sens. Actuators, B, 2006, 114, 969–977 CrossRef CAS
.
- Q. Qia, T. Zhang, L. Liu and X. J. Zheng, Sens. Actuators, B, 2009, 137, 471–475 CrossRef
.
- D. S. Lee, Y. T. Kima, J. S. Huh and D. D. Lee, Thin Solid Films, 2002, 416, 271–278 CrossRef CAS
.
- S. R. Wang, Y. S. Wang, H. X. Zhang, X. L. Gao, J. D. Yang and Y. Wang, RSC Adv., 2014, 4, 30840–30849 RSC
.
- F. Gao, G. H. Qin, Y. H. Li, Q. P. Jiang, L. Luo, K. Zhao, Y. J. Liu and H. Y. Zhao, RSC Adv., 2016, 6, 10298–10310 RSC
.
- P. Sun, C. Wang, X. Zhou, P. F. Cheng, K. Shimanoeb, G. Y. Lu and N. B. Yamazoe, Sens. Actuators, B, 2014, 193, 616–622 CrossRef CAS
.
- Q. X. Yu, J. H. Zhu, Z. Y. Xu and X. T. Huang, Sens. Actuators, B, 2015, 213, 27–34 CrossRef CAS
.
- N. Yamazoe, G. Sakai and K. Shimanoe, Catal. Surv. Asia, 2003, 7, 63–75 CrossRef CAS
.
- N. Barsan and U. Weimar, J. Electroceram., 2001, 7(3), 143–167 CrossRef CAS
.
- J. Yu, S. J. Ippolito, W. Wlodarski, M. Strano and K. Kalantar-zadeh, Nanotechnology, 2010, 2126, 265502 CrossRef PubMed
.
- Q. X. Yu, J. H. Zhu, Z. Y. Xu and X. T. Huang, Sens. Actuators, B, 2015, 213, 27–34 CrossRef CAS
.
- T. Weis, R. Lipperheide and U. Whille, J. Appl. Phys., 2002, 92, 1411–1418 CrossRef CAS
.
- Y. Shimizu, N. Kuwano, T. Hyodo and M. Egashira, Sens. Actuators, B, 2002, 83, 195–201 CrossRef CAS
.
- J. Yu, S. J. Ippolito, W. Wlodarski, M. Strano and K. Kalantar-zadeh, Nanotechnology, 2010, 21, 265502 CrossRef CAS PubMed
.
Footnote |
| † Electronic supplementary information (ESI) available. See DOI: 10.1039/c6ra05313k |
| This journal is © The Royal Society of Chemistry 2016 |

