A new approach to the determination of folic acid at trace levels: using a Fe(III)-folic acid complex to amplify analytical signal

Songül Ulusoya, Hilal Acıderelib, Selim Erdoğanc and Halil İbrahim Ulusoy*d
aDepartment of Biomedical Engineering, Faculty of Technology, Cumhuriyet University, 58140, Sivas, Turkey
bDepartment of Biochemistry, Faculty of Pharmacy, Cumhuriyet University, 58140, Sivas, Turkey
cDepartment of Analytical Chemistry, Faculty of Pharmacy, İnonu University, 44100, Malatya, Turkey
dDepartment of Analytical Chemistry, Faculty of Pharmacy, Cumhuriyet University, 58140, Sivas, Turkey. E-mail: hiulusoy@yahoo.com; Fax: +90 346 219 16 34; Tel: +90 346 219 10 10 3905

Received 28th February 2016 , Accepted 2nd April 2016

First published on 5th April 2016


Abstract

A fast, efficient, cost-effective, and environmental-friendly analytical methodology was developed for preconcentration and determination of trace folic acid in food samples prior to high performance liquid chromatography with diode array detection (HPLC-DAD). The method is based on formation of stable complexes between folic acid and Fe(III) ions at pH 8.0. The formed complexes were extracted to a nonionic surfactant phase containing PONPE 7.5. The surfactant rich phase (SRP) was separated by decantation and diluted with 300 μL of a mixture of 1 M HCl and methanol at a 1[thin space (1/6-em)]:[thin space (1/6-em)]1 ratio. The parameters and variables that affected the method were also investigated and optimized in detail. The limit of detection (LOD) of folic acid was 6.06 ng mL−1, the linear range of quantitation for folic acid was 20–1200 ng mL−1 and the correlation coefficients of the calibration curves were 0.9976. The average recoveries and relative standard deviations in the analysis of real samples were in the range of 95.1–105.1% and 1.73–5.25%, respectively. After validation of the method was carried out, the method was applied to the determination of folic acid in real samples, including baby foods, vegetables, cereals, and pharmaceutical samples.

1. Introduction

Vitamins are biologically active organic compounds and essential micronutrients for metabolic and physiological functions in the human body. They are necessary for normal health and growth, and sufficient amounts should be supplied by food.1 Micronutrient deficiency is known to be the most important problem for about one third of the world population. It directly affects mental and physical development in the population and lowers the quality of life. Malnutrition and metabolic diseases can lead to vitamin deficiency, which has very significant clinical symptoms, whereas excessive vitamin intake, particularly of fat-soluble vitamins, can result in various diseases.2

Folic acid (FA) consists of a bicyclic pteridine linked by a methylene bridge to p-aminobenzoic acid, which is joined by a peptide linkage to a single molecule of α-glutamic acid. Deficiency of folic acid resulting from anemia can prevent birth-defects, cardiovascular and cerebrovascular diseases, and certain types of cancer, at the increasing risk of heart attack.3 New research and clinical studies have shown that the role of FA in human health is far more important than its use as a vitamin and dietary supplement. The goal of FA supplementation is to reduce the risk of heart diseases and the risk of women giving birth to babies with neural tube defects (spina bifida).4 The normal levels of FA in human blood serum often range between 2 and 15 ng mL−1.5 However, these levels can be altered by various causes such as increased cell proliferation occurring in association with pregnancy, lactation, haemolytic anaemia, myeloproliferative disorders, and extensive psoriasis.6

Nowadays, a great amount of attention is being given to the correct determination of vitamins from all sources, including foods, biological materials, and dietary supplements. Analysis of FA, however, is not an easy task because of its extremely low concentration in real samples, low stability under acidic conditions, and sensitivity to light and high temperature. Numerous methods have been used for the determination of FA, including electrochemical sensing7 spectrophotometry,8 flow injection chemiluminesence,9 fluorimetric methods,10 high-performance liquid chromatography (HPLC) with ECD,11 LC-MS,12 and capillary electrophoresis.13 The analytical advantages of HPLC over other analytical techniques are solvent economy, high efficiency, mass sensitivity, easy coupling with other techniques, and finally, requirement of only small amounts of sample.14

In recent decades, the development of preconcentration methods to be implemented prior to analytical determinations of trace level compounds has been explored in considerable depth. Separation and preconcentration procedures are always considered to be of great importance in analytical and environmental chemistry. The use of micellar systems such as CPE has attracted considerable attention in the last decade, mainly because it is in agreement with “green chemistry” principles.15,16 Comprehensive reviews of the theory and applications of surfactant-mediated separation in analytical chemistry are available.17,18 Although many successful applications have been reported, several workers agree that these complex systems require a great deal of fundamental research.19–22 Compared with liquid–liquid extraction, solid phase extraction and matrix solid phase dispersion, CPE has a large number of advantages. It is simple and provides high efficiency enrichment and extraction, and it does not require an organic solvent. Furthermore, the utilized surfactants are degradable and protect the activity of targets.23,24

Although many HPLC methods are available for FA determination, no pre-concentration based technique has hitherto been reported that can determine the analyte in real samples with high simplicity. The purpose of this study was to develop and validate a new, simple, low cost, and sensitive method for the determination of folic acid (vitamin B9) in real samples. To the best of our knowledge, this study is the first report describing the application of a CPE method for the determination of folic acid by a HPLC-DAD system.

2. Experimental

2.1. Instrumentation

The chromatographic system used is equipped with a pump, model LC20-AD (Shimadzu); thermostatic oven, CTO-10 AS (Shimadzu); autosampler, SIL-20Ac (Shimadzu); and DAD detector, model SPD-M20A (Shimadzu). LC solution software (Shimadzu) was used to transfer data to the computer. An Inertsil C18 (250 mm × 4.6 mm, 5 μm) column was used for chromatographic separation.

A pH meter with a glass-calomel electrode (Selecta, Spain) was used to measure the pH values. A thermostatic water bath (Microtest, Turkey) was used to keep the temperature constant. A centrifuge (Hettich, Universal 120, England) was used for complete phase separation.

2.2. Reagents and standard solutions

All reagents used were of analytical grade. Ultra-pure water with a resistivity of 18.2 MΩ was used in all experiments and was provided by an ELGA (Flex III, U.K) water purification system. Possible contaminations arising in the laboratory were minimized by stringent precautions at all stages of work. Folic acid (vitamin B9) was purchased from Sigma (St. Louis, MO, USA), and methanol and isopropyl alcohol were from Merck (Darmstadt, Germany). 1000 mg L−1 Fe(III) were prepared using iron nitrate salt bought from Merck. The solutions of PONPE 7.5, a polyoxyethylene glycol monoether-type surfactant (Sigma, St. Louis, MO, USA), were prepared by dissolving in water. The ionic surfactant solutions (3.0 × 10⁻³ mol L−1 of cetyl pyridinium chloride (CPC), cetyltrimethylammonium bromide (CTAB), and sodium dodecylsulphate (SDS)) were prepared by dissolving an appropriate amount of the chemical (Sigma, St. Louis, MO, USA) in water.

2.3. Chromatographic analysis

Chromatography was performed using a Shimadzu HPLC system (Tokyo, Japan) equipped with a quaternary pump, degasser, column compartment, and UV detector. Separations were performed on an Inertsil ODS-3 (5 μm, 4.6 mm × 250 mm) column. Methanol and pH 3 phosphate buffer, including 0.001 mol L−1 sodium hexane sulfonate, was used as the mobile phase, and an isocratic elution was employed. The other chromatographic conditions were as follows: column temperature: 40 °C, flow rate: 1.0 mL min−1, injection volume: 10 μL, detection wavelength: 284 nm.

2.4. The proposed procedure

A 10 mL aliquot of sample containing folic acid (in the range of 25–1250 ng mL−1) was placed in a screw-cap centrifuge falcon tube. Then, 3.0 mL of pH 8.00 tris buffer, 0.8 mL of 1000 mg L−1 Fe(III) solution, and 1.2 mL of 5% (w/v) PONPE 7.5 were added and completed to 50 mL with ultra-pure water. This mixture was incubated in a water bath at 45 °C for 10 min. The efficient phase separation was carried out by centrifugation at 4000 rpm for 5 min. The aqueous phase was removed with a simple decantation, and the surfactant-rich phase was deposited at the bottom of the tube. Then, the surfactant-rich phase was diluted with 300 μL of a mixture of 1 M HCl in methanol and filtrated through a 0.45 μm membrane. Finally, the samples were introduced into the HPLC system for analysis.

2.5. Preparation of samples for analysis

Sample preparation is one of the most important and difficult steps in vitamin analysis. In most cases, the vitamins have to be extracted from the matrix; however, for the analysis of vitamins in additives, raw materials or soft drinks, a pre-treatment of the sample may not be necessary. It is important to verify that the chosen sample preparation method is suitable for the analysis of the vitamins of interest, because all vitamins are unstable during common sample preparation methods (boiling for deprotonation, alkali- or acid-treatment). In the case of complex samples, such as multivitamin preparations, foods, plant extracts, serum, or urine, determining trace organic molecules such as folic acid requires a lot of tedious work that includes pretreatment steps, and the methods may still result in interference or a matrix effect.25

A method published by Mirmoghtadaie et al. was used after a few modifications in the preparation of food samples and certified reference materials (CRM) prior to analysis.26 According to this method, a vitamin tablet including folic acid was ground and dissolved in 0.10 mol L−1 NaOH in a 100 mL standard flask. The mixture was filtered after stirring for 15 min. The other food samples were prepared by dispersing in an appropriate amount of 0.10 mol L−1 NaOH solution and stirred for 1 hour. The solution was centrifuged at 5000 rpm for 10 min. Furthermore, the mixture was filtered using a 0.45 μm micropore membrane. Finally, the developed CPE-HPLC method was applied to 10 mL of the prepared samples after neutralization with 0.01 mol L−1 HCl.

3. Results and discussions

Numerous pre-experiments were performed in order to ensure the transfer of folic acid molecules to the surfactant rich-phase. For this purpose, a conventional CPE method was applied to samples for direct transfer of folic acid to the micellar medium. Unfortunately, the obtained preconcentration factor was very low according to similar methods. According to our estimates, the transfer of vitamin molecules to the surfactant rich phase was very low; moreover, the obtained signals were weak. To overcome this problem, the complexation of folic acid with various metal ions has been utilized. Folic acid has functional groups that help it form complexes with metal ions. After CPE was applied using metal ions [Cu(II), Mn(II), Fe(II), Fe(III), Al(III), Zn(II), and Ag(I)], the contents of folic acid in the surfactant rich phase were analyzed by HPLC. As can be seen in Fig. 1, the best signals were obtained with Fe(III) ions. All experimental variables were optimized in order, after good signals were obtained with Fe(III) ions.
image file: c6ra05286j-f1.tif
Fig. 1 The effects of various ions on CPE of folic acid (n = 3).

3.1. Effect of pH and buffer volume

Solution acidity plays an important role in the CPE process when especially ionizable compounds are extracted to a micellar medium. In the CPE, the ionic form of a neutral molecule normally does not interact and bind with the micelle aggregate as strongly as its unionized form.27 However, changing the pH will change the ionization form of certain analytes and other components in the medium and will thereby affect their solubility in water and abilities of extraction. Of course, this circumstance is related to the molecular structures of the analyte and surfactant. The ionic form of a neutral molecule formed upon deprotonation of a weak acid or protonation of a weak base normally does not interact with and bind to the micellar aggregate as strongly as its neutral form.

The effect of pH on the CPE efficiency of folic acid was studied in the pH range of 6.0–10.0, and the results are shown in Fig. 2.


image file: c6ra05286j-f2.tif
Fig. 2 The effect of pH on the proposed method (n = 3).

As can be seen in Fig. 2, the best signals were obtained at pH 8.0. Folic acid has four acid ionization constants; pKa1: 2.29, pKa2: 3.50, pKa3: 5.05, and pKa4: 8.14.28 All protons of folic acid need to be ionized in order for it to form strong complexes with Fe(III). Therefore, better signals were obtained beyond pH 8.0.

The experiments were repeated using various buffer systems at pH 8.0 such as borate, phosphate, and tris buffer systems. According to experimental results, better signals were obtained with tris buffer than other buffer systems. Therefore, subsequent studies were made using pH 8.0 tris buffer. After a suitable pH and buffer type were selected using a series of buffer solutions, the optimal concentration of buffer (0.1 M) was studied in the range 0–7 mL in final solution volume of 50 mL. According to experimental results, the best signals were obtained using 2 mL of buffer solution in 50 mL of final solution.

3.2. Effect of Fe(III) concentration

As mentioned in the previous sections, folic acid could be transferred to the surfactant-rich phase itself. However, the signals obtained from this transfer and pre-concentration factor were also lower than expected. Various metal ions were tried in order to increase the signals, and the best signals were obtained using Fe(III), as shown in Fig. 3. In order to find the optimal Fe(III) concentration for the proposed method, the effect of Fe(III) concentration was studied in the range of 0–30 mg L−1.
image file: c6ra05286j-f3.tif
Fig. 3 The effect of Fe(III) concentration on the proposed method (n = 3).

As can be seen in Fig. 3, the obtained signals increased until 16 mg L−1 and decreased after this concentration. Therefore, 16 mg L−1 Fe(III) was used in the subsequent experiments.

3.3. Effect of ionic surfactant concentration

In CPE experiments, the usage of a second surfactant may increase the yield from the pre-concentration. Sometimes, an ionic surfactant acts as a secondary ligand and balances ionic charges at equilibrium, such that more target molecules can be passed to the surfactant-rich phase. By considering this effect, various ionic surfactants were tried in order to obtain more quantitative results. Two cationic (CPC and CTAB) and one anionic surfactant (SDS) were used in the experiments. As a result of experimental studies, it was observed that preconcentration of folic acid was not affected or increased by ionic surfactants, as expected. Therefore, we decided to not use an ionic surfactant in order to simplify the procedure.

3.4. Effect of nonionic surfactant concentration

To the best of our knowledge and based on the literature, the high background absorbance that is produced by many surfactants in the UV region can interfere with the determination of an analyte by the HPLC-UV system, and this problem can be resolved using surfactants that do not have an absorption peak at the same wavelength as that of the targets, adding a mobile phase that contains methanol to the surfactant29 or applying a back-extraction procedure to remove the surfactant.30 According to Ren et al., Triton X-100 has strong UV absorption above 210 nm and is not suitable for samples with a low content of target molecules.31 PONPE 7.5 does not absorb at 284 nm and will not interfere in the determination of folic acid. Therefore, PONPE 7.5 was selected for this study.

The extraction efficiency is maximized in a successful CPE procedure by minimizing the phase volume ratio. The extraction efficiency of relatively apolar organic compounds may reach 100% even when very low surfactant concentrations are used. The preconcentration factor is defined as the volume ratio before and after phase separation. This can be regarded as an indicator of the increase of the concentration of analytes in the surfactant-rich phase.32

The effect of PONPE 7.5 concentration on the CPE of folic acid was evaluated by varying the surfactant concentration in the range of 0.00–0.15% (w/v). At low concentration of nonionic surfactant, the extraction efficiency is decreased probably due to the inability of the surfactant assemblies to quantitatively entrap the hydrophobic molecules. As can be seen from Fig. 4, the measured absorbance reached its maximum at higher concentrations, above 0.12% (w/v), of PONPE 7.5, indicating that quantitative extraction by CPE was obtained. Therefore, this concentration was selected as the optimum amount of nonionic surfactant for subsequent uses.


image file: c6ra05286j-f4.tif
Fig. 4 The effect of surfactant concentration on the proposed method (n = 3).

3.5. Effect of equilibration temperature and incubation time

Optimal equilibration temperature and incubation time are necessary to complete reactions and to achieve an easy and efficient phase separation and preconcentration. It was desirable to employ the shortest equilibration time and the lowest possible equilibration temperature as a compromise between completion of extraction and efficient phase separation. The dependence of extraction efficiency on equilibration temperature and time was studied in the range of 20–60 °C and 5–80 min, respectively. The results show that an equilibration temperature of 45 °C and a time of 10 min were adequate to achieve quantitative extraction.

3.6. Selection of the diluent for the surfactant rich phase

In order to facilitate the sample introduction into the HPLC autosampler, it is necessary to decrease the viscosity of the surfactant-rich phase (SRP). An ideal solvent for this purpose must completely dissolve the surfactant rich phase and also be suitable for the detection system. The used solvents were selected by considering their solvation power and acidity. After CPE, 1 mL of the solvent was added to the tube in order to dilute the SPR phase. A mixture of various solvents with methanol was tried at a 1[thin space (1/6-em)]:[thin space (1/6-em)]1 ratio. As can be seen in Fig. 5, the best signals were obtained with a mixture of 1 mol L−1 HCl and methanol at a 1[thin space (1/6-em)]:[thin space (1/6-em)]1 ratio. Therefore, subsequent studies were made using this solvent.
image file: c6ra05286j-f5.tif
Fig. 5 Effect of solvent type used to dilute the surfactant rich phase (n = 3).

The pre-concentration factor is directly affected by the volume of the solvent. Therefore, it needs to be optimized for high extraction efficiency. The used volume should be as small as possible in order to obtain the highest preconcentration factor. As expected, the preconcentration factor decreases with increasing solvent volume. The minimum volume required for HPLC micro-vials is 100 μL. However, it is difficult to dissolve and filter the SRP at volumes lower than 200 microliters. The effect of solvent volume was investigated in the range of 200–1500 μL. As can be seen in Fig. 6, the maximum analytical signals were obtained using 300 μL of solvent mixture.


image file: c6ra05286j-f6.tif
Fig. 6 Effect of solvent amount for dissolving surfactant rich phase on analytical signal (n = 3).

3.7. Effect of ionic strength

The effect of ionic strength can be discussed in two main ways. First, most of the real samples have complex matrix components, so the application of the newly developed method in the presence of concentrated electrolytes means that the method can be applied to real samples without any negative influence from common ions. The second approach is related to the salting-out effect. It is known that the presence of electrolytes decreases the cloud point temperature and increases efficiency of separation.33 The salt concentration is also a key parameter in CPE. The cloud point of micellar solutions can be altered by salt addition, alcohol, other surfactants, polymers, or some organic or inorganic compounds, which can cause an increase or decrease in the micellar phase solubility.34,35

The addition of an inert salt to the samples can influence the extraction/pre-concentration process, since it can alter the density of the aqueous phase. In order to study the effect of an electrolyte on CPE of folic acid molecules, NaCl solution was investigated as the electrolyte in the range of 0.0–2.7% (w/v). The results show that addition of NaCl does not have an important effect on CPE experiments until a concentration of 2.7% (w/v) or 0.34 mol L−1. As can be seen in Fig. 7, ionic strength does not have an important effect on the developed method. These results show that the proposed method can be applied to samples with high ionic strength without any negative effect.


image file: c6ra05286j-f7.tif
Fig. 7 The effect of electrolyte concentration on the proposed method (n = 3).

3.8. Effect of interfering ions

One of the biggest problems in the analysis of real samples is the presence of interfering species. During the chromatographic measurements, an efficient separation provided by the analytical column and selectivity obtained from the detector limit most of the interferences or decrease their effects on the results. However, some species can have negative effects on complex formation between Fe(III) ions and folic acid, and the yield from CPE may decrease dramatically due to these effects. When the new method was developed, possible interfering species were selected based on the matrix components of target samples.

Under the optimized conditions, interference studies were carried out by individually spiking gradually increased amounts of foreign interfering species into the standard solution containing folic acid at level of 100 ng mL−1 before CPE, and a deviation greater than ±5.0% from the signals observed in the absence of any foreign ions was used as the criterion for interference occurrence. Table 1 shows the tolerance limits of the diverse species. As can be seen in Table 1, the main matrix components of food samples do not interfere with the proposed method.

Table 1 Effect of possible matrix species on CPE efficiency of folic acid (N: 5, 100 ng mL−1 vitamin B9)
Interfering species Tolerance limits
K+, Na+, and NH4+ 1000
Cl, SO42−, Ba2+, Ca2+, acetate 750
NO3, vitamin C, PO43−, and CO32− 500
Cu2+, Mg2+, Zn2+ 350
Vitamin B5, Al3+ 300
Vitamin B3 and B12, Fe2+ 200
Vitamin B2 100


3.9. Analytic performance properties of the proposed method and applications

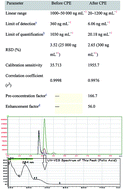
The newly developed method was optimized in detail, and its analytical merits were determined using standard solutions. The obtained data were illustrated in Table 2. The merits were presented together before and after CPE so that the contribution or success of the proposed method could be understood more effectively. As can be seen from Table 2, determinations of vitamin B9 (folic acid) at trace levels can be carried out by means of high preconcentration and enhancement factor. In addition, chromatograms obtained from folic acid analysis after CPE are presented in Fig. 8. It can be understood from the figure that peak area of folic acid in the surfactant rich phase is increased proportionally with concentration, and spectrum of this peak indicates that this peak belongs to folic acid.
Table 2 Analytical characteristics of the proposed method
Parameter Before CPE After CPE
a Based on statistical 3Sblank/m-criterion for ten replicate blank absorbance measurements.b Based on statistical 10Sblank/m-criterion for ten replicate blank absorbance measurements.c Preconcentration factor is defined as the ratio of the initial solution volume (50 mL) to the volume of surfactant rich phase (0.3 mL).d Enhancement factor is defined as ratio of slope of calibration before CPE to that after CPE.
Linear range 1000–50[thin space (1/6-em)]000 ng mL−1 20–1200 ng mL−1
Limit of detectiona 360 ng mL−1 6.06 ng mL−1
Limit of quantificationb 1030 ng mL−1 20.18 ng mL−1
RSD (%) 3.52 (25[thin space (1/6-em)]000 ng mL−1) 2.65 (300 ng mL−1)
Calibration sensitivity 35.713 1955.7
Correlation coefficient (r2) 0.9998 0.9976
Pre-concentration factorc 166.7
Enhancement factord 56.0


image file: c6ra05286j-f8.tif
Fig. 8 Chromatograms of folic acid (25.0, 50.0, 200.0, and 1000.0 ng mL−1) after CPE.

Analysis of certified reference materials (CRMs) and recovery tests were carried out for validation of the new method. Three different certified reference materials (NIST-3280, ERM BD6000) were used for validation of the proposed method. The results were evaluated by student t and F tests. CRM samples were prepared using the procedure given in Section 2.5. According to this method, 10 mL of the obtained solutions were presented for CPE experiments, and their vitamin contents were analyzed using the developed method. Results for validation analysis are presented in Table 3. The average values obtained using the calibration curve method are in good agreement with the certified values.

Table 3 The levels of folic acid (vitamin B9) in the certified reference materials (CRMs) after application of the developed procedure (N: 5)d
CRM Certified value, mg kg−1 Founda mg kg−1 % RSS Recovery% texp valueb Fexp valuec
a The average value of five replicates ± standard deviation.b The tabulated t-value at 95% confidence level is 2.45 for five replicate measurements.c The tabulated F value at 95% confidence level is 4.28 (N = 6).d NIST 3280: multi vitamin tablet ERM-BD 6000: milk powder.
NIST 3280 394 ± 22 386 ± 24 6.21 97.9 0.81 1.19
ERM-BD6000 0.74 ± 0.04 0.76 ± 0.05 6.57 102.1 0.09 1.56


The developed method was applied to various food and pharmaceutical samples in order to determine their folic acid contents. For this purpose, samples were prepared as described in section 2.5. In addition, 150 and 300 ng mL−1 of folic acid were spiked into each sample in order to check the accuracy of the method. The results of this study are given in Table 4. The results indicate that recoveries are at reasonable levels of 95.1–105.1% for trace folic acid analysis in food samples.

Table 4 The amounts of folic acid (vitamin B9) in various samples after the developed CPE procedure (N: 5)
Sample Added ng mL−1 Foundaμg kg−1 RSS% Recovery%
a The average value of five replicates ± standard deviation.
Baby food 1 445.34 ± 15.45 3.46
150.00 587.54 ± 16.50 2.80 98.7
300.00 738.10 ± 17.12 2.32 99.0
Baby food 2 332.21 ± 12.64 3.80
150.00 491.11 ± 15.50 3.16 101.9
300.00 640.40 ± 18.11 2.83 101.3
Vitamin tablet 860.48 ± 21.55 2.50
150.00 1062.34 ± 22.32 2.10 105.1
300.00 1185.86 ± 26.47 2.23 103.1
Parsley 85.77 ± 4.14 4.86
150.00 224.14 ± 8.85 3.94 95.1
300.00 379.28 ± 10.36 2.73 98.3
Wheat 765.30 ± 4.02 5.25
150.00 904.04 ± 16.45 1.82 98.7
300.00 1051.34 ± 18.22 1.73 98.6


4. Conclusions

CPE is one of the simplest and most useful preconcentration methods for trace analysis in the literature. It is extensively used in trace analysis of inorganic and organic species owing to positive properties such as simplicity, conformity to green chemistry principles, and low cost. The proposed method renders possible this analysis using a preconcentration step prior to HPLC measurements.

The developed method is very sensitive and also selective due to complex formation between Fe(III) ions and folic acid. To the best of our knowledge, there is not a published study for folic acid based on chromatographic determination following cloud point extraction, except for a study published by Heydari et al. on the determination of all water soluble vitamins based on ion-pair CPE. However, the detection limits of this method were very high (μg mL−1 levels) compared to the presented method.36 The recommended procedure could be successfully applied to preconcentration and determination of folic acid (vitamin B9) in a wide range of food samples.

Acknowledgements

This study has been supported by Cumhuriyet University Scientific Research Projects Commission as the research project with the ECZ-004 code. Authors gratefully thank Prof. Dr Şahin YILDIRIM for his useful comments and contributions to the preparation of the project text.

References

  1. A. Jedlicka and J. Klimes, Chem. Pap., 2005, 59(3), 202 CAS.
  2. I. N. Papadoyannis, G. K. Tsioni and V. F. Samanidou, J. Liq. Chromatogr. Relat. Technol., 1997, 20(19), 3203 CrossRef CAS.
  3. M. R. Shishehbore, A. Sheibani and A. Haghdost, Spectrochim. Acta, Part A, 2011, 81, 304 CrossRef CAS PubMed.
  4. E. Gujeska and A. Kuncewicz, Eur. Food Res. Technol., 2005, 22, 208 CrossRef.
  5. K. S. Woo, P. Chook, Y. I. Lolin, J. E. Sanderson, C. Metreweli and D. S. Celermajer, J. Am. Coll. Cardiol., 1999, 34, 2002 CrossRef CAS PubMed.
  6. B. B. Prasad, M. P. Tiwari, R. Madhuri and P. S. Sharma, Anal. Chim. Acta, 2010, 662, 14 CrossRef CAS PubMed.
  7. M. Mazloum-Ardakani, M. A. Sheikh-Mohseni, M. Abdollahi-Alibeik and A. Benvidi, Sens. Actuators, B, 2012, 171–172, 380 CrossRef CAS.
  8. R. Matias, P. R. S. Ribeiro, M. C. Sarraguc and J. A. Lopes, Anal. Methods, 2014, 6, 3065 RSC.
  9. S. M. Wabaidur, S. M. Alam, S. H. Lee, Z. A. Alothman and G. E. Eldesoky, Spectrochim. Acta, Part A, 2013, 105, 412 CrossRef CAS PubMed.
  10. J. L. Manzoori, A. Jouyban, M. Amjadia and J. Soleymani, Luminescence, 2011, 26, 106 CrossRef CAS PubMed.
  11. Z. Zhu, H. Wu, S. Wu, Z. Huang, Y. Zhu and L. Xi, J. Chromatogr. A, 2013, 1283, 62 CrossRef CAS PubMed.
  12. C. Ringling and M. Rychlik, Eur. Food Res. Technol., 2013, 236, 17 CrossRef CAS.
  13. Z. Szakács and B. Noszál, Electrophoresis, 2006, 27, 3399 CrossRef PubMed.
  14. S. Armenta, S. Garrigues and M. de la Guardia, TrAC, Trends Anal. Chem., 2008, 6, 497 CrossRef.
  15. M. A. Bezerra, Appl. Spectrosc. Rev., 2005, 40, 269 CrossRef CAS.
  16. R. Carabias-Martinez, E. Rodriguez-Gonzalo, B. Moreno-Cordero, J. L. Perez-Pavon, C. L. Garcia-Pinto and E. Fernandez Laespada, J. Chromatogr. A, 2000, 902, 251 CrossRef CAS PubMed.
  17. C. B. Ojeda and F. S. Rojas, Anal. Bioanal. Chem., 2009, 394, 759 CrossRef CAS PubMed.
  18. E. K. Paleologos, D. L. Giokas and M. I. Karayannis, TrAC, Trends Anal. Chem., 2009, 24(5), 426 CrossRef.
  19. H. Abdollahi and L. Bagheri, Anal. Chim. Acta, 2004, 514, 211 CrossRef CAS.
  20. H. I. Ulusoy, R. Gürkan, O. Yılmaz and M. Akçay, J. Anal. Chem., 2012, 67(2), 131 CrossRef CAS.
  21. H. I. Ulusoy, R. Gürkan, Ö. Demir and S. Ulusoy, Food Anal. Methods, 2012, 5, 454 CrossRef.
  22. R. Gürkan, U. Aksoy, H. I. Ulusoy and M. Akçay, J. Food Compos. Anal., 2013, 32, 74 CrossRef.
  23. G. P. Zhang, W. Qin and Y. Y. Dai, Sciencepap. Online, 2007, 2(12), 897 Search PubMed.
  24. W. Zhang, C. Duan and M. Wanga, Food Chem., 2011, 126, 779 CrossRef CAS.
  25. H. Parham, B. Zargar and F. Khoshnam, Food Anal. Methods, 2015, 8(9), 2235 CrossRef.
  26. L. Mirmoghtadaie, A. A. Ensafi, M. Kadivar, M. Shahedi and M. R. Ganjali, Int. J. Electrochem. Sci., 2013, 8, 3755 CAS.
  27. G. Ren, G. Huanga, J. Wu, J. Yuan, G. Yang, Z. Yan and Z. Yao, J. Chromatogr. B: Anal. Technol. Biomed. Life Sci., 2014, 953–954, 73 CrossRef CAS PubMed.
  28. Z. Szakács and B. Noszál, Electrophoresis, 2006, 27, 3399 CrossRef PubMed.
  29. J. B. Chen, W. J. Zhao, W. Liu, Z. M. Zhou and M. M. Yang, Food Chem., 2009, 115, 1038 CrossRef CAS.
  30. G. F. Jia, C. G. Lv, W. T. Zhu, J. Qiu, X. Q. Wang and Z. Q. Zhou, J. Hazard. Mater., 2008, 159, 300 CrossRef CAS PubMed.
  31. G. Ren, G. Huanga, J. Wu, J. Yuan, G. Yang, Z. Yan and Z. Yao, J. Chromatogr. B: Anal. Technol. Biomed. Life Sci., 2014, 953–954, 73 CrossRef CAS PubMed.
  32. O. Bai, J. Li, S. B. Chen and B. H. Chen, Environ. Sci. Technol., 2001, 35, 3936 CrossRef PubMed.
  33. H. I. Ulusoy, J. Radioanal. Nucl. Chem., 2014, 302, 497 CrossRef CAS.
  34. H. I. Ulusoy, Anal. Methods, 2015, 7(3), 953 RSC.
  35. A. Favre-Reguillon, D. Murat, G. Cote and M. Draye, J. Chem. Technol. Biotechnol., 2012, 87, 1497 CrossRef CAS.
  36. R. Heydari and N. S. Elyasi, J. Sep. Sci., 2014, 37, 2724 CrossRef CAS PubMed.

This journal is © The Royal Society of Chemistry 2016
Click here to see how this site uses Cookies. View our privacy policy here.