Engineering of glycyrrhizin capped gold nanoparticles for liver targeting: in vitro evaluation and in vivo biodistribution study

Shaivee Borkera, Milind Patoleb, Alpana Moghec and Varsha Pokharkar*a
aDepartment of Pharmaceutics, Poona College of Pharmacy, Bharati Vidyapeeth University, Erandwane, Pune 411038, Maharashtra, India. E-mail: vbpokharkar@yahoo.co.in
bNational Centre for Cell Science, NCCS Complex, Pune University Campus, Ganeshkhind, Pune 411007, Maharashtra, India
cRajiv Gandhi Institute of Information Technology and Biotechnology, Bharati Vidyapeeth University, Katraj, Pune 411043, Maharashtra, India

Received 27th February 2016 , Accepted 17th April 2016

First published on 19th April 2016


Abstract

The purpose of this study was to explore the one pot green synthesis of non-cytotoxic gold nanoparticles (AuNPs) using glycyrrhizin as a reducing, stabilizing and targeting agent. The formation of glycyrrhizin (GL) capped gold nanoparticles was established by the presence of a surface plasmon resonance band at 523 nm. The as synthesized gold nanoparticles had a particle size of 17 ± 2 nm, with spherical shape and zeta potential value of −32 mV. GL-AuNPs showed excellent stability at varied pH, electrolyte conditions and cell culture media. The potential of synthesized gold nanoparticles as carrier of loaded antiviral drug lamivudine for liver targeting was explored. In vitro uptake studies by hepatocytes demonstrated a significant increase in cellular localization of GL-AuNPs as compared to citrate reduced gold nanoparticles (C-AuNPs). In vivo biodistribution study in Wistar rats proved the ability of GL-AuNPs for targeting liver. These finding can be utilized for site specific delivery of drugs for treatment of diseases affecting the liver.
1. Introduction

Advancements in nanoparticulate systems such as polymeric nanoparticles, dendrimers, liposomes, carbon nanotubules and metal nanoparticles are being widely explored for delivery of pharmaceutical actives, bioimaging and biosensing. These nanoparticulate systems offer a wide array of advantages such as improved efficacy, targeted delivery and reduced toxicity over the conventional drug delivery systems.1–3 Metallic nanoparticles especially gold nanoparticles are at the forefront of development in this field. Gold nanoparticles (AuNPs) are being increasingly explored for a variety of applications in biomedical fields such as diagnosis, imaging, targeted drug delivery, biosensors, immunoassays, genomics, monitoring of biological cells and tissues by exploiting resonance scattering, or in vivo photo acoustic techniques.4 The prediction that AuNPs can act as scaffolds for conjugation with drugs along with targeting ligands has encouraged researchers. Thus gold nanoparticles have been exploited by researchers for improving delivery of biomolecules and drugs such as protein,5 plasmid,6 insulin,7 vaccine,8 dexamethasone,9 and doxorubicin.10

For synthesis of AuNPs, the use of conventional methods such as sodium borohydride or tri-sodium citrate as reducing agents suffer from a number of disadvantages such as potential biological risks of these reducing agents and instability of the AuNPs in biological media. This limits their in vivo applications.11 There is a necessity to explore the use of reducing agents that are nontoxic, cytocompatible, cost effective, control particle size, impart stability, and introduce functionality to the AuNPs surface for the conjugation of biomolecules.12 Previously, various plant extracts such as coriander,13 lemongrass14 and Emblica officinalis15 amongst others have been successfully utilized for synthesis of AuNPs. However, these extracts generate AuNPs at slow rate. It also becomes difficult to assign specific roles to the moieties in reduction and stabilization of metal nanoparticles. To identify the active reducing agent and attain rapid synthesis, purified biomolecules such as resveratrol,16 tryptophan,17 chitosan7,8 and gellan gum18 have been utilized for synthesis of AuNPs. In this regard, our intent was to investigate glycyrrhizin (GL) as a novel reducing and stabilizing agent for rapid synthesis of gold nanoparticles.

The liver consists of hepatocytes (hepatic parenchymal cells), Kupffer cells and endothelial cells. The hepatocytes are a very important site for targeting of drugs as many fatal diseases such as hepatitis, enzyme deficiency and hepatoma occur in them.19 To treat diseases such as hepatitis B more effectively, a large fraction of administered antiviral drugs should reach the hepatocytes to achieve therapeutic levels and to reduce toxicity to non-hepatic tissue. However targeting these cells is difficult as most of the particulate delivery systems are taken up through phagocytosis by the reticuloendothelial system (RES), which includes the Kupffer cells of liver and macrophages of the spleen, within minutes after injection.20 Galactosyl residues can be utilized for targeting the hepatocytes through asialoglycoproteins receptors present on their surface. But the density and activity of these receptors may vary depending on the pathological status.21 Thus they cannot be used effectively for targeting hepatocytes.

In 1991, Negishi et al. revealed the presence of specific binding sites for glycyrrhizin (GL) on cellular membrane of hepatocytes.22 In recent years, there has been an increase in utilization of GL-mediated drug delivery system. Glycyrrhizin is one of the main constituents extracted from the root of Glycyrrhiza glabra L. (licorice). Mishra et al. demonstrated that GL-modified chitosan nanoparticles were preferentially accumulated in liver.23 While Lin et al. elaborated that GL-modified chitosan nanoparticles were taken up by hepatocytes via a ligand–receptor interaction and the cellular concentration was approximately 5 folds higher in hepatocytes than in hepatic non-parenchymal cells.24

Gold nanoparticles possesses low toxicity, biocompatibility, controlled variability in size, shape and surface modification making them ideal carriers for pharmaceutical actives.4 Although AuNPs are amiable to surface modification the process entails a number of steps increasing complexity of the synthesis. In our approach we utilized GL, which could act as reducing, capping and targeting agent for synthesis of gold nanoparticles. This would make the process simple yet rugged in terms of stability and applicability.

Lamivudine (LMV) is commonly used in treatment of hepatitis B. It is an antiretroviral drug belonging to the category of non-nucleoside reverse transcriptase inhibitors which act via DNA chain termination. Lamivudine was selected as an ideal candidate for loading on AuNPs because it has low affinity for human DNA polymerases, leading to low toxicity to the host.

In this study, we exploited the use of GL for one-pot green synthesis of AuNPs and subsequent loading of LMV. The as synthesized AuNPs and LMV loaded AuNPs were characterized using UV, FTIR, TEM and XRD. The effect of variation in pH, electrolytes and storage conditions at room temperature, and 4 °C on the AuNPs was studied. In vitro cytotoxicity study on HepG2 cell line by MTT assay was carried out for GL capped as well as LMV loaded AuNPs. Cellular uptake was visualized by CSLM and quantified using graphite furnace atomic absorption spectrometry (GF-AAS). The in vivo hepatocyte targeting potential of GL-AuNPs in rats was evaluated by studying tissue distribution and comparing it with citrate reduced gold nanoparticles (C-AuNPs).

2. Materials and methods

2.1. Materials

Lamivudine sample was a gifted by Aurobindo Pharma Ltd, Hyderabad (India). Hydrochloroauric acid (HAuCl4), sodium citrate and ultra-pure trace metal free nitric acid, hydrogen peroxide were purchased from Aldrich Chemicals and Fluka Chemical Corp. respectively. Glycyrrhizin, yellow tetrazolium MTT (3-(4,5-dimethylthiazolyl-2)-2,5-diphenyltetrazolium bromide) and fluorescein isothiocyanate was obtained from Sigma Chemicals Ltd. All the samples were prepared in a Millipore Milli Q water system.

2.2. Methods

2.2.1. Synthesis of gold nanoparticles. The aqueous solution of chloroauric acid (HAuCl4, 1 × 10⁻⁴ M) was reduced by heating for 10 min with 100 ml of 0.1% GL solution at basic pH (11–12) to yield a ruby-red precipitate of AuNPs. The concentration of GL was varied (0.005, 0.01, 0.1, 0.2, 0.5 and 1%) to determine its effect on formation of gold nanoparticles. The AuNPs were purified by centrifugation (Allegra 64R, Beckman Coulter) at 22[thin space (1/6-em)]000 rpm for 0.5 h and resuspended in MilliQ water.

Spherical citrate reduced AuNPs (C-AuNPs) were synthesized using Turkevich method25 which utilized sodium citrate for reduction of gold chloride. The C-AuNPs exhibited SPR at 521 nm and had a particle size of 18 ± 1 nm.

2.2.2. Percent loading and loading ratio of lamivudine onto gold nanoparticles. A calculated amount of LMV was added to the dispersion of AuNPs (pH 7.4), resulting in a final LMV concentration of 10−4 M in solution. The mixture was then incubated for 24 h at room temperature and then centrifuged using Allegra 64R, Beckman Coulter at 20[thin space (1/6-em)]000 rpm for 0.75 h. The pellet obtained after centrifugation was separated from supernatant and redispersed prior to further characterization. Free LMV present in the supernatant was determined by measurement of its UV absorbance using UV-Visible spectrometer (V-530, Jasco). Percent loading of LMV on GL-AuNPs was estimated by following formula:
% loading = [(total amount of LMV add − amount of LMV in supernatant)/total amount of LMV added] × 100

To determine the loading ratio, a solution containing (0.1–1.2 ml) 220 μg ml−1 of LMV was added to 180 μg of AuNPs in PBS buffer (pH 7.4). The mixture was incubated for 24 h at room temperature. After which, the mixture was centrifuged at 20[thin space (1/6-em)]000 rpm. To evaluate the loading ratio of LMV, the concentration of LMV in the supernatant is determined by measuring the absorbance at 272 nm.

The loading ratio of LMV to GL-AuNPs is expressed as:

Loading ratio = (mLMVmuLMV)/mGL-AuNPs × 100%
where, muLMV, mLMV and mGL-AuNPs are the mass of unadsorbed LMV, total LMV added and GL-AuNPs, respectively.

2.2.3. Characterization of gold nanoparticle. The surface plasmon resonance (SPR) of GL-AuNPs and LMV loaded gold nanoparticles (LMV-GL-AuNPs) was monitored using Jasco V-530 dual beam UV-Visible spectrometer operating at a resolution of 2 nm. The mean particle size and surface morphology of GL-AuNPs, and LMV-GL-AuNPs was determined by high-resolution transmission electron microscopy (HRTEM) measurement. Samples for HRTEM analysis were prepared by drop casting of colloidal gold nanoparticle solutions on carbon coated copper grids and allowed to dry at room temperature. Measurements were done on a TECHNAI G2 F30 S-TWIN instrument operated at an accelerated voltage of 300 kV with a lattice resolution of 0.14 nm and point image resolution of 0.20 nm. The particle size analysis was performed using ImageJ software (USA). The surface charge of AuNPs before and after loading of LMV was determined by measurement of zeta potential using a zeta potential analyzer, Brookhaven Instruments Corporation, NY. Average zeta potential of nanoparticulate dispersion (n = 3) was determined as such without any dilution. For XRD study, a film of GL reduced AuNPs was prepared on glass substrates by simple solvent evaporation of the dispersion at room temperature.18 The diffraction measurement was carried out on a PANalytical X'pert PRO instrument operating at 40 kV and a current of 30 mA at a scan rate of 0.388 min−1. Fourier transform infrared spectroscopy (FTIR) measurements of GL, GL reduced AuNPs, LMV and LMV-GL-AuNPs were recorded in KBr pellets using Jasco FT/IR-4600 spectrometer. The scan was performed in diffuse reflectance mode at a resolution of 4 cm−1 in the range of 400–4000 cm−1.
2.2.4. Effect of pH, salt concentration and storage stability. For evaluating effect of pH on AuNPs, the pH of dispersion was varied between 2 to 10 using hydrochloric acid (0.1 M) and sodium hydroxide (1 M). After incubation for 24 h, change in the SPR of AuNPs dispersion was recorded using a UV-Visible spectrometer. Similarly, the effect of salt concentration on stability of AuNPs was studied by varying molar concentration of sodium chloride (101 to 10−6 M) and observing change in SPR. The storage stability of GL reduced AuNPs was studied at room temperature and 4 °C for a period of one month. The change in SPR of the nanoparticle dispersion was recorded using UV-Visible spectroscopy.
2.2.5. In vitro drug release study. The in vitro release study was carried out in phosphate buffer (pH 7.4) and acetate buffer (pH 4.5) at 37 °C using dialysis tubing containing free drug and LMV-GL-AuNPs. The release medium was continuously stirred at 100 rpm and sink condition was maintained by removing 2 ml aliquots at regular intervals and replacing it with fresh buffer. The amount of LMV released in media was determined by UV-Visible spectroscopy at 272 nm.
2.2.6. In vitro cytotoxicity studies.
2.2.6.1. Cell culture. Human Caucasian hepatocyte cells, HepG2 cells line (American type culture collection ATCC, USA) was procured from the Cell Repository of National Centre for Cell Science, Pune, India. The cells were cultured in a humidified atmosphere of 5% CO2 and 95% air, in Minimum Essential Medium (MEM) supplemented with 100 U ml−1 penicillin, 100 μg ml−1 gentamicin and 10% fetal bovine serum at 37 °C.
2.2.6.2. Viability assay. Cytotoxicity studies of drug, as synthesized gold nanoparticles and drug loaded gold nanoparticles were performed by using 3-(4,5-dimethylthiazol-2-yl)-2,5-diphenyl tetrazolium bromide (MTT) assay. The HepG2 cells were utilized for performing assay after they reached confluency. The cells were then seeded in 96 well plates (Becton Dickinson Labware, USA) at a cell density of 2 × 10³ in 200 μl of media. After plating the cells were allowed to adhere by incubating for 24 h prior to addition of test samples. After 24 h incubation, 200 μl of cell medium was replaced with varying concentrations of LMV, GL-AuNPs and LMV-GL-AuNPs (∼0.2–1.2 mg ml−1 of LMV). The control cells received only medium. The cells were further incubated with the samples for 48 h at 37 °C and 5% CO2 in humidified environment. The medium was then discarded and MTT (5 mg ml−1, 20 μl) was added to respective sets of cells. The plates were incubated for an additional 4 h. After incubation the medium was carefully removed and DMSO (200 μl) was added to dissolve the formazan crystals and absorbance was measured at 570 nm using SpectraMax 250 UV-Visible microplate reader (Molecular devices, Sunnyvale, CA). As the UV absorbance directly indicates the number of viable cells, percent viability was calculated directly from the absorbance values.
2.2.7. Confocal laser scanning microscopy (CLSM). CLSM was performed to visualize uptake of gold nanoparticles by HepG2 cells. To obtain FITC labelled gold nanoparticles, 1 mM (10 μl) of FITC solution was added to 10 ml of the prepared gold nanoparticles dispersion (1 × 10⁻⁴ M). The mixture was equilibrated overnight at 4 °C[thin space (1/6-em)]26 and used for further study. The HepG2 cells were seeded at low density in 24 well plates (Becton Dickinson Labware, USA) on cover slips (ERIE scientific company, USA). The cells were allowed to grow for 24 h to achieve semiconfluent cultures. Subsequently, when the cells adhered the surface of cover slips to form a monolayer, 200 μl (10 μg) of FITC-labeled NPs (including C-AuNPs, GL-AuNPs and LMV-GL-AuNPs) were added to the medium, followed by incubating for 12 h. Subsequently the excess NPs were removed, by rinsing the wells with ice-cold PBS and fixed in 4% paraformaldehyde (Sigma-Aldrich, USA) for 10 min at room temperature. After two more washes in PBS, cells were blocked in 5% BSA (ICN Biomedicals, Germany) in PBS for 30 min at room temperature. The cells were then mounted with mounting medium containing DABCO (Sigma-Aldrich, USA). Finally, the cells were imaged by using Zeiss LSM 510 confocal microscope (Germany).
2.2.8. Quantification of gold in HepG2 cells. Graphite furnace atomic absorption spectrometry (GF-AAS) is an analytical technique used for the detection of gold in a sample. Quantification of uptake of C-AuNPs, GL-AuNPs and LMV-GL-AuNPs in HepG2 cell line was performed using GF-AAS by seeding the cells in a 24 well plate (Becton Dickinson Labware, USA). After plating the cells were allowed to attach by incubating for 24 h for achieving semi confluency prior to the addition of samples. After which, the cell medium was replaced with 200 μl of solution containing either C-AuNPs, GL-AuNPs or LMV-GL-AuNPs. The cells were then incubated for 12 h at 37 °C. After incubation, cells were trypsinized and collected. The cells were washed thrice to remove nanoparticles from the surface. These cells were then digested as per the procedure described by Lasagna-Reeves et al.27 Briefly, the cells were digested using hydrogen peroxide and ultra-pure trace-metal free nitric acid at temperature between 50–60 °C and analyzed by GF-AAS using a Perkin-Elmer 5100 atomic absorption spectrophotometer.
2.2.9. In vivo tissue distribution studies. Male Wistar rats (National Toxicological Center, Pune, India) were housed under a controlled temperature and humidity environment. Animal handling and experimental protocol were approved by Institutional Animal Ethics Committee (IAEC) of Poona College of Pharmacy, Pune. The guidelines of the Committee for the Purpose of Control and Supervision on Experimental on Animals (CPCSEA) were followed. Food and water were provided ad libitum and animals were subjected to a 12 h light–dark cycle. All animals were allowed 1 week for acclimation before commencement of experimentation. The rats were randomly divided into four experimental groups: control, C-AuNPs, GL-AuNPs and LMV-GL-AuNPs group (∼250 g; n = 3).

The animals were lightly anaesthetized, prior to injection of AuNPs. A single dose of ∼0.7 mg Au per kg was slowly administered via rat tail vein. The animals were sacrificed at time interval of 0.5, 4, 8, 12, 24 h. Blood and organs such as liver, brain, spleen, kidney, lungs and heart were collected at each time points. The excised organs were washed in saline solution, dried with blotting paper and weighed. They were then homogenized and digested as per the procedure described earlier by Lasagna-Reeves et al.27 and stored at −80 °C until analysis by GF-AAS.

2.2.10. Statistical analysis. Data presented as means ± SD by performing at least three independent experiments. It was analyzed by one way ANOVA using Tukey's multiple comparison test. A p value < 0.05 was accepted as statistically significant.

3. Results and discussion

3.1. Synthesis of gold nanoparticles

Several phytoconstituents have been explored previously for preparation of gold nanoparticles. The phenolic and carboxylic groups have been reported to act as reducing and capping agents during synthesis gold nanoparticles.18 Glycyrrhizin which is a saponin contains free hydroxyl and carboxylic groups which could be exploited for synthesis of gold nanoparticles. Previous reports have shown the use of GL for liver targeting of nanoparticles.22–24 Therefore, we envisioned the use of GL for reducing, capping and targeting of gold nanoparticles thus reducing complexity of system.

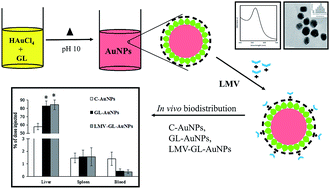
Preliminary studies were carried out to establish the optimum pH and concentration of GL solution for synthesis of AuNPs. The concentration of GL was varied between 0.005 to 1% while the pH was varied in the range of 7–10. Herein, the SPR was used as a tool for confirming formation of gold particles.28 Nanosized and stable AuNPs were obtained when the concentration of GL was 0.1% at pH 10. This was reflected by the presence of sharp SPR at 523 nm (Fig. 1A) as well as change of color from yellow to ruby red due to reduction of chloroauric acid (Au3+) into gold nanoparticles (Au0). The ruby red color of gold nanoparticles can be attributed to collective oscillation of free electrons induced by the interaction of electromagnetic field in metallic nanoparticles.29 Sharp SPR band at 523 nm indicates formation of uniformly sized nanoparticles.28 The position and intensity of SPR band obtained remained unaltered after 48 hours, indicating stability and non-agglomeration of the formed nanoparticles. This can be attributed to the capping of surface of AuNPs by GL molecules as demonstrated in Scheme 1. These AuNPs were further evaluated by TEM, XRD, FTIR and stability under varying conditions of temperature electrolyte as well as pH.


image file: c6ra05202a-f1.tif
Fig. 1 (A) UV/Vis spectra of glycyrrhizin reduced gold nanoparticles. (B) XRD patterns of as synthesized gold nanoparticles. (C) and (D) HRTEM images recorded of as synthesized glycyrrhizin reduced gold nanoparticles. Inset (D) shows particle size distribution of blank gold nanoparticles.

image file: c6ra05202a-s1.tif
Scheme 1 Schematic representation of GL reduced AUNPs and subsequent loading of LMV on its surface.

3.2. Characterization of gold nanoparticles

TEM images of GL-AuNPs (Fig. 1C) showed the presence of spherical particles with a mean size of 16 nm. All the nanoparticles were well separated, without any aggregates or clusters indicating stabilization of individual nanoparticles capped by GL. Particle size of synthesized AuNPs by photon correlation spectroscopy (PCS) was found to be 17 ± 2 nm (inset Fig. 1D). Zeta potential is an important parameter for studying the nanoparticle surface and predict the long-term stability of nanoparticles. The zeta potential value of −32.81 ± 2.65 mV depicted formation of a stable colloidal suspension with low tendency to form aggregates. Negative zeta potential value also indicated the presence of carboxylic groups of GL on the surface of gold nanoparticles.

Powder XRD diffractogram of GL-AuNPs (Fig. 1B) displayed the presence of intense diffraction peaks which proved formation of crystalline Au. The presence of intense peaks of reflected radiation (Bragg peaks) at 37.81, 44.1, 64.4 and 77.2 corresponds to the characteristic diffractions of (111), (200), (220) and (311) planes, respectively. These peaks were assigned to diffraction lines of face-centred-cubic (fcc) gold. The experimental value obtained for intensity ratio (200)/(111) peak was 0.36 which was lower than the standard value of 0.52. Similarly, for (220)/(111) peak the obtained value was 0.24 as opposed to standard value of 0.33.30 These results revealed that the (111) lattice plane was the chief crystal orientation for the as synthesized GL-AuNPs. Taking this into account, the average particle size of the as synthesized GL-AuNPs was estimated using the Debye–Scherrer equation,

D = 0.89λ/W[thin space (1/6-em)]cos[thin space (1/6-em)]θ
where in, λ is the wavelength of the X-ray source, W is the full width at half-maximum of the (111) peak in radians, θ is the diffraction angle, and D is the particle size.

The size of GL-AuNPs calculated by this equation was found to be 15.92 nm. This is in agreement with diameter of synthesized GL-AuNPs obtained using TEM and PCS techniques.

FT-IR spectra of GL (Fig. 2A) depicted typical bands at 3502, 2967, 1728, 1171 cm−1. The signal at 3502 cm−1 was assigned to asymmetric stretching vibration of hydroxy group and the band at 2952, 1727 cm−1 was indicative of a carbonyl group. From Fig. 2B it can be observed that the signal assigned to stretching vibration of hydroxyl group disappeared while that of carbonyl group reduced in intensity after synthesis of gold nanoparticles indicating their involvement in the reduction process. It thus provides credence to the hypothesis that carbonyl and hydroxyl groups are involved in reduction and capping of gold nanoparticles. These groups provided a number of crystalline “nuclei” and regulated the growth rate along a specific direction.25 Thus it can be concluded that at early stage of synthesis, the transfer of electrons from GL to Au3+ ions leads to formation of Au0.


image file: c6ra05202a-f2.tif
Fig. 2 FTIR spectra of (A) glycyrrhizin (B) glycyrrhizin reduced gold nanoparticles (C) lamivudine (D) lamivudine loaded GL-AuNPs.

Stability of gold nanoparticles over time and under varying pH and electrolytic conditions is vital for its drug delivery applications and is depicted in Fig. 3. The as synthesized GL-AuNPs did not show any discernible changes in intensity or position of absorbance at wavelength of 523 nm in the pH range of 2–10. Addition of NaCl up to 0.1 M caused no major aggregation as SPR showed only slight variation. This shows the stability of GL-AuNPs in different pH and electrolyte conditions. On the contrary, gold nanoparticles synthesized by borohydride or citrate reduction method showed aggregation at slightest change in their pH and electrolyte environments.11 This proves detrimental for their use as carrier of pharmaceutical actives. GL-reduced AuNPs remained stable over a period of one month at room temperature and at 4 °C. The GL-AuNPs did not show any noticeable variation in either UV-Visible spectra, particle size, after one month of storage.


image file: c6ra05202a-f3.tif
Fig. 3 Effect of various variables such as pH, electrolytes and storage at 4 °C, room temperature on glycyrrhizin reduced gold nanoparticles.

3.3. Drug loading capacity

After establishing formation of stable gold nanoparticles, we proceeded to determination of drug loading capability of these nanoparticles. For this study we choose LMV as a model drug candidate for loading on GL-AuNPs owing to its low toxicity. Binding of LMV to AuNPs was verified by UV spectroscopy (inset Fig. 4A) and loading efficiency was found to be 72 ± 2.4%. The loading ratio increases with the increase of in the amount of LMV and finally reaches a maximum at LMV concentration of 220 μg ml−1. A maximum loading ratio of LMV to GL-AuNPs was found to be 84.3 ± 1.8% (m/m).
image file: c6ra05202a-f4.tif
Fig. 4 (A) UV/Vis absorption spectra of lamivudine loaded glycyrrhizin reduced gold nanoparticles. (B) HRTEM images captured of lamivudine loaded GL-AuNPs. Inset (B) shows particle size distribution of lamivudine loaded GL-AuNPs.

At neutral pH zeta potential of as synthesized GL-AuNPs was negatively charged due to the presence of carboxylate moiety of GL. LMV chemically is 4-amino-1-[(2R,5S)-2-(hydroxymethyl)-1,3-oxathiolan-5-yl]-2(1H)-pyrimidinone has hydroxyl and amino groups. Thus the loading of LMV on negatively charged GL-AuNPs can be attributed formation of hydrogen as well as electrostatic bonds with free secondary hydroxyl and carboxylate groups31 present on surface of GL-AuNPs. This was supported by a change in zeta potential of LMV loaded GL-AuNPs to −25.64 ± 3.03 mV. Loading of LMV on GL-AuNPs was subsequently confirmed by FTIR spectrum of LMV-GL-AuNPs. As seen in Fig. 2C there was a shift of NH stretching band from 3327 cm−1 of pure LMV to 3026 cm−1 in case of drug loaded AuNPs (Fig. 2D). This is indicative of interaction between LMV and GL present on the surface of nanoparticles. The UV-Visible spectra of LMV loaded GL-AuNPs showed a slight shift in the absorption band from 523 nm for as synthesized AuNPs to 527 nm (Fig. 4A). LMV does not show any absorbance in this region. The deviation in plasmon absorption peak can be attributed to change in local dielectric constant around GL-AuNPs due to loading of LMV.29 The conjugation of LMV on GL-AuNPs did not cause any aggregation as verified by TEM images (Fig. 4B). The TEM pictograms clearly revealed presence of individual nanoparticles not overlapping with each other. A schematic representation of GL reduced AuNPs and subsequent loading of LMV on their surface (Scheme 1).

3.4. In vitro drug release study

The in vitro drug release behavior of LMV and LMV-GL-AuNPs was studied by monitoring the presence of free LMV in simulated physiological condition (phosphate buffer, pH 7.4) and in an acidic environment (acetate buffer, pH 4.5) by UV-Visible spectroscopy. As shown in Fig. 5, the rate and amount of LMV released from the LMV-GL-AuNPs was affected by the pH of the medium. The release of LMV from LMV-GL-AuNPs was much faster at pH 4.5 than at pH 7.4. In acetate buffer (pH 4.5) LMV-GL-AuNPs showed a release of 32% and 84% of LMV within 1 h and 24 h respectively. However, at pH 7.4 only 8% and 27% of LMV was released from LMV-GL-AuNPs after 1 h and 24 h after commencement of experiment. The preferential release of LMV from LMV-GL-AuNPs complex in acidic environment will prove beneficial as drug will be released in endosome after uptake by receptor-mediated endocytosis in target cells.32 The conjugation of LMV to GL-AuNPs provides sustained release which proves beneficial for a drug like LMV which has a low t1/2 of 2.5 h. It also offers the possibility of prolonging the retention time, increasing bioavailability and facilitating drug uptake and release within the hepatocytes.
image file: c6ra05202a-f5.tif
Fig. 5 In vitro LMV release behavior from LMV loaded GL-AuNPs in phosphate buffer (pH 7.4) and acetate buffer (pH 4.5).

3.5. In vitro cytotoxicity study

Study of cytotoxicity is a prerequisite for exploring the potential of AuNPs as drug carriers. The presence of cytotoxicity was established by MTT assay. MTT is a water soluble yellow dye which is enzymatically reduced by live cells to a purple formazan product that is insoluble in aqueous solutions.33 The cytotoxicity of different formulations namely, free LMV, as synthesized GL-AuNPs, LMV-loaded GL-AuNPs, and culture media as negative control, were evaluated by MTT assay in HepG2 cell line (Fig. 6A). The wells that received only media showed a cell viability of 100%. The GL reduced AuNPs did not show any cytotoxic effect on HepG2 cells even after 48 h of experiment. It was also observed that there was no significant difference in survival rate of cells receiving only drug solution and LMV-GL-AuNPs. Thus these results demonstrate the non-cytotoxic nature of drug loaded gold nanoparticles. The inherent biocompatibility of GL and stability of GL-AuNPs particles in the internal environment of the cells might be responsible for low cytotoxicity of as synthesized gold nanoparticles and LMV loaded gold nanoparticles. It has been previously reported that the formation of internal aggregates of endocytosed AuNPs leads to cellular toxicity.34,35 The stability of LMV-GL-AuNPs was also confirmed by incubating them in MEM containing 10% FBS, PBS and observing them for aggregation for 24 h. No significant change in particle size indicated their stability in cell culture medium (Fig. 6B). Thus GL reduced gold nanoparticles were found to be suitable carriers for the antiviral drug LMV.
image file: c6ra05202a-f6.tif
Fig. 6 (A) Viability of HepG2 cells after 48 h of exposure to (from left to right): control, blank gold nanoparticles, LMV solution, and LMV loaded AuNPs. (B) Particle size of gold nanoparticles after 24 h of incubation with different media such as MEM containing 10% FBS and PBS.

3.6. Confocal laser scanning microscopy (CLSM)

Fluorescent dye labeled gold nanoparticles can provide a rapid, simple and sensitive means to visualize the uptake of nanoparticles by in vitro by cells. Fig. 7 portrays the uptake of FITC labelled C-AuNPs, GL-AuNPs and LMV-GL-AuNPs after incubation for 12 h. It can be clearly seen that C-AuNPs were taken up to a lower extent as compared to both drug loaded as well as synthesized AuNPs. While no difference in the fluorescence intensity could be seen between the uptake of LMV loaded GL-AuNPs as well as GL-AuNPs. This was corroborated by quantifying the amount of Au present in cells.
image file: c6ra05202a-f7.tif
Fig. 7 Cellular uptake by HepG2 cells of C-AuNPs, GL-AuNPs and LMV-GL-AuNPs by confocal spectroscopy.

3.7. Quantification of uptake by cells

The effect of GL on uptake of AuNPs by HepG2 cells was quantified using GF-AAS. From Fig. 8 it can be seen that amount of gold accumulated in cells treated with blank GL-AuNPs and LMV-GL-AuNPs was considerably higher (p < 0.05) as compared to C-AuNPs. The preferential uptake of GL reduced AuNPs lead to a 2.6 fold increase in the amount of gold found in cells as opposed to C-AuNPs. This increased uptake is due to presence of specific binding sites of glycyrrhizin on cellular membrane of hepatocytes.22,36 While there was no significant difference in the amount of gold found in cells treated with LMV-GL-AuNPs when compared with GL-AuNPs.
image file: c6ra05202a-f8.tif
Fig. 8 Quantification of uptake of C-AuNPs, GL-AuNPs and LMV-GL-AuNPs by HepG2 cells using GF-AAS. *p < 0.05 vs. C-AuNPs.

3.8. In vivo tissue distribution studies in rats

The in vivo bio-distribution studies were carried out by intravenously injecting LMV-GL-AuNPs, GL-AuNPs and citrate reduced AuNPs via the tail vein in rats. At several time points after injection, blood and major organs such as liver, spleen, brain, kidney, heart and lungs were excised. The amount of Au in samples was quantified by GF-AAS. The kinetics of distribution of citrate-reduced AuNPs, LMV-GL-AuNPs, GL-AuNPs at the selected time points is depicted in Fig. 9. For C-AuNPs the highest amount of Au was found in liver followed by spleen, blood, heart, kidney and brain. Thus liver was the preferential site for accumulation of gold nanoparticles. The amount of citrate reduced AuNPs in liver increased with time. It peaked at 4 h after which it steadily declined. It reached the initial concentration of ∼58% at the end of 24 h. In spleen the level of Au decreased over a period of 24 h. In blood, the amount of C-AuNPs increased up to 8 h following intravenous administration in rats; thereafter which it declined up to 24 h. The amount of Au in other organs such as brain, kidney, heart and lungs was very low.
image file: c6ra05202a-f9.tif
Fig. 9 Distribution of gold in rat organs at various time intervals after single intravenous injection of the AuNPs expressed as % of the injected dose.

The effect of presence of GL surface coating on the biodistribution of AuNPs after intravenous administration was investigated. Although GL-AuNPs followed a similar distribution pattern as C-AuNPs, there were differences in amount of Au present in the tissues. GL reduced AuNPs were also mainly present in liver and spleen. The amount of Au in liver of rats at the end of 24 h was 81% which was 1.16 folds higher than C-AuNPs (Fig. 10). Also the amount of Au in liver was almost constant at around 80% throughout the study period of 24 h whereas in the case of C-AuNPs the amount of Au reduced over the same period of time. A lesser amount of Au was observed in blood for rats exposed to GL-AuNPs in comparison to those administered with C-AuNPs. It further reduced over a period of 24 h indicating rapid clearance of the nanoparticles from circulation. The removal of GL modified nanoparticles was due to saturable uptake of nanoparticles by the rat liver cells.37 The LMV loaded GL-AuNPs also depicted a distribution pattern similar to that of GL-AuNPs. The amount of gold for LMV loaded GL-AuNPs in various organs was similar to those obtained by administration of as synthesized GL-AuNPs. The concentration of GL-AuNPs and LMV-GL-AuNPs was significantly higher (p < 0.05) as compared to C-AuNPs. The preferential uptake of LMV loaded GL-AuNPs as well as GL-AuNPs can be attributed to carrier-mediated transport by glycyrrhizin specific receptors present on hepatocytes of rats.36


image file: c6ra05202a-f10.tif
Fig. 10 Gold concentration (expressed as % of the injected dose) in rat liver, spleen, and blood 24 h after intravenous injection of AuNPs. Results are presented as mean ± SD (n = 3). *p < 0.05 vs. C-AuNPs.

4. Conclusion

In this study we have reported green synthesis of gold nanoparticles by using glycyrrhizin which would act as targeting agent as well as provide a site for attachment of drugs. The synthesized nanoparticles were stable over a wide range of pH and electrolyte concentration. As the synthesized nanoparticles were non-cytotoxic they were used as carriers for delivery of antiviral drug lamivudine. The glycyrrhizin reduced nanoparticles displayed an enhanced uptake in vitro by HepG2 cells as compared to citrate reduced gold nanoparticles owing to the presence of glycyrrhizin specific receptors on the cells. This was further supported by in vivo studies in rats which showed higher concentration of gold in liver over a longer period of time as compared to citrate reduced gold nanoparticles. Encouraged by these results we have undertaken studies for targeting other diseases affecting the hepatocytes.

Conflict of interest

Authors report no conflict of interest.

Author contributions

The conception and design of experiment, acquisition of data, and interpretation of data was done by Shaivee Borker and Varsha Pokharkar. Initial draft was prepared by Shaivee Borker and edited by Varsha Pokharkar. Milind Patole and Alpana Moghe provided the necessary inputs and cell-culture facilities to perform experiments. All authors have approved the final version of article.

References

  1. G. Han, P. Ghosh and V. Rotello, Nanomedicine, 2007, 2(1), 113–123 CrossRef CAS PubMed .
  2. I. Brigger, C. Dubernet and P. Couvreur, Adv. Drug Delivery Rev., 2002, 54, 631–651 CrossRef CAS PubMed .
  3. R. Kumar, J. Pharm. Pharm. Sci., 2000, 3, 234–558 Search PubMed .
  4. M. S. Khan, G. D. Vishakante and H. Siddaramaiah, Adv. Colloid Interface Sci., 2013, 199–200, 44–58 CrossRef CAS PubMed .
  5. A. Gole, C. Dash, V. Ramakrishnan, S. Sainkar, A. Mandale, M. Rao and M. Sastry, Langmuir, 2001, 17, 1674–1679 CrossRef CAS .
  6. T. Kawano, M. Yamagata, H. Takahashi, Y. Niidome, S. Yamada, Y. Katayama and T. Niidome, J. Controlled Release, 2006, 111, 382–389 CrossRef CAS PubMed .
  7. H. M. Joshi, D. R. Bhumkar, K. Joshi, V. B. Pokharkar and M. Sastry, Langmuir, 2006, 22, 300–305 CrossRef CAS PubMed .
  8. G. Barhate, M. Gautam, S. Gairola, S. Jadhav and V. Pokharkar, Int. J. Pharm., 2013, 441, 636–642 CrossRef CAS PubMed .
  9. I. Venditti, L. Fontana, I. Fratoddi, C. Battocchio, C. Cametti, S. Sennato, F. Mura, F. Sciubba, M. Delfini and M. V. Russo, J. Colloid Interface Sci., 2014, 418, 52–60 CrossRef CAS PubMed .
  10. V. Venkatpurwar, A. Shiras and V. Pokharkar, Int. J. Pharm., 2011, 409, 314–320 CrossRef CAS PubMed .
  11. L. L. Rouhana, J. A. Jaber and J. B. Schlenoff, Langmuir, 2007, 23, 12799–12801 CrossRef CAS PubMed .
  12. K. Tsuchida and T. Murakami, Mini-Rev. Med. Chem., 2008, 8, 175–183 CrossRef .
  13. K. B. Narayanan and N. Sakthivel, Mater. Lett., 2008, 62, 4588–4590 CrossRef CAS .
  14. S. S. Shankar, A. Rai, A. Ahmad and M. Sastry, Chem. Mater., 2005, 17, 566–572 CrossRef CAS .
  15. B. Ankamwar, D. Chinmay, A. Absar and S. Murali, J. Nanosci. Nanotechnol., 2005, 10, 1665–1671 CrossRef .
  16. R. Mohanty, S. Thennarasu and A. Mandal, Colloids Surf., B, 2014, 114, 138–143 CrossRef CAS PubMed .
  17. M. Iosin, P. Baldeck and S. Astilean, J. Nanopart. Res., 2010, 12, 2843–2849 CrossRef CAS .
  18. S. Dhar, E. M. Reddy, A. Shiras, V. Pokharkar and B. L. V. Prasad, Chem.–Eur. J., 2008, 14, 10244–10250 CrossRef CAS PubMed .
  19. Y. Yata, S. Enosawa, S. Suzuki, X. Li, A. Tamura, H. Kimura, T. Takahara and A. Watanabe, Methods Cell Sci., 1999, 21, 19–24 CrossRef CAS PubMed .
  20. H. M. Redhead, S. S. Davis and L. Illum, J. Controlled Release, 2001, 70, 353–363 CrossRef CAS PubMed .
  21. T. Sawamura, H. Nakada, H. Hazama, Y. Shiozaki, Y. Sameshima and Y. Tashiro, Gastroenterology, 1984, 87, 1217–1221 CAS .
  22. M. Negishi, A. Irie, N. Nagata and A. Ichikawa, Biochim. Biophys. Acta, 1991, 1066, 77–82 CrossRef CAS .
  23. D. Mishra, N. Jain, V. Rajoriya and A. Jain, J. Pharm. Pharmacol., 2014, 66(8), 1082–1093 CAS .
  24. A. Lin, Y. Liu, Y. Huang, J. Sun, Z. Wu, X. Zhang and Q. Ping, Int. J. Pharm., 2008, 359, 247–253 CrossRef CAS PubMed .
  25. S. Suarasan, M. Focsan, D. Maniu and S. Astilean, Colloids Surf., B, 2013, 103, 475–481 CrossRef CAS PubMed .
  26. C. Lin, C. Liu and W. Tseng, Anal. Methods, 2010, 2, 1810–1815 RSC .
  27. C. Lasagna-Reeves, D. Gonzalez-Romero, M. A. Barria, I. Olmedo, A. Clos, V. M. Sadagopa Ramanujam, A. Urayama, L. Vergara, M. J. Kogan and C. Soto, Biochem. Biophys. Res. Commun., 2010, 393, 649–655 CrossRef CAS PubMed .
  28. K. P. Kumar, W. Paul and C. P. Sharma, Process Biochem., 2011, 46, 2007–2013 CrossRef CAS .
  29. P. Mulvaney, Langmuir, 1996, 12, 788–800 CrossRef CAS .
  30. S. J. Hwang, S. H. Jun MS, Y. Park, S. Cha, M. Yoon, S. Cho, H. Lee and Y. Park, Nanomedicine, 2015, 7, 1677–1688 Search PubMed .
  31. P. Bhatt, Y. Azim, T. S. Thakur and G. R. Desiraju, Cryst. Growth Des., 2009, 9, 951–957 CAS .
  32. P. Kumar, Y. S. Lakshmi, C. Bhaskar, K. Golla and A. K. Kondapi, PLoS One, 2015, 10, e0140399 Search PubMed .
  33. T. Mosmann, J. Immunol. Methods, 1983, 65, 55–63 CrossRef CAS PubMed .
  34. W. J. Cui, J. R. Li, Y. K. Zhang, H. L. Rong, W. S. Lu and L. Jiang, Nanomedicine, 2012, 8, 46–53 CAS .
  35. L. Jia, L. Guo, J. Zhu and Y. Ma, Mater. Sci. Eng., C, 2014, 43, 231–236 CrossRef CAS PubMed .
  36. M. G. Ismair, C. Stanca, H. R. Ha, E. L. Renner, P. J. Meier and G. A. Kullak-Ublick, Hepatol. Res., 2003, 26, 343–347 CrossRef CAS PubMed .
  37. S. Ishida, Y. Sakiya, T. Ichikawa and Z. Taira, Biol. Pharm. Bull., 1993, 16, 293–297 CAS .

This journal is © The Royal Society of Chemistry 2016