A rheological study of reverse vesicles formed by oleic acid and diethylenetriamine in cyclohexane

Ge Yang and Jianxi Zhao*
Institute of Colloid and Interface Chemistry, College of Chemistry and Chemical Engineering, Fuzhou University, Fuzhou, Fujian 350108, China. E-mail: jxzhao.colloid@fzu.edu.cn

Received 27th February 2016 , Accepted 9th May 2016

First published on 11th May 2016


Abstract

A reverse aggregate system composed of oleic acid and diethylenetriamine in cyclohexane has been studied. Small angle X-ray scattering (SAXS) measurements and polarising microscopy (POM) observations suggested the formation of reverse vesicles. FT-IR measurements showed simple attraction between DETA and OA, which increased the size of the head of the forming unit and resulted in reverse vesicle formation. Therefore, the viscosity of solutions depended on the mole ratios of DETA to OA,β, and reached a maximum of 122 Pa s at β = 1 for 1 mol L−1 OA. Dynamic oscillatory sweeps were carried out for this system of equi-mole mixed OA (1 mol L−1) and DETA. Strong elasticity was observed, where the elastic modulus (G′) always dominated over the viscous modulus (G′′) over the range of examined frequencies. The elastic plateau modulus GP was 127.4 Pa and GP was found to decrease exponentially with temperature. Strain sweeps exhibited a strain-softening response at high strains. The effect of trace amounts of water was also examined for equi-mole mixed OA (1 mol L−1) and DETA, where the reverse vesicles remained. The water was found to improve the association of DETA with OA and increase the visco-elasticity of the solution. The maximum viscosity was as high as 6005 Pa s at W0 = 6, and GP also reached 530 Pa. The solution became gelatinous in appearance.

Introduction

In 1991, Kunieda et al. first reported on the reverse vesicles formed by a non-ionic surfactant, tetraethyleneglycol dodecyl ether (C12E4), in dodecane.1 Reverse vesicles are the counterparts of normal vesicles in aqueous solution, i.e., their spherical containers consist of a hydrophobic core surrounded by a reverse bilayer of surfactant or lipid molecules. The discovery of reverse vesicles was far later than that of the normal vesicles formed in aqueous solution which was reported for the first time in 1964. This implied that reverse vesicles are often difficult to form. Here the main problem was the dissolution of surfactants because a majority of them are insoluble in non-polar solvents (oil). So far, the formation of reverse vesicles all depended on a few surfactants that were soluble in oils, or were dissolved relatively easily, for example, alkyl polyoxyethylene ethers (having a short POE chain),1–9 sucrose ethers,10 diglycerol fatty acid esters,11 etc.

When reverse vesicles are expected, a columnar-like shape of the forming unit is required according to the prediction of Israelachvili.12 In oil, the hydrophobic tail of a surfactant is highly extensional but its hydrophilic head is neither ionised nor solvated. Therefore, a modification to the head of the surfactant is often necessary using an additive to interacting therewith. Similarly, the additives also meet the difficulty of being oil-soluble.

Both oleic acid (OA) and diethylenetriamine (DETA) are liquids at room temperature, which imparts a low cohesive energy thereto: they are therefore expected to dissolve in oil under stirring and moderate heating.13 Recently, OA were found to form normal vesicles in water together with DETA, the both interacted via hydrogen bonding, which yielded a columnar-like molecular geometry.14 Herein, they were expected to form reverse vesicles in oil if dissolution could be achieved.

Results and discussion

Effect of β

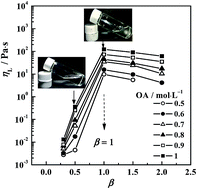
The steady-state viscosity was measured for a series of samples at different OA concentrations but with a constant mole ratio of DETA to OA,β, and at different β but a fixed surfactant concentration (see Fig. S1, ESI). At β = 0.3 and 0.5, the samples showed typical Newtonian fluid behaviour with a viscosity of 0.003 to 0.3 Pa s depending on OA concentration. The values of viscosity were only slightly higher than that of cyclohexane solvent (c. 0.001 Pa s at 20 °C), implying that OA may form small reverse aggregates.

At β ≥ 1, the viscosity curves all showed shear thinning behaviour but no low-shear Newtonian plateaus. The low-shear viscosity at 0.01 s−1, ηL, was plotted as a function of β (Fig. 1), which followed an identical trend regardless of OA concentrations. As β was increased, ηL increased rapidly and reached a maximum at β = 1 (122 Pa s at 1 mol L−1 OA), following which the viscosity decreased slightly. Typical polarising micrographs (POMs) of the three samples with a fixed concentration of 1 mol L−1 OA but different β (1, 1.5, and 2, respectively) all showed clear bright crosses (Fig. 2, top).


image file: c6ra05176f-f1.tif
Fig. 1 Plots of low-shear viscosity ηL versus β (the molar ratio of DETA to OA) at different OA concentrations in cyclohexane at 25 °C.

image file: c6ra05176f-f2.tif
Fig. 2 Micrographs of samples (OA = 1 mol L−1) at 25 °C with (top) and without (bottom) polarizers at β = 1, 1.5, and 2, from left to right.

This was a characteristic feature of lamellar phases.15 Micrographs of reverse aggregates in cyclohexane without polarizers were also showed in Fig. 2 (bottom), where separated, spherical aggregates were found. This indicated that the lamellar structure characterised by polarised textures should be dispersed, i.e., would form reverse vesicles with closed bilayers.15 The fact that no low-shear Newtonian plateaus appeared in their viscosity curves also supported this conclusion.9,16 SAXS can provide information to help the analysis of aggregate morphology. To minimise structure factor effects, SAXS was undertaken for samples with a low OA concentration (50 mmol L−1).17 Fig. 3 shows the SAXS scattering intensity (I) as a function of scattering vector (q) (q = (4π/λ)sin[thin space (1/6-em)]θ, where λ is the X-ray wavelength and 2θ is the scattering angle) for the samples at characteristic values β = 1 and 1.5, respectively. The slopes of the double logarithmic plots in the low-q region always had a value of 2 as shown by the solid lines, again indicating that the dispersed aggregates had the structure of closed bilayer.14,18,19


image file: c6ra05176f-f3.tif
Fig. 3 SAXS spectra (plots of scattering intensity I(q) versus scattering vector q) for OA (50 mmol L−1)/DETA system in cyclohexane at β = 1 and 1.5.

According to the suggestion of Kucerka et al.,20 the bilayer thickness of vesicles can be estimated: first, the Kratky–Porod (KP) plot (ln[I(q)q2] versus q2) was made by experimental data of SAXS, in which a linear fitting with a slope of −Rt2 was obtained over the range of low q values. Thus, Rt was obtained from the slope, and it was related with the thickness of vesicle bilayer, dt, by a relationship: dt2 = 12 Rt2.20 In the present case of β = 1, the dt was estimated to be 2.8 nm. This value was reasonably smaller than that (3.9 nm) of the vesicles formed by 1,2-dimyristoyphosphatidylcholine,20 a molecule far larger than OA.

Mechanism of vesicle formation

OA alone can dissolve in cyclohexane but the solution viscosity was very low, at only 0.0028 Pa s at 1 mol L−1, which indicated that small aggregates formed in the solution. This can be attributed to the small head of the OA because it did not ionise and solvate in oil and thereby OA-alone cannot form reverse vesicles.12 The addition of DETA greatly enhanced the viscosity at β ≥ 1, and evidently, the interaction of DETA with the headgroup of OA then occured.

FT-IR spectra of the samples with 5 mol L−1 OA and at β = 1 and 1.5 are shown in Fig. 4. Surprisingly, no evidence supported the hydrogen-bonding interactions between DETA and OA. In the water-free case, the N–H vibration of DETA was shown at 3285 cm−1,21 and in the mixed solutions, an identical band also appeared but no new bands were observed. This indicated that the interaction of DETA with OA may depend only on simple van der Waals attraction. Even so, the interaction certainly increased the size of the OA head and favoured the formation of aggregates with low surface curvature.


image file: c6ra05176f-f4.tif
Fig. 4 FT-IR spectra of the samples with 5 mol L−1 OA and at β = 1 and 1.5. The spectra of OA-alone and DETA-alone are shown for comparison.

Similar phenomena were observed in the cases of lecithin reverse worms, where the trace amount of water hydrogen-bonded with the phosphate groups of lecithin and bridged these groups of neighbouring lipid molecules, resulting in their association into tubular aggregates.22,23 Although there was only van der Waals attraction between DETA and OA, the effect of reducing the surface curvature of assemblies may be stronger than that of the water molecules due to the far larger size of the DETA molecule compared to a water molecule. A schematic of the mechanism is shown in Fig. 5.


image file: c6ra05176f-f5.tif
Fig. 5 Schematic of reverse vesicle formation from OA/DETA: DETA interacted with the carboxylate head of OA by van der Waals attraction, which increased the size of forming units and favoured a decrease in the surface curvature of molecular assemblies. The addition of trace amounts of water strengthened this effect.

Linear and non-linear dynamic rheology

Dynamic oscillatory sweep was measured at 25 °C. The sample at 1 mol L−1 OA and β = 1, which corresponded to the maximum steady-state viscosity as shown in Fig. 1, showed strong elastic characteristics, where the elastic modulus (G′) always dominated over the viscous modulus (G′′) over the range of examined frequencies (Fig. 6a). The elastic plateau modulus GP, i.e. the value of G′ at the high-frequency limit which can be obtained according to a modified method,24,25 was 127.4 Pa at β = 1. The insert in Fig. 6a shows a decrease of GP with β, from 127.4 Pa at β = 1 to 41.6 Pa at β = 2, showing the strongest elasticity at an equal-mole mixture of OA and DETA (β = 1). The complex viscosity (η*) of these samples linearly decreased with a slope of −1 (Fig. 6b), also suggesting the formation of vesicles.26,27
image file: c6ra05176f-f6.tif
Fig. 6 (a) Oscillatory sweep rheogram of the sample with OA = 1 mol L−1 at β = 1 at 25 °C. The insert shows the variation of elastic plateau modulus GP with β (≥1). (b) Complex viscosity (η*) of this sample decreased linearly with frequency with a slope of −1.

Fig. 6 shows the stress sweep rheogram of the sample at β = 1, from which the yield stresses (τY) can be estimated. τY decreased with increasing β (the insert in Fig. 7).


image file: c6ra05176f-f7.tif
Fig. 7 Stress sweep rheogram of the sample with OA = 1 mol L−1 at β = 1 at 25 °C. The insert shows the variation of yield stresses τY with β (≥1).

A strain sweep of the samples with OA = 1 mol L−1 and at β = 1, 1.5, and 2 was undertaken at 10 rad s−1, and it exhibited a strain-softening response at high strains (Fig. 8). These agreed with the shear-thinning behaviour seen in steady-state rheology (Fig. S1, ESI).


image file: c6ra05176f-f8.tif
Fig. 8 Strain sweep at 10 rad s−1 for the samples with OA = 1 mol L−1 but different β at 25 °C.

Effect of temperature

Tung et al. observed different temperature effects on the rheology in aqueous and non-aqueous systems of the wormlike micelles formed by lecithin.28 In an aqueous system, where normal worms were formed, the elastic plateau modulus GP remained constant with temperature, while the relaxation time τR and zero-shear viscosity η0 decreased exponentially. In a non-aqueous system, where reverse worms were formed, in addition to τR and η0, GP also decreased exponentially. The reason for this has been suggested as being due to a weakening of the hydrogen-bonding interactions between the water and the phosphate groups of lecithin which controlled the effective molecular geometry of the surfactant in non-polar solvent systems.28

Although the present system related to reverse vesicles rather than reverse worm-like micelles, and the van der Waals attraction was substituted for the hydrogen-bonding, the interactions between DETA and OA had the same temperature-sensitivity. Therefore, a temperature effect similar to that observed in the lecithin system28 may also exist in the present system. Indeed, Fig. 9 shows exponential decreases in GP with temperature for the system at 1 mol L−1 OA and β = 1. This result indicated that the temperature-dependence of GP may be common when weak interactions, such as hydrogen-bonding or van der Waals attraction, dominated the formation of aggregates, regardless of whether these were worm-like micelles or vesicles.


image file: c6ra05176f-f9.tif
Fig. 9 Plots of elastic plateau modulus GP and yield stress τY for the sample at 1 mol L−1 OA and β = 1 as a function of temperature.

The negative effect of temperature was also reflected in the yield stress τY, where τY linearly decreased with increasing temperature for this system (Fig. 9).

Effect of water addition

In the DETA–free (OA only) system, the addition of a trace amount of water did not increase the viscosity of the solution significantly. Upon addition of slightly more water, the system became unstable and phase separation occurred. Thus, the effect of a trace amount of water was examined in the presence of DETA.

Upon adding a trace amount of water, the interaction of water with the carboxylate headgroups of OA, and also with the amine group in the DETA, was expected. FT-IR measurements provided the evidence to support this point of view (Fig. 10). At a molar ratio of water to OA, W0, of 1, the band close to 3285 cm−1 can be seen, which was identical to that in water-free cases and was assigned to the N–H vibration of DETA.21 This characteristic band broadened significantly at W0 = 2, it shifted to 3368 cm−1, and was also more broad at W0 = 6. It is known that free hydroxyl radicals corresponded to a broad band at 3650 to 3580 cm−1 and shifted to low stretching frequencies when it was in an associated state, for example, forming hydrogen-bonds.29 Therefore, the broad band around 3368 cm−1 can be assigned to hydrogen-bonding between the water and the OA, and also the water and the DETA since the band of DETA at 3285 cm−1 disappeared at high W0.


image file: c6ra05176f-f10.tif
Fig. 10 FT-IR spectra of the samples with 1 mol L−1 OA in the presence of 1 mol L−1 DETA (β = 1) at W0 = 1, 2, and 6. The concentration of surfactant was only a fifth of that in Fig. 3 (5 mol L−1 OA) since water was difficult to add, and thereby the band at 3285 cm−1 was not as sharp as in Fig. 3.

That the solution readily became slightly cloudy when a trace amount water was added (Fig. S5, ESI) was noteworthy. This may be due to the evolution of DETA from the aggregates because free DETA was insoluble in cyclohexane. This was also supported by the weak association of DETA with OA as concluded in Section 3.2.

Polarising micrographs of the three samples (1 mol L−1 OA/1 mol L−1 DETA) at W0 = 1, 6, and 10 all showed clear bright crosses (Fig. S6, ESI), indicating that reverse vesicles were still formed, i.e., the addition of a trace amount of water did not change the morphology of the aggregates.

With the addition of water, the solution became more viscous. The maximum value of ηL reached 6005 Pa s at W0 = 6 (Fig. 11a). This value was almost 50 times larger than that in the water-free system (122 Pa s, Fig. 1). The sample at W0 = 6 became gelatinous and did not flow in the overturned vial (insert, Fig. 11a). The oscillatory sweep rheogram for the sample at W0 = 6 also showed typical characteristics of a surfactant gel, where both elastic modulus (G′) and viscous modulus G′′ were independent of frequency (Fig. 11b).16 The elastic plateau modulus GP was 530 Pa at W0 = 6. This value was four times higher than that in the water-free system (127.4 Pa), showing considerably stronger elasticity.


image file: c6ra05176f-f11.tif
Fig. 11 (a) Plots of low-shear viscosity ηL versus W0 at 25 °C for 1 mol L−1 OA/1 mol L−1 DETA (β = 1), (b) oscillatory sweep rheogram for this system at W0 = 6.

The participation of water may improve the association of DETA with the carboxylate groups. A similar role, for added water, has been revealed in lecithin systems, where the water molecules bridged phosphate groups of neighbouring lipid molecules and induced micellar growth.22,23 Therefore, although the addition of water alone induced phase separation in the OA, the cooperation between the water and the DETA favoured OA the better to form reverse vesicles. This result suggested an approach to form reverse vesicles from popular surfactants: a trace amount of water may help a hydrogen-bond-based additive to form aggregates, where the water molecules can bridge the head of the surfactant, and the additive, via hydrogen bonds and effectively reduce the surface curvature of subsequent assemblies.

Experimental

Materials

Oleic acid (OA, AR) was purchased from Alfa Aesar Co. (China). Diethylenetriamine (DETA, 99%) was purchased from Aladdin (Scheme 1). Cyclohexane was sourced from Sinopharm Chemical Reagent Co. (China). All chemicals were used without further purification. The water used was of Milli-Q grade with a resistivity of 18.2 MΩ cm−1.
image file: c6ra05176f-s1.tif
Scheme 1 Chemical structures of OA and DETA.

Sample preparation

OA was dissolved in cyclohexane and then DETA was added under stirring. The samples, with the desired concentrations of OA and DETA, were kept at 25 °C for at least 12 hours to achieve equilibration. If water was required, it was injected into the solution of OA/DETA under stirring.

Methods

Rheology measurements were performed on an HAAKE RheoStress 6000 stress-controlled rheometer with a cone-plate sensor. The cone is made of a standard ETC steel with a diameter of 60 mm and cone apex angle of 1°. The gap between the centre of the cone and the plate is 50 μm. Each sample was kept for 5 min on the plate to allow the sample to reach equilibrium before testing. Dynamic frequency-sweep measurements were performed in the linear visco-elastic region of the samples, as determined previously by dynamic stress sweep measurements.

SAXS measurements were performed at 25 °C using a NanoStar (Bruker) SAXS equipped with a 2-d detector. The incident X-rays of CuKα radiation (1.54 Å) were monochromated by a cross-coupled Göbel mirror and passed through the sample placed in a 2 mm quartz capillary. The distance between the sample and the detector was 1070 mm, allowing the value of the scattering vector q to range from 0.07 to 2.3 nm−1. The data shown were for the normalised intensity I (arbitrary units) versus q = (4π/λ)sin(θ), where λ is the wavelength of the X-rays and 2θ is the scattering angle.

Polarising-microscopy observations were carried out on a polarising optical microscope (Olympus BX51TF) equipped with a digital camera (DP12). Samples were prepared by dropping several drops of solutions onto a thin glass slice, which was then covered by another glass slice.

Fourier transform infrared (FT-IR) measurements were performed on a Nicolet iS50 spectrometer (Thermo Fisher Scientific Co., USA) equipped with an ATR detector. The samples were dropped onto a slide made of diamond to obtain the infrared spectra over the scanning range of 4000 to 400 cm−1.

Conclusions

A reverse vesicle system composed of oleic acid and diethylenetriamine in cyclohexane was studied, from which the following conclusions were drawn:

(1) Some surfactants and additives are easily dissolved in oil. If an interaction between the head of the surfactant and the additive exists, then reverse assemblies with a low surface curvature can be expected to form, due to the increased head volume of the surfactant. This may be a common approach used to form reverse vesicles, or reverse worms, from popular surfactants.

(2) A trace amount of water may help a hydrogen-bond-based additive to form aggregates, where the water molecules can bridge the head of the surfactant, and the additive, via hydrogen bonds and reduce the surface curvature of subsequent assemblies.

(3) The temperature-dependence of GP may be common when weak interactions, such as hydrogen-bonding or van der Waals attraction, dominated the formation of aggregates, regardless of whether these were worm-like micelles or vesicles.

Acknowledgements

Support from The National Natural Science Foundation of China (Grant no. 21473032 and 21273040) is gratefully acknowledged.

Notes and references

  1. H. Kunieda, K. Nakamura and D. F. Evans, J. Am. Chem. Soc., 1991, 113, 1051–1052 CrossRef CAS.
  2. H. Kunieda, K. Nakamura, H. T. Davis and D. F. Evans, Langmuir, 1991, 7, 1915–1919 CrossRef CAS.
  3. H. Kunieda and M. Yamagata, J. Colloid Interface Sci., 1992, 150, 277–280 CrossRef CAS.
  4. H. Kunieda, K. Nakamura, U. Olsson and B. Lindman, J. Phys. Chem., 1993, 97, 9525–9531 CrossRef CAS.
  5. H. Kunieda, N. Kanei, A. Uemoto and I. Tobita, Langmuir, 1994, 10, 4006–4011 CrossRef CAS.
  6. K. Nakamura, A. Uemoto, T. Imae, C. Solans and H. Kunieda, J. Colloid Interface Sci., 1995, 170, 367–373 CrossRef CAS.
  7. U. Olsson, K. Nakamura and H. Kunieda, Langmuir, 1996, 12, 3045–3054 CrossRef CAS.
  8. H. Kunieda, K. Shigeta and M. Suzuki, Langmuir, 1999, 15, 3118–3122 CrossRef CAS.
  9. D. Wang, G. Wei, R. Dong and J. Hao, Chem.–Eur. J., 2013, 19, 8253–8260 CrossRef CAS PubMed.
  10. H. Mollee, J. de Vrind and T. de Vringer, J. Pharm. Sci., 2000, 89, 930–939 CrossRef CAS PubMed.
  11. L. K. Shrestha, M. Kaneko, T. Sato, D. P. Acharya, T. Iwanaga and H. Kunieda, Langmuir, 2006, 22, 1449–1454 CrossRef CAS PubMed.
  12. J. N. Israelachvili, D. J. Mitchell and B. W. Ninham, J. Chem. Soc., Faraday Trans. 1, 1976, 72, 1525–1568 Search PubMed.
  13. M. Imai, K. Hashizaki, H. Taguchi, Y. Saito and S. Motohashi, J. Colloid Interface Sci., 2013, 403, 77–83 CrossRef CAS PubMed.
  14. C. Zhou, X. Cheng, O. Zhao, S. Liu, C. Liu, J. Wang and J. Huang, Soft Matter, 2014, 10, 8023–8030 RSC.
  15. H. Li, J. Hao and Z. Wu, J. Phys. Chem. B, 2008, 112, 3705–3710 CrossRef CAS PubMed.
  16. R. Dong, Z. Zhong and J. Hao, Soft Matter, 2012, 8, 7812–7821 RSC.
  17. S.-H. Tung and S. R. Raghavan, Langmuir, 2008, 24, 8405–8408 CrossRef CAS PubMed.
  18. S.-H. Tung, H. Y. Lee and S. R. Raghavan, J. Am. Chem. Soc., 2008, 130, 8813–8817 CrossRef CAS PubMed.
  19. H. Y. Lee, K. Hashizaki, K. Diehn and S. R. Raghavan, Soft Matter, 2013, 9, 200–207 RSC.
  20. N. Kucerka, M. A. Kiselev and P. Balgavy, Eur. Biophys. J., 2004, 33, 328–334 CrossRef CAS PubMed.
  21. C. Liu, R. Bai and L. Hong, J. Colloid Interface Sci., 2006, 303, 99–108 CrossRef CAS PubMed.
  22. R. Scartazzini and P. L. Luisi, J. Phys. Chem., 1988, 92, 829–833 CrossRef CAS.
  23. Y. A. Shchipunov and E. V. Shumilina, Mater. Sci. Eng., C, 1995, 3, 43–50 CrossRef.
  24. S. Wu, J. Polym. Sci., Polym. Phys. Ed., 1987, 25, 2511–2529 CrossRef CAS.
  25. S. Wu, J. Polym. Sci., Polym. Phys. Ed., 1989, 27, 723–741 CrossRef CAS.
  26. P. Long and J. Hao, Soft Matter, 2010, 6, 4350–4356 RSC.
  27. J. Hao, H. Hoffmann and K. Horbaschek, J. Phys. Chem. B, 2000, 104, 10144–10153 CrossRef CAS.
  28. S.-H. Tung, Y.-E. Huang and S. R. Raghavan, Langmuir, 2007, 23, 372–376 CrossRef CAS PubMed.
  29. R. L. Brinkley and R. B. Gupta, Ind. Eng. Chem. Res., 1998, 37, 4823–4827 CrossRef CAS.

Footnote

Electronic supplementary information (ESI) available. See DOI: 10.1039/c6ra05176f

This journal is © The Royal Society of Chemistry 2016
Click here to see how this site uses Cookies. View our privacy policy here.