Mg2Sn: a potential mid-temperature thermoelectric material

Yu Rong Jin, Zhen Zhen Feng, Ling Yun Ye, Yu Li Yan* and Yuan Xu Wang*
Institute for Computational Materials Science, School of Physics and Electronics, Henan University, Kaifeng 475004, People's Republic of China. E-mail: ylyan@henu.edu.cn; wangyx@henu.edu.cn

Received 25th February 2016 , Accepted 9th May 2016

First published on 9th May 2016


Abstract

The electronic structure and the thermoelectric properties of Mg2X (X = Si, Ge, and Sn) were studied using the density functional theory and the semi-classical Boltzmann transport theory. The three compounds of Mg2X (X = Si, Ge, and Sn) were found to be indirect band-gap semiconductors with gap magnitudes of 0.66, 0.63, and 0.29 eV, respectively. By studying the carrier concentration dependence of the transport properties, we find that the p-type Mg2X exhibit superior thermoelectric performance originating from a large density-of-states effective mass due to the large valley degeneracy of valence bands. In particular, a maximum ZT value of 1.1 for p-type Mg2Sn can be achieved at 800 K with a carrier concentration of 9.8 × 1019 cm−3, which is higher than that of Mg2Si (0.8) and Mg2Ge (1.0). The high ZT of Mg2Sn is mainly attributed to its low lattice thermal conductivity that is a consequence of the low velocity of the optical modes caused by the large mass density. These findings suggest that Mg2Sn is a promising mid-temperature thermoelectric material.

I. Introduction

Thermoelectric (TE) materials are attracting much attention because of their promising application in power generation from a large number of low-density and dispersed energy sources, such as waste heat in power plants, automobile exhaust heat, and so on. The efficiency of TE materials is governed by the thermoelectric figure of merit:
 
ZT = S2σT/κ (1)
where S is the Seebeck coefficient, σ is the electrical conductivity (S2σ also known as the thermopower), T is the absolute temperature, and κ = κe + κl (kl is the lattice thermal conductivity, and ke is the electrical thermal conductivity) is the thermal conductivity. To compete with other commercial technologies currently used in power generation and refrigeration in terms of the efficiency of energy conversion, an improvement of a factor of 2–3 is required in the performance of TE materials. Recently, many of the state-of-the-art thermoelectric materials have broken the ZT = 2 barrier. For example, Bi2Te3/Sb2Te3 (ref. 1) superlattices thin film, silicon nanowires,2 and AgPbmSbTem+2 (ref. 3 and 4) bulk alloys have exhibited high ZT values of ∼2.4. However, an ideal TE material should not only have a high ZT, but also be comprised of nontoxic and abundantly available elements.

Mg2X (X = Si, Ge, and Sn) have emerged as a new class of thermoelectrics which are composed of low-price, environment-friendly and abundantly available elements. For the past five years, various doping strategies have been successfully used in Mg2Si and based-Mg2Si materials, which exhibit a high ZT at the middle temperature range. For example, T. Dasgupta, et al.5 reported that Mg2Si0.9Sb0.1 shows a ZT value of 0.55 at 750 K, and the Sb-doped sample Mg2SiSb0.02 has a ZT value of 0.56 at 862 K. Akasaka et al.6 found a ZT value of 0.65 at 840 K for Mg2Si[thin space (1/6-em)]:[thin space (1/6-em)]Bi0.01. Bux et al.7 obtained a ZT value of 0.7 at 775 K for Mg2SiBi0.0015. You et al.8 fabricated a Mg2Si[thin space (1/6-em)]:[thin space (1/6-em)]Bi0.02 sample with a ZT value of 0.7 at 823 K. Tani and Kido9 prepared a Mg2SiBi0.02 sample that exhibited a ZT value of 0.86 at 862 K. Alternatively, a series of Si–Sn alloy systems with proper doping showed a high ZT. For example, Tani and Kido10 found that the Al-doped Mg2Si0.9Sn0.1 shows a ZT value of 0.68 at 864 K. Isoda et al.11 reported a ZT value of 0.94 at 850 K for the Bi/Sb-doped Mg2Si0.75Sn0.25. Gao et al.12 obtained ZT values larger than 0.9 at 780 K for Sb-doped Mg2Si0.5Sn0.5. Liu et al.13 fabricated n-type Mg2Si1−xSnx solid solutions with ZT values reaching up to 1.3 at 700 K. The above survey indicates that the measured ZT value of Mg2Si-based materials varies in the range of 0.1–1.3 and depends on the conditions of synthesis and the doping levels.

Comprehensively, the bulk of these works were focused on Mg2Si and the solid solution Mg2(Si, Sn), which aroused our interest in the study of the transport properties of Mg2X (X = Si, Ge, and Sn) based on first-principle calculations and semi-classical Boltzmann transport theory. Interestingly, we find that Mg2Sn exhibits the highest ZT value of 1.1 at 800 K due to the lowest lattice thermal conductivity, which suggests that it is a promising thermoelectric material.

II. Computational detail

The lattice structures of Mg2X (X = Si, Ge, and Sn) were optimized by the Vienna Ab-initio Simulation Package (VASP)14 based on the Projector augmented wave (PAW) method.15 We used the generalized-gradient approximation (GGA), as parameterized by Perdew, Burke, and Emzerhof to describe the exchange–correlation function.16 The plane-wave cutoff energy is set at 450 eV, and the energy convergence criterion was chosen to be 10−6 eV. During the geometry optimizations, both the atomic positions and the lattice constants were fully relaxed until the magnitude of the force acting on all atoms becomes less than 0.02 eV Å−1, and the Brillouin zones of the unit cells were represented by the Monkhorst–Pack special k-point scheme using 9 × 9 × 9 grid meshes. Based on the optimized lattice structures, we calculated the minimum lattice thermal conductivity by evaluating their mechanical moduli and elastic constants. The elastic constants were studied using the strain–stress method. We calculated three independent elastic constants, i.e., C11, C12, and C44 in the Voigt notation for Mg2X compounds. With the obtained elastic constants Cij, the bulk modulus B and shear modulus G were estimated using the Voigt–Reuss–Hill (VRH) approximation.

The electronic structures of Mg2X (X = Si, Ge, and Sn) were calculated by the full potential-linearized augmented plane wave (FP-LAPW) methods17 based on the density functional theory (DFT),18,19 as implemented in the WIEN2k.20–22 We used well-converged basis sets with RMT × Kmax = 7 (RMT and Kmax are the smallest muffin-tin radius and the maximum size of reciprocal-lattice vectors, respectively). The LAPW sphere radii for Mg and X ions were 2.5 a.u. and the number of k points of the self-consistent calculations was 1500 in the Brillouin zone. Importantly, we using the modified Becke–Johnson potential of Tran and Blaha (TB-mBJ)23,24 to obtain a more accurate value of the band gap. The thermoelectric transport properties were calculated from the electronic structure using semi-classical Boltzmann theory, which is implemented in the BoltzTrap code.25 The constant scattering time approximation was used. This approximation is based on the assumption that the scattering time determining the electrical conductivity does not strongly vary with energy on the scale of kBT.

III. Results and discussion

A. Lattice structure

Mg2X (X = Si, Ge, and Sn) has the face-centered-cubic antifluorite structure (space group Fm[3 with combining macron]m) shown in Fig. 1(a). In this structure, the magnesium atom replaces the fluorine atom, and the X atom replaces the calcium atom. A unit cell contains 12 atoms with eight equivalent magnesium atoms located at the 8c: (0.25, 0.25, 0.25) sites and four equivalent X atoms located at the 4a: (0, 0, 0) sites.26 Each X atom is surrounded by eight magnesium atoms in a regular cube. The structure exhibits high symmetry and large isotropy, which means that they may be similar in transport properties along the three principal axes of the crystal. For Mg2Si, Mg2Ge, and Mg2Sn, the equilibrium lattice constants were determined as 6.35 Å, 6.42 Å, and 6.82 Å, respectively. The optimized lattice constants are in good accord with the reported experimentally measured values.27,28
image file: c6ra04986a-f1.tif
Fig. 1 (a) The optimized crystal structure of Mg2X (X = Si, Ge, and Sn) with space group Fm[3 with combining macron]m; (b) the calculated electron localization function of Mg2X (X = Si, Ge, and Sn) with the isosurface value of 0.78.

B. Electronic structure

To clearly demonstrate the electron counting, we calculated the electron localization function (ELF)29 shown in Fig. 1(b). A certain degree of charge accumulation occurs around X atoms, suggesting the occurrence of charge transfer from Mg to X, consistent with the fact that X has a higher electronegativity than that of Mg. The relationship between the electronic structure and the thermoelectric figure of merit ZT can be defined by Hicks and Dresselhaus.30 ZT increases with an inherent parameter β in anisotropic three-dimensional single-band circumstances when the thermal and electrical currents travel in a certain direction. The inherent parameter β and the maximum attainable figure of merit (Zmax) are defined by:
 
image file: c6ra04986a-t1.tif(2)
 
image file: c6ra04986a-t2.tif(3)
where kB is the Boltzmann constant, m*i (i = x, y, z) is the effective mass of the carriers (holes or electrons) in the ith direction, ħ is the Planck constant divided by 2π, μ is the carrier mobility along the transport direction, e is the charge of one electron, γ is the degeneracy of band extrema, τz is the relaxation time of the carriers moving along the transport (z) direction, and r is the scattering parameter.

Eqn (2) and (3) suggest that a high ZT originates from the following factors: a large effective mass, a high carrier mobility, a low lattice thermal conductivity, and high degeneracy of the band extrema. Electronic structure calculations can directly provide important information regarding these properties. Hence, we calculated the band structure and the density of states (DOS) of Mg2X (X = Si, Ge, and Sn). Because the transport properties are closely related to the electronic states near the valence band maximum (VBM) and conduction band minimum (CBM), we mainly focus on the electronic states near the Fermi level.

Fig. 2 shows the calculated band structure of Mg2X (X = Si, Ge, and Sn), which was calculated using the recently developed TB-mBJ functional. This functional provides more accurate band-gap values of 0.66 eV, 0.63 eV, and 0.29 eV for Mg2Si, Mg2Ge, Mg2Sn, respectively. The experiments characterize Mg2Si, Mg2Ge, and Mg2Sn as indirect band-gap semiconductors with gap magnitudes of 0.7 eV, 0.6 eV, and 0.3 eV, respectively, which confirm the reliability of our theoretical methods.31


image file: c6ra04986a-f2.tif
Fig. 2 Calculated band structure of (a) Mg2Si, (b) Mg2Ge, and (c) Mg2Sn with the fat bands representing Mg. The Fermi level is at 0 eV.

Fig. 2 also shows that the overall features of the valence bands of Mg2X (X = Si, Ge, and Sn) are similar. Their valence-band maximum are all comprised of a double degenerate band at Γ point along the ΓX direction. Away from Γ, they split into a light band and a heavy band. The light band takes a nearly linear dispersion starting rather close to Γ, whereas the heavy band is approximately parabolic near Γ, while it becomes more weakly dispersive as moves away from the Γ point. Thus the valence bands of importance for p-type doping show a combination of heavy and light bands, which is favorable for thermoelectric performance. It is well known that the light band is beneficial for large electrical conductivity and that the heavy band can result in high Seebeck coefficients. As a result, the p-type thermopower should be higher than that of n-type at the same carrier concentration.

However, the states comprising the bottom of the conduction band are different in each of these isoelectronic compounds. In Mg2Si, the lowest conduction band is a hybridized Si-3s–Mg-3p band (at the X point), followed by Mg, and the band gap between the first and the second conduction bands is 0.19 eV. This value is smaller than the 0.34 and 0.37 eV band-gap values between the first and the second conduction bands of Mg2Ge and Mg2Sn, respectively. Moreover, the unoccupied Si-3s and Mg-3p states are almost degenerate in Mg2Si. These observations can be explained by the electronegativity difference between Mg and X (Si, Ge, and Sn). Comparised to Mg2Si and Mg2Ge, the two lowest conduction bands of Mg2Sn at the X points are reversed in energy because the unoccupied Mg bands are lower in energy than the Sn bands, as previously mentioned by J. J. Pulikkotil and co-workers32 and subsequently emphasized by Liu and co-workers.13 This phenomenon is very important for band engineering, as one can adjust the band gap between the first and the second conduction bands at CBM by alloying or doping. For some composition x, Mg2SixSn1−x and Mg2GexSn1−x solid solutions or doping samples may display a convergence in energy of the two conduction bands. Thus, the band convergence stimulated by doping or alloying is a new promising approach for optimizing the properties of thermoelectric materials. Recently, such an approach has been verified by the experimental research on the solid solution of Mg2(Si, Sn).10–12,33

The total density of states for Mg2Si, Mg2Ge, and Mg2Sn are shown in Fig. 3(a), (d) and (h), respectively. The general characteristics of each of the three figures are very similar. For example, the contributions of Mg-total and X-total contribute to the valence bands are approximately equal, and the Mg-total state is dominant in the conduction band. It is important to emphasize that the slope of the total DOS at CBM is smaller than that of VBM, indicating that the m*DOS of p-type Mg2X is larger than that of n-type, which is consistent with the characteristics of the valence band of a combination of heavy and light bands. It is well known that the m*DOS is proportional to the Seebeck coefficient (S). Thus, the value of S for p-type Mg2X should be larger than that of n-type. To obtain more detailed information about the bottom of the conduction band and the top of the valence band, we calculated the partial density of states shown in Fig. 3(b), (e) and (i). From these figures, we can see that the valence band is mainly formed from X-p states, whereas the conduction band is mainly formed from Mg-3s states, indicating the occurrence of charge transfer from Mg to X, consistent with the result of ELF. Fig. 3(c), (f) and (g) show that the lowest states of Mg2Si (Ge) at CBM have stronger Si (Ge)-s character, while the lowest states of Mg2Sn at CBM have stronger Mg-3s character, suggesting that the two lowest energy bands between Mg2Si (Ge) and Mg2Sn at CBM is reversed, in agreement with the analysis of the band structure.


image file: c6ra04986a-f3.tif
Fig. 3 Calculated total DOS of Mg2X (a), Mg (d), and X (h); the projected DOS of Mg2X (X = Si (b), Ge (e), and Sn (i)), and the inset show the projected DOS of Mg2X (X = Si (c), Ge (f), and Sn (g)) near the bottom of the conduction band. The Fermi level is at 0 eV.

C. Electrical transport properties

The calculated results show that the absolute value and variation trend for the transport coefficient along the three main directions are almost identical. Thus, in this paper, we only study the thermoelectric properties along the x direction. For metals or degenerate semiconductors (parabolic band, energy-independent scattering approximation), the Seebeck coefficient is defined by eqn (4):34
 
image file: c6ra04986a-t3.tif(4)
where n is the carrier concentration. Eqn (4) indicates that S is proportional to the temperature and the density-of-states effective mass, and is inversely proportional to the carrier concentration. Generally, good thermoelectric performance occurs at heavily-doped semiconductors with carrier concentrations on the order of 1019 to 1021 carriers per cm−3. Thus, we mainly studied the transport properties between this carrier concentration range. Fig. 4(a), (d) and (g) show the calculated Seebeck coefficient as a function of carrier concentration at 500, 600, 700, and 800 K. We find that the S for p-type Mg2X is larger than that of n-type, in agreement with the larger valence-band effective mass m*DOS. For Mg2Si (Ge), the absolute value of the Seebeck coefficient increases with increasing temperature and decreases with increasing carrier concentration according eqn (4).

image file: c6ra04986a-f4.tif
Fig. 4 Transport coefficients of Mg2Si (a, b, and c), Mg2Ge (d, e, and f), and Mg2Sn (g, h, and i) as a function of carrier concentration from 1019 to 1021 cm−3 at 500 K, 600 K, 700 K, and 800 K.

As shown in Fig. 4(g), the absolute value of the Seebeck coefficient for Mg2Sn increases initially, reaches a maximum, and then decreases with the increasing carrier concentration. At closer observation, we discovered that the absolute value of S for Mg2Sn increases with increasing temperature at relatively higher carrier concentration, which is due to the value of S being proportional to the temperature, as shown in eqn (4). However, the absolute value of S for Mg2Sn decreases with increasing temperature at relatively lower carrier concentration, suggesting that there is a clear bipolar effect for both p-type and n-type. As is known, the bipolar effect is a consequence of a small band gap that gives rise to two types of carriers participating in carrier transport. The combined Seebeck coefficient is given by:35

 
image file: c6ra04986a-t4.tif(5)
where σh (σe) is the electrical conductivity of holes (electrons), and Se (Sh) is the Seebeck coefficient of electrons (holes) and is given by:
 
image file: c6ra04986a-t5.tif(6)
 
image file: c6ra04986a-t6.tif(7)
where Nv (Nc) is the effective density of states in the valence band (conduction band), np is the number of holes, and nn is the number of electrons. The bipolar effect is unfavorable for thermoelectric performance. Hence, to achieve a large Seebeck coefficient, it is worth seeking for ways to reduce the bipolar effect.

Based on the calculated band structures, it is possible to calculate σ/τ as a function of n and T; however, it is not possible to calculate σ without knowledge of the scattering time τ. To obtain the electrical conductivity, we adopt the method of Khuong P. Ong and coworker's to eliminate the relaxation time τ.36 We use the experimental data of Mg2Si obtained from Masayasu Akasaka and coworkers.37 They reported a Seebeck coefficient of 370 V K−1 at 650 K. By comparing with the calculated S(T, n) from Fig. 4(a), we obtain the carrier concentration n = 3.1 × 1019 cm−3 for this sample. The reported experimental electrical conductivity is 8 × 10³ (S m−1), which combined with the calculated σ/τ yields τ = 2 × 10⁻¹⁵ s for this particular sample at 650 K. In this regime, the experimental data from this sample and others follow an approximate electron-phonon T dependence τn−1/3. This yields τ = 1.2 × 10⁻⁵T−1n−1/3. In the same manner, we calculate τ = 1.17 × 10⁻⁵T−1n−1/3 for Mg2Ge from the experimental data.38 Note that the thermoelectric properties of Mg2Sn have not been investigated in experiments previously and that the atomic number of Sn close to Ge. We adopt the same scattering time τ for Mg2Sn with that of Mg2Ge. Thus, the electrical conductivity of Mg2X (X = Si, Ge, and Sn) is calculated as σ/τ × τ.

Fig. 4(b), (e) and (h) show the calculated electrical conductivity σ as a function of carrier concentration at the temperatures of 500, 600, 700, and 800 K. We can see that the electrical conductivity decreases with increasing temperature because of the increased phonon scattering with the increasing temperature. σ increases with the increasing of the carrier concentration, consistent with the relationship: σ = neη (η is the carrier mobility). Interestingly, the value of σ of Mg2Sn is higher than that of Mg2Si (Ge), which is possibly caused by its smaller band gap image file: c6ra04986a-t13.tif39

Fig. 4(c), (f) and (i) show the calculated power factor S2σ as a function of carrier concentration from 1019 to 1021 cm−3 at 500, 600, 700, and 800 K. As mentioned above, the power factor increases with increasing carrier concentration and is mainly governed by the electrical conductivity at low carrier concentrations, whereas the power factor decreases with increasing carrier concentration and is mainly dominated by the Seebeck coefficient at high carrier concentrations. Moreover, because the valence-band maximum is comprised of a doubly degenerate band (the light band and heavy band) at the Γ point along the ΓX direction, the total electronic conductivity (σtotal) and the Seebeck coefficient (Stotal)13 are written as:

 
σtotal = σh1 + σh2, (8)
 
image file: c6ra04986a-t7.tif(9)
where σh1 and σh2 are the respective electrical conductivity contributions from each conduction band, and Sh1 and Sh2 are the corresponding Seebeck coefficients. The light band results in a large electrical conductivity, and the heavy band results in high Seebeck coefficients. Consequently, the power factor of p-type material is higher than that of n-type material at the same carrier concentration.

D. Thermal conductivity

A valid theoretical approach to compute the thermal conductivity in thermoelectrics is of tremendous importance in material optimization for efficient thermoelectric refrigeration and power generation. As mentioned above, thermal conductivity in materials comes from two sources: (1) phonons travelling by the vibrating lattice (κl); (2) electrons and holes transporting heat (κe):
 
κ = κl + κe (10)

Depending on the Debye theory, the lattice thermal conductivity follows the 1/T dependence when the phonon transport is dominated by Umklapp scattering above the Debye temperature (ΘD). However, this process continues until the minimum lattice thermal conductivity (κmin) is reached.40 In our studied temperature range from 500 to 800 K (T > ΘD), it is reasonable to calculate lattice thermal conductivity by the minimum lattice thermal conductivity (κmin). The κmin can be approximated obtained by:

 
image file: c6ra04986a-t8.tif(11)
where V is the average volume per atom, νs and νl are the shear and longitudinal velocities and are given by:
 
image file: c6ra04986a-t9.tif(12)
 
image file: c6ra04986a-t10.tif(13)
where G, B, and ρ are the shear modulus, bulk modulus, and density, respectively. The shear modulus G, and bulk modulus B are deduced according to the following formula:41
 
image file: c6ra04986a-t11.tif(14)
 
image file: c6ra04986a-t12.tif(15)

Eqn (11) indicates that κmin is proportional to the shear and longitudinal velocities, and is inversely proportional to the average volume per atom.

Table 1 shows the calculated elastic constants and κmin, these values are in the excellent agreement with the results of Aleksandr Chernatynskiy et al.42 We see that the κmin values show a significant decrease with increasing atomic number of X, this phenomenon is primarily due to the decrease of the velocity of the optical modes decreasing with the increasing atomic number of X. Moreover, the larger average volume of Mg2Sn also promotes the decrease the minimum lattice thermal conductivity. Interestingly, Mg2Sn is found to have an exceptionally low lattice thermal conductivity (0.65 W m−1 K−1) and is found to approach the glassy minimum at high temperature, indicating that it may have a high ZT. For Mg2Si and Mg2Ge, the calculated values of κmin are 1.27 and 0.96 W m−1 K−1, respectively. Compared to the state-of-the-art thermoelectric material,1,3,4 these values are very high. Thus, the challenge with Mg2Si and Mg2Ge is determining how to reduce the lattice thermal conductivity. Glasses exhibit some of the lowest lattice thermal conductivities. In a glass, the thermal conductivity is viewed as a random walk of energy through a lattice rather than rapid transport via phonons, and leads to the concept of a minimum thermal conductivity.43 This finding may provide predictive theoretical guidance for methods to reduce the lattice thermal conductivity such as isotope doping,28,44,45 embedded nanoinclusions,45 and fabricating synthetic nanostructures as thin-film superlattices or as nanowires.46

Table 1 Calculated and experimental elastic constants (in GPa), theoretical density (ρ in g cm−3), average volume per atom (V in Å3), bulk modulus (B in GPa), shear modulus (G in GPa), shear sound velocities (νs in m s−1), longitudinal sound velocities (νl in m s−1), and minimum lattice thermal conductivity (κmin in W m−1 K−1) of Mg2Si, Mg2Ge, and Mg2Sn
Phase Source C11 C12 C44 ρ V B G νs νl κmin
Mg2Si Present 117.72 24.11 47.45 1.99 21.35 55.6 52.5 4891 7738 1.27
Exp.51 121 22.0 46.4 55.0 47.6 4830–4970 (ref. 42) 7650–7680 (ref. 42)  
Cal.41 114.07 19.56 33.32 51.06 46.12
Mg2Ge Present 108.24 21.84 44.17 3.06 22.03 50.6 44.4 3810 5992 0.96
Exp.52 117.90 23.0 46.5 54.6 46.9
Cal.41 110.60 15.17 42.12 46.98 44.36
Mg2Sn Present 69.98 26.37 32.03 3.51 26.47 40.9 27.9 2818 4715 0.65
Exp.53 82.4 20.8 36.6 41.3 34.2 ∼3000 ∼5000
Cal.41 83.71 39.79 21.69 42.36 21.798


We now discuss the electronic thermal conductivity κe in eqn (10). The electronic thermal conductivity κe is calculated through the Wiedemann-Franz law:47

 
κe = LσT = neμLT (16)
here, L is the Lorenz factor, which is estimated based on the Fermi–Dirac statistics.44 For Mg2X, the Lorenz number is found to be 1.8–1.9 × 10⁻⁸ V2 K−2 around the carrier concentration of 1020 cm−3 and is therefore used in our calculations.26 Fig. 5 shows the carrier concentration dependence of the electronic thermal conductivity κe mimics the behavior of the electrical conductivity σ from 500 to 800 K. The general trend is a monotonous increase monotonously with increasing carrier concentration and a mild decrease with increasing temperature.


image file: c6ra04986a-f5.tif
Fig. 5 Calculated κe of Mg2Si (a), Mg2Ge (b), and Mg2Sn (c) as a function of carrier concentration from 1019 to 1021 cm−3 at 500 K, 600 K, 700 K, and 800 K.

E. Optimized ZT value

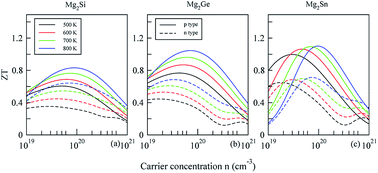
With all of the transport coefficients available, we can obtain the ZT values of Mg2X (X = Si, Ge, and Sn) using eqn (1). Fig. 6 shows the dependence of the optimized ZT values dependence of the carrier-concentration at 500, 600, 700, and 800 K. It is found that the ZT values of p-type Mg2X are larger than those of n-type Mg2X, primarily because of the values of larger S2σ of p-type Mg2X than those of n-type Mg2X. These figures also show that the maximum ZT value (ZTmax) reaches 1.1 for Mg2Sn at 800 K with a carrier concentration of 9.8 × 10¹⁹ per cm−3, which is higher than that of Mg2Si (0.8) and Mg2Ge (1.0). This observation is primarily related to the fact that the lattice thermal conductivity κl for Mg2Sn is lower than that of Mg2Si and Mg2Ge. As noted before, the lattice thermal conductivity κl of Mg2X could be further reduced by many other means such as isotope doping48 and the use of embedded nanoinclusions,46,49,50 which has a minimal effect on the electrical conductivity σ. In other words, there is still room to improve the thermoelectric performance of Mg2Sn. Thus, Mg2Sn is a promising mid-temperature thermoelectric material.
image file: c6ra04986a-f6.tif
Fig. 6 Calculated ZT of Mg2Si (a), Mg2Ge (b), and Mg2Sn (c) as a function of carrier concentration from 1019 to 1021 cm−3 at 500 K, 600 K, and 800 K.

IV. Conclusion

In summary, we studied the thermoelectric properties of Mg2X (X = Si, Ge, and Sn) using the first-principle calculations and semi-classical Boltzmann theory. The high ZT of p-type was found to primarily originate from a large power factor corresponding to the combination of heavy and light bands at the valence bands that simultaneously increase the Seebeck coefficient and the electrical conductivity. Note that the value of ZTmax of Mg2Sn reaches exceptionally large values of 1.1 at 800 K with a carrier concentration of 1.9 × 10²⁰ h+ cm−3, which is higher than that of Mg2Si (0.8) and Mg2Ge (1.0). Through further research efforts, we find the high ZT of Mg2Sn is mainly due to the low lattice thermal conductivity, which is caused by the higher density and lower velocity of the optical modes. These observations suggest that the p-type Mg2Sn is a low-cost, environment-friendly intermediate temperature thermoelectric material with the most promise for practical application.

Acknowledgements

This research was sponsored by the National Natural Science Foundation of China (No. 21071045, No. U1204112, No. 11305046, No. 51371076, No. 11274222 and No 11328401), the Scheme of Backbone Youth Teachers in University of Henan Province (2014GGJS-027), the Key Scientific and Technological Projects in Henan Province (152102210047), the Program for New Century Excellent Talents in University (No. NCET-10-0132), and the Program for Innovative Research Teams (in Science and Technology) in University of Henan Province (No. 13IRTSTHN017).

References

  1. R. Venkatasubramanian, E. Siivola, T. Colpitts and B. O'quinn, Nature, 2001, 413, 597–602 CrossRef CAS PubMed.
  2. R. Chen, A. I. Hochbaum, R. D. Delgado, W. Liang, E. C. Garnett, M. Najarian, A. Majumdar and P. Yang, APS Meeting, 2008 Search PubMed.
  3. K. F. Hsu, S. Loo, F. Guo, W. Chen, J. S. Dyck, C. Uher, T. Hogan, E. Polychroniadis and M. G. Kanatzidis, Science, 2004, 303, 818–821 CrossRef CAS PubMed.
  4. E. Quarez, K.-F. Hsu, R. Pcionek, N. Frangis, E. Polychroniadis and M. G. Kanatzidis, J. Am. Chem. Soc., 2005, 127, 9177–9190 CrossRef CAS PubMed.
  5. T. Dasgupta, C. Stiewe, R. Hassdorf, A. Zhou, L. Boettcher and E. Mueller, Phys. Rev. B: Condens. Matter Mater. Phys., 2011, 83, 235207 CrossRef.
  6. S. Muthiah, B. Sivaiah, B. Gahtori, K. Tyagi, A. K. Srivastava, B. D. Pathak, A. Dhar and R. C. Budhani, J. Electron. Mater., 2014, 43, 1–5 CrossRef.
  7. S. K. Bux, M. T. Yeung, E. S. Toberer, G. J. Snyder, R. B. Kaner and J. P. Fleurial, J. Mater. Chem., 2011, 21, 12259–12266 RSC.
  8. S.-W. You and I.-H. Kim, Curr. Appl. Phys., 2011, 11, S392–S395 CrossRef.
  9. J. I. Tani and H. Kido, Phys. B, 2005, 364, 218–224 CrossRef CAS.
  10. J. I. Tani and H. Kido, J. Alloys Compd., 2008, 466, 335–340 CrossRef CAS.
  11. Y. Isoda, M. Held, S. Tada and Y. Shinohara, J. Electron. Mater., 2014, 43, 2503 CrossRef.
  12. H. Gao, T. Zhu, X. Liu, L. Chen and X. Zhao, J. Mater. Chem., 2011, 21, 5933–5937 RSC.
  13. W. Liu, X. Tan, K. Yin, H. Liu, X. Tang, J. Shi, Q. Zhang and C. Uher, Phys. Rev. Lett., 2012, 108, 166601 CrossRef PubMed.
  14. G. Kresse and J. Hafner, J. Phys.: Condens. Matter, 1994, 6, 8245 CrossRef CAS.
  15. P. E. Blochl, Phys. Rev. B: Condens. Matter Mater. Phys., 1994, 50, 17953 CrossRef CAS; G. Kresse and J. Joubert, Phys. Rev. B: Condens. Matter Mater. Phys., 1999, 59, 1758 CrossRef.
  16. D. M. Ceperley and B. Alder, Phys. Rev. Lett., 1980, 45, 566 CrossRef CAS.
  17. D. J. Singh and W. E. Pickett, Phys. Rev. B: Condens. Matter Mater. Phys., 1994, 50, 11235 CrossRef CAS.
  18. V. Marinca and R. D. Ene, Cent. Eur. J. Phys., 2014, 12, 503–510 Search PubMed.
  19. E. Fermi, Z. Phys., 1928, 48, 73–79 CrossRef CAS.
  20. P. Blaha, K. Schwarz, G. Madsen, D. Kvasnicka and J. Luitz, WIEN2k: An Augmented Plane Wave plus Local Orbitals Program for Calculating Crystal Properties, TU Wien, 2001 (ISBN 3-9501031-1-2) Search PubMed.
  21. P. Hohenberg and W. Kohn, Phys. Rev., 1964, 136, B864 CrossRef.
  22. D. Koelling and B. Harmon, J. Phys. C: Solid State Phys., 1977, 10, 3107 CrossRef CAS.
  23. F. Tran and P. Blaha, Phys. Rev. Lett., 2009, 102, 226401 CrossRef PubMed.
  24. E. Engel and S. H. Vosko, Phys. Rev. B: Condens. Matter Mater. Phys., 1993, 47, 13164 CrossRef CAS.
  25. G. K. Madsen and D. J. Singh, Comput. Phys. Commun., 2006, 175, 67–71 CrossRef CAS.
  26. X. J. Tan, W. Liu, H. J. Liu, J. Shi, X. F. Tang and C. Uher, Phys. Rev. B: Condens. Matter Mater. Phys., 2012, 85, 205212 CrossRef.
  27. T. Dasgupta, C. Stiewe, R. Hassdorf, A. J. Zhou, L. Boettcher and E. Mueller, Phys. Rev. B: Condens. Matter Mater. Phys., 2011, 83, 235207 CrossRef.
  28. V. K. Zaitsev, M. I. Fedorov, E. A. Gurieva, I. S. Eremin, P. P. Konstantinov, A. Y. Samunin and M. V. Vedernikov, Phys. Rev. B: Condens. Matter Mater. Phys., 2006, 74, 045207 CrossRef.
  29. A. Savin, R. Nesper, S. Wengert and T. F. Fässler, Angew. Chem., Int. Ed. Engl., 1997, 36, 1808–1832 CrossRef CAS.
  30. L. D. Hicks and M. S. Dresselhaus, Phys. Rev. B: Condens. Matter Mater. Phys., 1993, 47, 12727 CrossRef CAS.
  31. O. Benhelal, A. Chahed, S. Laksari, B. Abbar, B. Bouhafs and H. Aourag, Phys. Status Solidi B, 2005, 242, 2022–2032 CrossRef CAS.
  32. J. J. Pulikkotil, S. Auluck, M. Saravanan, D. K. Misra, D. J. Singh, A. Dhar and R. C. Budhani, Phys. Rev. B: Condens. Matter Mater. Phys., 2012, 86, 755–759 CrossRef.
  33. W. Liu, X. F. Tang and J. Sharp, J. Phys. D: Appl. Phys., 2010, 43, 085406 CrossRef.
  34. N. Wang, H. Li, Y. Ba, Y. Wang, C. Wan, K. Fujinami and K. Koumoto, J. Electron. Mater., 2010, 39, 1777–1781 CrossRef CAS.
  35. M. Chen, J. Appl. Phys., 1992, 71, 3636–3638 CrossRef CAS.
  36. K. P. Ong, D. J. Singh and P. Wu, Phys. Rev. B: Condens. Matter Mater. Phys., 2011, 83, 115110 CrossRef.
  37. M. Akasaka, T. Iida, A. Matsumoto, K. Yamanaka, Y. Takanashi, T. Imai and N. Hamada, J. Appl. Phys., 2008, 104, 013703 CrossRef.
  38. H. Gao, T. Zhu, X. Zhao and Y. Deng, Intermetallics, 2015, 56, 33–36 CrossRef CAS.
  39. A. Zevalkink, G. S. Pomrehn, S. Johnson, J. Swallow, Z. M. Gibbs and G. J. Snyder, Chem. Mater., 2012, 24, 2091–2098 CrossRef CAS.
  40. Y. Wang, D. Luo, Y. Yan, G. Yang and J. Yang, J. Mater. Chem. A, 2014, 2, 15159–15167 Search PubMed.
  41. D. Zhou, J. Liu, S. Xu and P. Peng, Comput. Mater. Sci., 2012, 51, 409–414 CrossRef CAS.
  42. A. Chernatynskiy and S. R. Phillpot, Phys. Rev. B: Condens. Matter Mater. Phys., 2015, 92, 064303 CrossRef.
  43. G. A. Slack, Solid State Phys., 1979, 34, 171 Search PubMed.
  44. J. Beck, M. Alvarado, D. Nemir, M. Nowell, L. Murr and N. Prasad, J. Electron. Mater., 2012, 41, 1595–1600 CrossRef CAS.
  45. Q. Zhang, J. He, T. Zhu, S. Zhang, X. Zhao and T. Tritt, Appl. Phys. Lett., 2008, 93, 102109 CrossRef.
  46. K. Biswas, J. He, Q. Zhang, G. Wang, C. Uher, V. P. Dravid and M. G. Kanatzidis, Nat. Chem., 2011, 3, 160–166 CrossRef CAS PubMed.
  47. G. J. Snyder and E. S. Toberer, Nat. Mater., 2008, 7, 105–114 CrossRef CAS PubMed.
  48. N. Yang, G. Zhang and B. Li, Nano Lett., 2008, 8, 276–280 CrossRef CAS PubMed.
  49. J. Zhou, X. Li, G. Chen and R. Yang, Phys. Rev. B: Condens. Matter Mater. Phys., 2010, 82, 115308 CrossRef.
  50. S. Wang and N. Mingo, Appl. Phys. Lett., 2009, 94, 3109 Search PubMed.
  51. W. B. Whitten, P. L. Chung and G. C. Danielson, J. Phys. Chem. Solids, 1965, 26, 49–56 CrossRef CAS.
  52. P. L. Chung, W. B. Whitten and G. C. Danielson, J. Phys.: Condens. Matter, 1965, 26, 1753–1760 CAS.
  53. L. C. Davis, W. B. Whitten and G. C. Danielson, J. Phys. Chem. Solids, 1967, 28, 439–447 CrossRef CAS.

This journal is © The Royal Society of Chemistry 2016