Determination of sparfloxacin and besifloxacin hydrochlorides using gold nanoparticles modified carbon paste electrode in micellar medium†
Ali K. Attia*a,
Amr M. Badawyb and
Samr G. Abd-Elhamida
aNational Organization for Drug Control and Research, P. O. Box 29, Cairo, Egypt. E-mail: alikamal1978@hotmail.com; Fax: +20 002 0235855582; Tel: +20 002 0235851278
bFaculty of Pharmaceutical Sciences & Pharmaceutical Industries, University of Future, Cairo, Egypt
First published on 12th April 2016
Abstract
A gold nanoparticles modified carbon paste electrode (AuCPE) was used to study the electrochemical behavior of sparfloxacin HCl (SPAR) and besifloxacin HCl (BESI) using cyclic and differential pulse voltammetry modes in the presence of micellar medium. Effect of different surfactants on peak current was studied in Britton–Robinson buffer solution of pH 2. Sodium dodecyl sulphate is the optimum surfactant based on the enhancement of the peak current. The modified electrode shows highly sensitive sensing giving an excellent response for SPAR and BESI. The peak current varied linearly over the concentration ranges from 1.1 × 10⁻⁷ mol L−1 to 3.3 × 10⁻⁶ mol L−1 and from 2.2 × 10⁻⁶ mol L−1 to 5.5 × 10⁻⁵ mol L−1 with determination coefficients of 0.9976 and 0.9984 in case of SPAR and BESI, respectively. The recoveries and the relative standard deviations were found in the following ranges: 99.97–101.4% and 0.63–1.48% for SPAR and 99.89–101.1% and 0.85–1.76% for BESI. The detections limits were 2.87 × 10⁻⁸ and 3.76 × 10⁻⁷ mol L−1 for SPAR and BESI, respectively. The proposed method has been successfully applied to determine SPAR and BESI in biological fluids.
1. Introduction
SPAR is a third generation fluoroquinolone, used in the treatment of lung infection, urinary tract infection and cutaneous allergy. SPAR is receiving attention due to its broad spectrum activity, potency and excellent pharmacokinetic profiles.1,2 BESI is a fluoroquinolone antibacterial with activity against Gram-positive and Gram-negative bacteria due to the inhibition of both bacterial DNA gyrase and topoisomerase IV.3,4Electrochemical methods,5–9 chromatographic methods,10–16 spectrophotometric methods,17–24 chemiluminescence method,25 and conductometric method,26 have been reported for quantitative determination of SPAR in bulk and pharmaceutical dosage forms. Other chromatographic methods,27–30 and spectrophotometric methods,31,32 have been reported for quantitative determination of BESI in bulk and pharmaceutical dosage forms.
Gold nanoparticles (GNPs) are very important in electrochemistry based on the formation of monolayers on the electrode surface leading to large surface area, good and high conductivity, so they are used in electrochemical studies.33–37 There is no attempt to study the electrochemical behavior of BESI. The reported electrochemical methods used to determine SPAR using glassy carbon electrode,5–7 polagraphic method using dropping mercury electrode,8 and carbon paste electrode (CPE).9
The need to determine drugs at high sensitivity and wider ranges than the reported methods, therefore in the present study, it was intend to develop a rapid, economical, simple, precise and more sensitive voltammetric method for the determination of SPAR and BESI in bulk, dosage forms and biological fluids using cyclic voltammetry (CV) and differential pulse voltammetry (DPV) techniques showing very low detection limits and wider linear ranges for the used drugs.
2. Experimental
2.1. Materials and reagents
SPAR was provided from Pharaonia pharmaceuticals, Cairo, Egypt. BESI was purchased from Bausch & Lomb Inc., New York, USA. Spara tablets were provided from Global Napi Pharmaceuticals, Cairo, Egypt. Each tablet is labeled to contain 200 mg of SPAR. Besivance eye drops were provided from Bausch & Lomb Inc., New York, USA. It is labeled to contain 0.6% per 5 mL of BESI.All chemicals and reagents used throughout the work were of analytical reagent grade and solutions were made with doubly distilled water. Stock solutions of 1.0 × 10⁻³ mol L−1 of SPAR and BESI were prepared by dissolving the accurately weighed amount in doubly distilled water and methanol, respectively. The stock solutions were stored in dark bottle and kept in the refrigerator for no more than seven days. Ascorbic acid (AA), uric acid (UA), sodium dodecyl sulphate (SDS), Tween 80 and cetyltrimethyl ammonium bromide (CTAB) were provided from Sigma-Aldrich, Taufkirchen, Germany. Britton–Robinson (BR) buffer solutions (pH 2–9) were used as supporting electrolytes. BR buffers were made by mixing a solution of 0.04 mol L−1 phosphoric acid, 0.04 mol L−1 acetic acid and 0.04 mol L−1 boric acid which obtained from El-Nasr pharmaceutical company, Cairo, Egypt. Buffer solutions were adjusted by adding the necessary amount of 2.0 mol L−1 NaOH solutions in order to obtain the appropriate pH. Graphite powder and mineral oil were supplied from Sigma-Aldrich, Taufkirchen, Germany.
2.2. Electrochemical measurements
All voltammetric measurements were performed using a pc-controlled AEW2 electrochemistry work station and data were analyzed with ECprog3 electrochemistry software, manufactured by SYCOPEL SCIENTIFIC LIMITED (Tyne & Wear, UK). The one compartment cell with the three electrodes was connected to the electrochemical workstation through a C3-stand. Platinum wire was employed as auxiliary electrode. All the cell potentials were measured with respect to Ag/AgCl (3 mol L−1 NaCl) reference electrode. Glass cell (5 mL) was used for electrochemical measurements. All electrodes and the C3 stand were obtained from BASi (Indiana, USA). A JENWAY 3510 pH meter (Staffordshire, England) with glass combination electrode was used for pH measurements. All the electrochemical experiments were performed at an ambient temperature of 25 °C.2.3. Gold nanoparticles modified electrode
CPE with a diameter of 3 mm was prepared as described before,38 and then it was immersed into a 6 mmol L−1 hydrogen tetrachloroaurate HAuCl4 solution containing 0.1 mol L−1 KNO3 prepared in doubly distilled water and deaerated by bubbling with nitrogen. A constant potential of −0.4 V vs. Ag/AgCl was applied for 400 s.39 Then, the modified electrode AuCPE was washed with doubly distilled water and dried carefully by a paper without touching the surface and then left to dry in air for 10 min before being used.2.4. Effect of surfactants
The cyclic voltammograms of SPAR and BESI (1 × 10⁻³ mol L−1) in BR buffer of pH 2 were studied on AuCPE upon successive additions of each of the following surfactants: (SDS), (Tween 80) and (CTAB) of the same concentration of 1 × 10⁻² mol L−1 to obtain the optimum one.2.5. Determination of SPAR and BESI in bulk
Aliquots of SPAR and BESI solutions (1 × 10⁻³ mol L−1) were added to the electrolytic cell containing 5 mL of BR buffer of pH 2. The solution was stirred for 10 s for SPAR and 5 s for BESI at open circuit conditions at AuCPE/SDS and voltammetric analyses were carried out and the voltammograms were recorded at scan rate = 10 mV s−1, pulse width = 25 ms and pulse amplitude = 50 mV.2.6. Determination of investigated drugs in pharmaceutical preparations
In two separate 100 mL calibrated flasks add an amount of Spara tablets and Besivance eye drops equivalent to prepare 1 × 10⁻³ mol L−1 SPAR and BESI solutions, and then add 70 mL of doubly distilled water and methanol, respectively. The content of the flasks were sonicated for about 15 min and then made up to the volume with the same solvent. The solution was filtered to separate the insoluble excipients. Aliquots of the drugs solution were introduced into the electrolytic cell and the general procedure was carried out.2.7. Analysis of drugs in urine and plasma
Urine and plasma samples were obtained from healthy volunteers; standard SPAR was dissolved in urine to make 1 × 10⁻³ mol L−1 concentration. Successive additions of SPAR (1 × 10⁻³ mol L−1) were added to the voltammetric cell containing 5 mL BR buffer of pH 2. Different volumes (0.2–1 mL) of BESI (1 × 10⁻³ mol L−1) were added to different tubes containing 1 mL of plasma and 3 mL of acetonitrile shake very well then centrifuge, then take 1 mL of the supernatant and complete the volume to 10 mL with methanol, finally take 0.5 mL of the successive additions of BESI (1 × 10⁻³ mol L−1) were added to 5 mL BR buffer pH 2. All experiments were performed in compliance with the relevant laws and institutional guidelines, and the institutional committees (NODCAR, Egypt) have approved these experiments and any experimentation with human subjects. Informed consent was obtained from all participants or their relatives.3. Results and discussion
3.1. Optimization of the method
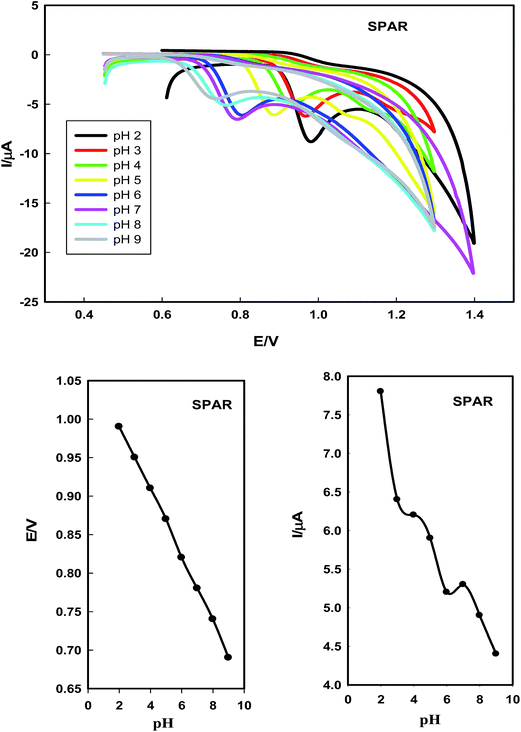
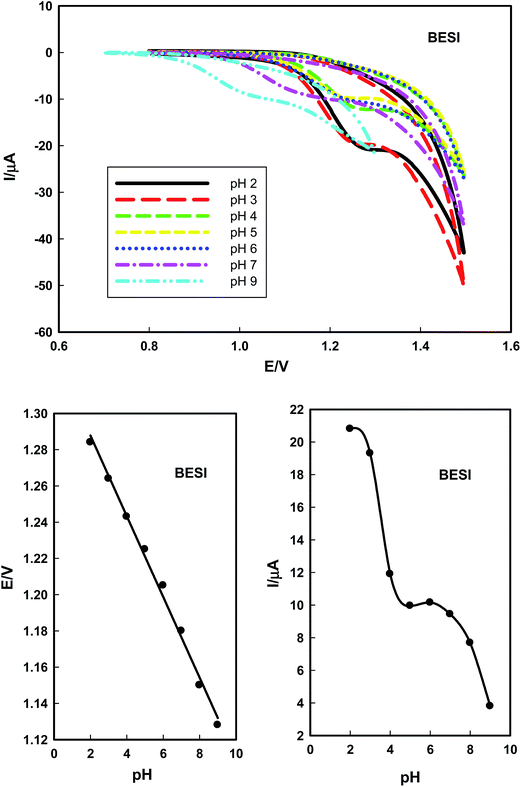
The proposed voltammetric method used for the determination of SPAR and BESI is safe because it does not use toxic chemicals. | ||
| Fig. 3 The linear relations of peak current of 1 × 10⁻³ mol L−1 SPAR and BESI at CPE in BR buffers of pH 2 at scan rate of 100 mV s−1 as a function of surfactants types. | ||
SPAR and BESI are positively charged and attracted to the negative charges of the head of SDS surfactant, therefore, 8 × 10⁻⁵ mol L−1 of SDS was chosen as the optimum surfactant in this study. Since SPAR and BESI are positively charged in solution, SDS is the most suitable surfactant as anionic surfactant for the determination of these drugs in micellar medium.
![[thin space (1/6-em)]](https://www.rsc.org/images/entities/char_2009.gif) I = −0.013 + 0.59
I = −0.013 + 0.59![[thin space (1/6-em)]](https://www.rsc.org/images/entities/char_2009.gif) log
log![[thin space (1/6-em)]](https://www.rsc.org/images/entities/char_2009.gif) ν, r2 = 0.9982, and for BESI. The oxidation peak current increases linearly with the linear regression equations as log
ν, r2 = 0.9982, and for BESI. The oxidation peak current increases linearly with the linear regression equations as log![[thin space (1/6-em)]](https://www.rsc.org/images/entities/char_2009.gif) I = 0.106 + 0.81
I = 0.106 + 0.81![[thin space (1/6-em)]](https://www.rsc.org/images/entities/char_2009.gif) log
log![[thin space (1/6-em)]](https://www.rsc.org/images/entities/char_2009.gif) ν, r2 = 0.9920. The slopes 0.59 (SPAR) and 0.81 (BESI) suggest that the oxidation reactions at the electrode surface take place under adsorption–diffusion controlled process.43
ν, r2 = 0.9920. The slopes 0.59 (SPAR) and 0.81 (BESI) suggest that the oxidation reactions at the electrode surface take place under adsorption–diffusion controlled process.43
In case of irreversible electrode process, the peak potential (Ep) and scan rate (ν) are defined by the following Laviron equation.44
Ep = Eo + 2.303RT/αnF[log![[thin space (1/6-em)]](https://www.rsc.org/images/entities/char_2009.gif) RTKo/αnF + log RTKo/αnF + log![[thin space (1/6-em)]](https://www.rsc.org/images/entities/char_2009.gif) ν] ν] |
![[thin space (1/6-em)]](https://www.rsc.org/images/entities/char_2009.gif) 485 C mol−1), respectively. Thus we can calculate αn from the slope of the relation between Ep versus log
485 C mol−1), respectively. Thus we can calculate αn from the slope of the relation between Ep versus log![[thin space (1/6-em)]](https://www.rsc.org/images/entities/char_2009.gif) ν.
ν.
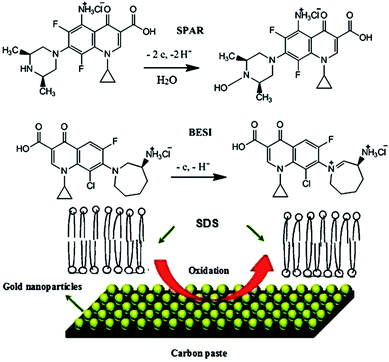
In this case, the slope values are 0.055 and 0.092, for SPAR and BESI, respectively; αn values were calculated to be 1.075 and 0.642. Generally, α (electron transfer coefficient) was assumed to be 0.5. Thus, the value of electrons number n = 2.15 (≈2) and 1.286 (≈1) were obtained confirming the proposed electro-oxidation mechanisms of SPAR and BESI as shown in Fig. 6.
3.2. Chronoamperometric studies
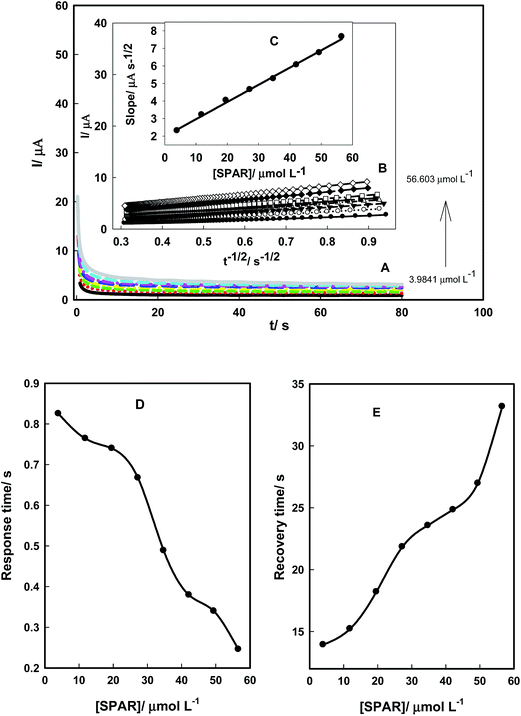
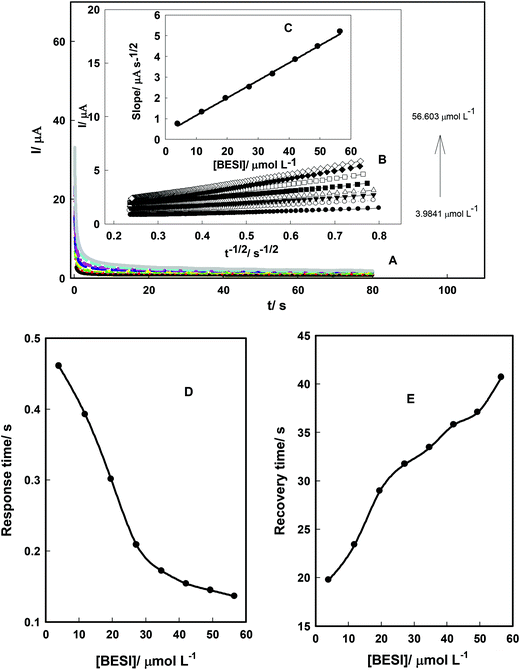
Chronoamperometry technique was used to obtain the diffusion coefficients of SPAR and BESI. Fig. 8A and 9A show the chronoamperograms of AuCPE/SDS in the presence of different concentrations of SPAR and BESI. The current varied linearly with t−1/2 (the minus square roots of time) as shown in Fig. 8B and 9B. Using the slopes of these lines, the diffusion coefficient of SPAR and BESI can be calculated using Cottrell's equation: I = nFAC(D/πt)1/2 where n is the number of electrons involved in the electro-oxidation process (n = 2 and 1 for SPAR and BESI, respectively), F is the Faraday constant, C is the analyte concentration, D is the diffusion coefficient, and A is electrode area.45 The slopes of the resulting straight lines were then plotted against SPAR and BESI concentrations (Fig. 8C and 9C). From the resulting slopes, the diffusion coefficients were found to 1.62 × 10⁻⁷ cm2 s−1 and 4.81 × 10⁻⁷ cm2 s−1 for SPAR and BESI, respectively.Fig. 8D and E and 9D and E show the effect of SPAR and BESI concentrations on the response and the recovery times on the AuCPE/SDS electrode with respect to the shortest response time and the recovery time. The response time decreases and the recovery time increases with increasing SPAR and BESI concentrations, which may be attributed to the adsorption/desorption process of SPAR and BESI on the electrode surface. Finally, AuCPE/SDS electrode shows fast response and recovery times for SPAR and BESI in comparison with the reported methods which were not interested in studying the response and recovery times.
3.3. Method validation
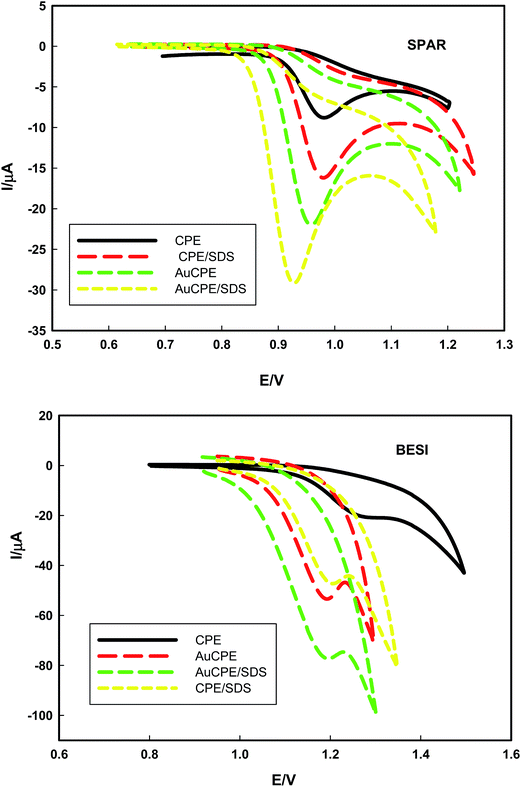
Differential pulse voltammetry (DPV) was used to determine SPAR and BESI (1 × 10⁻⁵ mol L−1) in presence of equimolar solutions of AA and UA (1 × 10⁻⁴ mol L−1), the applied scan rate was 10 mV s−1. Fig. 10 shows the differential pulse voltammograms at CPE and AuCPE/SDS in BR buffer (pH 2). The anodic peak current increased from 10.42 μA (0.993 V) in case of CPE to 18.98 μA (0.962 V) in case of AuCPE/SDS, while in case of BESI, the anodic peak current increased from 24.3 μA (1.3 V) in case of CPE to 48.90 μA (1.2 V) in case of AuCPE/SDS.
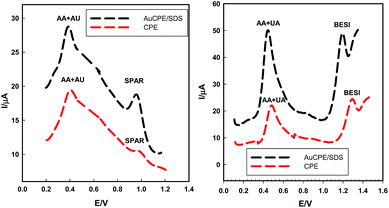 | ||
| Fig. 10 The differential pulse voltammograms of SPAR and BESI in presence of AA and UA mixture in BR buffer of pH 2 at AuCPE/SDS at scan rate of 10 mV s−1. | ||
The pKa values of AA and UA are 4.2 and pKa 5.4, respectively. Therefore, AA and UA exist as anions at pH higher than 4.2 and 5.4 whereas at pH less than 4.2 and 5.4, they appear as anionic and neutral species.49–51 Therefore, the anionic and neutral species of AA and UA are unaffected with SDS micelles which are electrostatically attracted to the positively charged cations of SPAR and BESI through the negatively charged head of SDS showing an increase of peak currents and improve the sensitivity and selectively of the sensor towards SPAR and BESI in the presence of AA and UA showing catalytic effect.
Validation of the proposed methods was assessed as per the International Conference on Harmonization (ICH) Tripartite Guideline Q2 (R1) was followed to validate the method.52
For SPAR, the limit of detection (LOD) and the limit of quantification (LOQ) were found to be 2.87 × 10⁻⁸ mol L−1 and 9.57 × 10⁻⁸ mol L −1, respectively. In case of BESI, LOD and LOQ were found to be 3.76 × 10⁻⁷ mol L−1 and 1.25 × 10⁻⁶ mol L−1, respectively. Both LOD and LOQ values confirm the sensitivity of AuCPE/SDS.
The recoveries were found in the following ranges: 99.97–101.4% for SPAR and 99.89–101.1%, for BESI. The relative standard deviations were found in the following ranges: 0.63–1.48% and 0.85–1.76% for SPAR and BESI, respectively. The results are shown in Table 1.
| Parameters | SPAR | SPAR in urine | BESI | BESI in plasma |
|---|---|---|---|---|
| Linearity range (mol L−1) | 1.1 × 10⁻⁷ to 3.3 × 10⁻⁶ | 2.22 × 10⁻⁷ to 2.80 × 10⁻⁶ | 2.2 × 10⁻⁶ to 5.5 × 10⁻⁵ | 8.0 × 10⁻⁶ to 4.5 × 10⁻⁵ |
| Slope | 0.385 | 0.410 | 0.227 | 0.250 |
| Intercept | 8.56 | 7.88 | 7.85 | 6.85 |
| Determination coefficient (r2) | 0.9976 | 0.9964 | 0.9984 | 0.9980 |
| LOD (mol L−1) | 2.87 × 10⁻⁸ | 4.15 × 10⁻⁸ | 3.76 × 10⁻⁷ | 9.12 × 10⁻⁷ |
| LOQ (mol L−1) | 9.57 × 10⁻⁸ | 1.38 × 10⁻⁷ | 1.25 × 10⁻⁶ | 3.04 × 10⁻⁶ |
The repeatability of the proposed DPV procedure was investigated on five measurements of 2.5 × 10⁻⁷ mol L−1 SPAR solution and 3.25 × 10⁻⁶ mol L−1 BESI solution, the relative standard deviation (RSD) was found to be 1.23% (SPAR) and 1.57% (BESI) indicating good results. Table 2 shows the comparison of the proposed method with the mentioned reported methods for the determination of SPAR and BESI.
| Method | SPAR linear range | Ref. | BESI linear range | Ref. |
|---|---|---|---|---|
| Proposed voltammetry (mol L−1) (μg mL−1) | 1.1 × 10⁻⁷ to 3.3 × 10⁻⁶ (0.047–1.415) | — | 2.2 × 10⁻⁶ to 5.5 × 10⁻⁵ (0.947–23.67) | — |
| Voltammetry (mol L−1) | 1 × 10⁻⁵ to 1 × 10⁻⁴ | 5 | — | — |
| 2 × 10⁻⁷ to 1.4 × 10⁻⁶ | 6 | |||
| 5 × 10⁻⁶ to 1.5 × 10⁻⁵ | 7 | |||
| 2 × 10⁻⁷ to 6 × 10⁻⁵ | 9 | |||
| Chromatography (μg mL−1) | 3.0–14 | 8 | 20–80 | 25 |
| 5.0–80 | 9 | |||
| 25.0–150 | 10 | |||
| 30–90 | 11 | |||
| 1.0–80 | 12 | |||
| 1.0–10 | 14 | |||
| Spectrophotometry (μg mL−1) | 0.1–1.4 | 15 | 2.5–80, 3.0–30 | 29 and 30 |
| 5.0–25 | 16 | |||
| 0.1–1.4 | 17 | |||
| 5.0–25 | 18 | |||
| 10–60 | 19 | |||
| 5.0–25 | 20 | |||
| 0.5–7.0 | 21 | |||
| 20–100 | 22 |
| Drug | Spara tablets | Besivance eye drops | ||||||
|---|---|---|---|---|---|---|---|---|
| 10−7 mol L−1 | % recovery | 10−6 mol L−1 | % recovery | |||||
| Added | Taken | Found | Added | Taken | Found | |||
| a Mean for five determinations.b SD is the standard deviation.c RSD = (SD/mean) × 100. | ||||||||
| 2.00 | 4.0 | 6.020 | 100.33 | 2.00 | 4.0 | 6.030 | 100.50 | |
| 6.00 | 10.01 | 100.10 | 6.00 | 10.08 | 100.80 | |||
| 8.00 | 12.03 | 100.25 | 8.00 | 12.01 | 100.08 | |||
| 10.0 | 13.99 | 99.928 | 10.0 | 13.98 | 99.857 | |||
| 12.0 | 16.04 | 100.25 | 12.0 | 16.02 | 100.12 | |||
| Meana | 100.171 | 100.271 | ||||||
| SDb | 0.160 | 0.375 | ||||||
| RSDc | 0.159 | 0.374 | ||||||
| Drug | SPAR | BESI | ||||
|---|---|---|---|---|---|---|
| 10−7 mol L−1 | % recovery | 10−6 mol L−1 | % recovery | |||
| Added | Found | Added | Found | |||
| a Mean for five determinations.b RSD = (SD/mean) × 100. | ||||||
| 2.22 | 2.241 | 100.94 | 8.00 | 8.160 | 102.00 | |
| 6.00 | 5.990 | 99.833 | 16.0 | 15.88 | 99.250 | |
| 8.00 | 8.030 | 100.37 | 18.0 | 18.02 | 100.11 | |
| 10.0 | 10.04 | 100.40 | 30.0 | 30.12 | 100.40 | |
| 12.0 | 12.01 | 100.08 | 40.0 | 40.18 | 100.45 | |
| Meana | 100.324 | 100.442 | ||||
| SD | 0.414 | 0.995 | ||||
| RSDb | 0.412 | 0.990 | ||||
4. Conclusion
In the present work, novel sensor based on modification of CPE with gold nanoparticles in presence of surfactants was used for electrochemical determination of SPAR and BESI. The advantages of the gold nanoparticles/surfactant enhanced the sensitivity of the CPE towards these drugs. The results showed that the method is easy-to-handle, rapid, ecofriendly, simple and sensitive for the determination of SPAR and BESI in human urine and plasma with good precision, accuracy, selectivity and very low detection limit. The high percentage of recoveries in pharmaceutical formulations without any treatment confirms the suitability of the proposed method. Further, due to stability, accuracy and low cost, the method offers promise as a substitute for the previous approaches used in routine analysis.Acknowledgements
The authors would like to express their gratitude to National Organization for Drug Control and Research (NODCAR, Egypt) for providing instruments and chemicals.References
- K. Sato, Y. Inoue, T. Fujii, H. Aoyama and M. Inoue, Antimicrob. Agents Chemother., 1986, 30, 777–780 CrossRef CAS PubMed.
- P. B. Fernandes, Quinolones: Proceedings of an International Telesymposium, Prous Science Publisher, Bracelona, 1989 Search PubMed.
- M. E. Tepedino, W. H. Heller, D. W. Usner, L. S. Brunner, T. W. Morris, W. Haas, M. R. Paterno and T. L. Comstock, Curr. Med. Res. Opin., 2009, 25, 1159–1169 CrossRef CAS PubMed.
- S. C. Lal, S. Amit, K. Sokindra and D. K. Majumdar, J. Drug Delivery Ther., 2014, 4, 39–44 CAS.
- K. G. Kumar, P. Augustine, R. Poduval and S. John, Pharmazie, 2006, 61, 291–292 CAS.
- A. Radi, T. Wahdan, Z. Anwar and H. Mostafa, Electroanalysis, 2010, 22, 2665–2671 CrossRef CAS.
- A. Radi, T. Wahdan, Z. Anwar and H. Mostafa, Drug Test. Anal., 2010, 2, 397–400 CrossRef CAS PubMed.
- S. Jain, N. K. Jain and K. S. Pitre, J. Pharm. Biomed. Anal., 2002, 29, 795–801 CrossRef CAS PubMed.
- M. A. EL-Ries, A. A. Wassel, N. T. Abdel-Ghani and M. A. El-Shall, Anal. Sci., 2005, 12, 1249–1254 CrossRef.
- D. Kowalczuk, H. Hopkaa and R. Pietre, Chem. Anal., 2004, 49, 201–211 CAS.
- R. Singh, A. Pathak and P. Chawla, Indian J. Pharm. Biol. Res., 2013, 1, 95–101 CAS.
- G. Nirupa and U. M. Tripathi, Int. J. Res. Pharm. Biomed. Sci., 2013, 4, 27–36 CAS.
- K. B. Desai, M. A. Patel, P. K. Pradhan, S. Dey and D. U. M. Upadhyay, Asian J. Pharmaceut. Res. Dev., 2013, 1, 55–62 Search PubMed.
- M. M. Sebaiy, A. A. El-Shanawany, S. M. El-Adl, L. M. Abdel-Aziz and H. A. Hashem, Asian J. Pharm. Res., 2011, 1, 119–125 Search PubMed.
- Y. L. Feng, Anal. Lett., 2001, 34, 2693–2700 CrossRef CAS.
- S. S. Panchumrathy, D. R. Garikapati and G. R. Padala, J. Chem. Pharm. Sci., 2013, 6, 120–133 Search PubMed.
- M. M. Sebaiy, A. A. El-Shanawany, S. M. El-Adl and L. M. Abdel-Aziz, Asian J. Pharm. Sci., 2011, 1, 131–139 Search PubMed.
- A. Srikar, K. P. Channabasavaraj, G. Dharmamoorty, N. Valmiki, C. Chinnappa and T. V. Babu, J. Pharm. Sci. Res., 2009, 2, 13–15 Search PubMed.
- J. Shah, M. R. Jan, Inayatullah and S. Shah, J. Mex. Chem. Soc., 2012, 56, 109–114 CAS.
- P. Kamlesh, R. Badmanaban and C. N. Patel, J. Chem. Pharm. Res., 2010, 2, 528–532 Search PubMed.
- S. S. Parimala, P. A. Jyothi and K. Tejaswi, International Journal of Innovative Pharmaceutical Sciences and Research, 2013, 24, 306–309 Search PubMed.
- A. Srikar, D. Swapna, G. Swathi, I. Swapna and D. Sucharitha, Int. J. Pharm. Technol., 2010, 2, 16–22 CAS.
- M. S. Arayne, N. Sultana and S. N. Ali, Med. Chem., 2013, 3, 271–275 CAS.
- N. Sreekanth, B. Z. Awen and C. B. Rao, Res. J. Pharm., Biol. Chem. Sci., 2010, 1, 9–13 CAS.
- G. A. Saleh, H. F. Askal, I. H. Refaat and F. A. M. Abdel-aal, Asian J. Biomed. Pharm. Sci., 2014, 4, 39–49 CAS.
- J. Al-Mustafa and A. Shinar, Jordan J. Chem., 2013, 8, 237–246 CAS.
- M. C. N. Costa, A. T. Barden, J. M. M. Andrade, T. P. Oppe and E. E. S. Schapova, Talanta, 2014, 119, 367–374 CrossRef CAS PubMed.
- D. R. Arnold, C. P. Granvil, K. W. Ward and J. W. Proksch, J. Chromatogr. B: Anal. Technol. Biomed. Life Sci., 2008, 867, 105–110 CrossRef CAS PubMed.
- Z. Wang, S. Wang, F. Zhu, Z. Chen, L. Yu and S. Zeng, Chirality, 2012, 24, 526–531 CrossRef CAS PubMed.
- G. Torkildsen, J. W. Proksch, A. Shapiro, S. K. Lynch and T. L. Comstock, Clin. Ophthalmol., 2010, 4, 331–341 CAS.
- A. M. Badawy, A. K. Attiaa, A. E. Abd-Elaleem, M. M. Abd-Elmoety and S. G. Abd-Elhamid, Int. J. Pharm. Anal., 2015, 40, 1254–1268 Search PubMed.
- S. Kumar, M. Kumar, D. K. Majumdar, P. K. Sharma, C. L. Singh and A. Singh, Indian J. Pharm. Sci., 2015, 77, 399–404 CrossRef.
- H. M. Ahmed, M. A. Mohamed and W. M. Salem, Anal. Methods, 2015, 7, 581–589 RSC.
- S. Akella and C. K. Mitra, Indian J. Biochem. Biophys., 2007, 44, 82–87 CAS.
- Y. Gao, T. Sun, C. Yang and B. Zhou, Int. J. Electrochem. Sci., 2015, 10, 3230–3235 CAS.
- R. A. Farghali and R. A. Ahmed, Int. J. Electrochem. Sci., 2015, 10, 1494–1505 CAS.
- N. F. Atta, A. Galal, A. A. Wassel and A. H. Ibrahim, Int. J. Electrochem. Sci., 2012, 7, 10501–10518 CAS.
- A. K. Attia, M. M. Abd-Elmoety, A. M. Badawy, A. E. Abd-Elaleemand and S. G. Abd-Elhamid, Anal. Bioanal. Chem., 2014, 1, 128–138 Search PubMed.
- N. F. Atta, A. Galal and S. M. Azab, Int. J. Electrochem. Sci., 2011, 6, 5082–5096 CAS.
- P. H. Rieger, Electrochemistry, Prentice-Hall International, New Jersey, 1987 Search PubMed.
- J. F. Rusling, Colloids Surf., A, 1997, 123, 81–88 CrossRef.
- N. F. Atta, A. Galal, F. M. Abu-Attia and S. M. Azab, Electrochim. Acta, 2011, 56, 2510–2517 CrossRef CAS.
- D. K. Gosser, Cyclic Voltammetry: Simulation and Analysis of Reaction Mechanism, VCH, New York, 1993 Search PubMed.
- E. Laviron, J. Electroanal. Chem. Interfacial Electrochem., 1979, 101, 19–28 CrossRef CAS.
- A. J. Bard and L. R. Faulkner, Electrochemical Methods: Fundamentals and Applications, Wiley, New York, 2nd edn, 2001 Search PubMed.
- M. Y. Lachapelle and G. Drouin, Genetica, 2010, 139, 199–207 CrossRef PubMed.
- J. Premkumar and S. B. Khoo, J. Electroanal. Chem., 2005, 576, 105–112 CrossRef CAS.
- C. R. Raj, F. Kitamura and T. Ohsaka, Analyst, 2002, 9, 1155–1158 RSC.
- C. M. Anthony, M. D. Osselton and B. Widdop, Clark's Analysis of Drugs and Poisons, Pharmaceutical Press, London, 3rd edn, 2004 Search PubMed.
- J. Li and X. Q. Lin, Anal. Chim. Acta, 2007, 596, 222–230 CrossRef CAS PubMed.
- S. A. John, J. Electroanal. Chem., 2005, 579, 249–256 CrossRef CAS.
- ICH Trapartite Guideline, validation of analytical procedures: text and methodology, 2005, Q2 (R1), 1–13, http://www.ich.org/cache/compo/276-254-1.html, Accessed: November 12, 2011.
Footnote |
| † Electronic supplementary information (ESI) available. See DOI: 10.1039/c6ra04851j |
| This journal is © The Royal Society of Chemistry 2016 |

