DOI:
10.1039/C6RA04766A
(Paper)
RSC Adv., 2016,
6, 28316-28321
Photoluminescence study of oleic acid capped and hexanoic acid washed CdS quantum dots
Received
23rd February 2016
, Accepted 9th March 2016
First published on 11th March 2016
Abstract
The effects of oxygenic versus oxygen-free environment on the excitonic and defect emission of colloidal oleic acid (OA) capped and hexanoic acid washed CdS quantum dots (QDs) were studied using continuous photoluminescence (PL) measurements. In vacuum (∼10−3 mbar) OA capped CdS show 90% and 30% quenching of excitonic and defect emission intensity, respectively, whereas acid washed samples show 80% excitonic and 78% defect emission intensity quenching. It is also observed that the excitonic and defect emission intensities are fully recovered in air on cycling the air/vacuum pressure cycles. Our analysis suggests that due to high non-radiative recombination, both excitonic as well as defect emission intensity quenches. The low temperature PL study clearly shows that the enhancement in defect emission intensity for acid washed QDs is about three times higher than that of OA capped QDs, which is due to suppression of non-radiative recombination. Our work shows that emission can be controlled by modulating the degree of passivation ether by acid washing process or controlling the air/vacuum environment or both.
I Introduction
Over the past decade the quantum dots of II–VI compound semiconductors such as CdX (X = S, Se, Te) synthesized as colloids have provoked enormous interest in the fields of science and engineering because of their distinctive size-dependent optical, electronic, magnetic, and electrochemical properties.1–6 The optical and electronic properties of QDs are sensitive to the size and nature of the particle surface. For example photoluminescence (PL) emission strangely depend on the size, shape and environment.7–11 The most interesting characteristics in CdS, CdSe and CdTe quantum dots are their optical properties (absorption and photoluminescence), which are very keen to surface interactions in these materials. Although, the effect of particle surface and interaction between surface and environment on the emission properties is not completely known, but the luminescence quantum yield (QY) strongly dependent on one key parameter is the degree of surface passivation. Furthermore, surface passivation is even more crucial in quantum dot solids/films, where inter-dot coupling reduces the QY of the film by over a factor of 10 relative to that of the colloid.8,12 The role of ligand and solvent on emission properties and charge transport properties has been reported by different groups.7,13,14 Chou et al. reported the effect of ligends on the emission properties of CdS and CdSe QDs.15 They observed that the PL emission peak positions of the modified CdSe nanocrystals have blue shifted for n-butylamine, n-hexylamine and oleic acid capping molecules. However, the PL quantum yield of the CdSe nanocrystals increased after introduction of the alkylamine molecules, but decreased with oleic acid and PL QY of the CdS QDs decreased after introduction of the all above molecules. The detailed mechanism was not clear until now.15,16
Jang et al. observed a 50-fold increment of PL QY of CdSe NC solutions treated with sodium borohydride17 and Petruska et al. reported that PL QY increased upon addition of decanoic acid to chloroform solutions of CdSe NCs.18 The ligand exchange shows diverse/mixed effects on the optical properties. For example, exchanges involving n-butylamine produced varied effects: for CdSe NCs of 3.2 nm core size no shifts occurred in absorption or PL spectra and PL QY decreased, whereas for 1–2 nm core CdSe NCs displayed a blue-shifted (440 to 414 nm) and increased band edge absorbance.19–21 Yu et al. observed that the band edge absorbance coefficients of TOPO, thiol, and pyridine capped CdSe NCs are equal within experimental error22 and Shmelz et al. reported that the PL of TOPO capped CdSe/ZnS and CdSe NCs vanishes upon exchange with 1,12-diazaperylene.23
In previous work, the effect of environment conditions like ligand, solvent, water etc. on the PL properties of passivated CdSe quantum dots has been reported also nobody has described the effect of external environment of the defect emission properties.
However, effect of hexanoic acid treatment on the photoluminescence in solution and film is not reported yet. In this work, we are reporting the PL properties of (passivated OA capped) and unpassivated (hexanoic acid washed) CdS QDs in solution and films. We have investigated how excitonic and defect emission properties changes after acid washing and with atmospheric conditions. The reason why we chose the hexanoic washing process because it removes the insulation capping ligand, which improves the charge transport properties and can be applied for device fabrication like QD based solar cell and laser, LEDs etc.14,24
II Experimental
Synthesis of CdS QDs
We synthesized CdS QDs using a variation of the procedure, as previously reported elsewhere.13 Specifically, cadmium stock solution was produced by mixing CdO (320 mg) with OA (8 ml) and octadecene (ODE) (50 ml) in a three-neck flask. The mixture was heated to 290 °C under nitrogen flow under stirring. The sulfur solution was prepared separately, by heating sulfur powder (80 mg) in ODE (10 ml) at 250 °C in a three-neck flask under nitrogen flow under stirring. Both the mixtures were heated until the solution became colourless. The sulfur solution was quickly injected into the cadmium solution at 290 °C. Subsequently, the temperature was cooled to 260 °C for growing CdS QDs. After a 5 min, the mixture was cooled again to room temperature and the particles were precipitated with 2-propanol. The resulting CdS QDs were purified several times by using the 2-propanol/hexane technique and mixture was centrifuged for 10 min to get CdS QDs.
Hexanoic acid washing
To remove the oleic acid capping the hexanoic acid-assisted washing procedure was done according to Zhou et al.24 briefly 20 mg CdS QDs were dispersed in 15 ml hexanoic acid and heated to 100 °C for 10 min subsequently precipitated by the 2.0 ml chloroform and 10 ml 2-propanol. The acid treated QDs were collected by centrifuging solution at 5000 rpm. The QDs were finally dispersed in chlorobenzene and placed in the dark for storage. The hexanoic acids treated QDs and as synthesized QDs are called as unpassivated and passivated QDs, respectively.
Characterization and measurements
The TECNAI G2T30 high resolution transmission electron microscope was used for imaging and direct determination of the nanocrystal size. A Perkin Elmer Lamda-1050 UV-Vis-NIR spectrophotometer and ISS PC1 spectrofluorometer were used to study the absorption and PL, respectively. The X-ray diffraction patterns were obtained with Phillips X'PERT PRO system. The quantum yield (QYs) were determined by comparing the integrated emission from QDs to that from the rodamine B with an excitation of 375 nm, keeping the optical densities of the samples and reference solutions nearly ∼0.1–0.15. For low temperature PL study QDs from chlorobenzene solution were spin coated at 1200 rpm on the cleaned quartz substrate and dried in vacuum oven at 50 °C for 10 min. For low temperature PL measurement samples were mounted on the cold finger of the cryostat which has four quartz windows. The illumination source is light from a laser (75 W) 375 nm excitation. The laser spot was about ∼200 μm in diameter.
III Results and discussion
Structural and morphological studies
The TEM images of as prepared CdS QDs are shown in Fig. 1. The CdS QDs appears dark on bright field image with average size of ∼3.8 nm. The lattice spacing of 3.5 Å for (111) planes (Fig. 1(b)) is observed confirms zinc-blende crystal structure. Fig. 2 shows the XRD pattern of as prepared and hexanoic acid washed CdS QDs. The presence of broad peaks confirms the nano size of the prepared nanoparticles. The three peaks observed in at 2θ values of 26.4°, 30.6°, 43.8°, and 51.9° were found to correspond to the three crystal planes of (111), (200), (220), and (311), indicating zinc-blende structure of CdS which matches well with JCPDS 89-0440. The average particle size obtained from Debye Scherrer formula is ∼4 nm, which is also verified with TEM results and there is no any effect on particles size on hexanoic acid washing.
 |
| Fig. 1 TEM images of as prepared CdS quantum dots. (a) Low resolution, (b) high resolution. | |
 |
| Fig. 2 X-ray diffraction patterns of CdS QDs. (a) OA capped and (b) hexanoic acid washed. | |
Absorption and photoluminescence studies
The normalized absorption and photoluminescence spectra of OA capped and acid washed QD samples in chlorobenzene are shown in Fig. 3. Multiple absorption peaks, which originate from the ground state and from the higher excited states of excitons in the CdS QDs are observed clearly which shows the effect of quantum confinement. The sharp first absorption peak at ∼426 nm and corresponding sharp photoluminescence emission with FWMH of ∼20 nm reveals a narrow size distribution of the as prepared CdS QDs. The first absorption peak (blue curve) of acid washed CdS QDs is red shifted by 5 nm this may be due to aggregation and showing scattering in long wavelength side.
 |
| Fig. 3 Absorption and photoluminescence spectra. (a) Absorbance of OA capped and acid washed CdS QDs in chlorobenzene solution. (b) Photoluminescence in chlorobenzene solution. | |
The photoluminescence shows the two peaks assigned as band-edge emission at 444 nm and display a broad emission band between 500–750 nm called defect emission arises from the recombination via deep-trap states or surface localized states.13 The photoluminescence of acid washed QDs is quenched due to the emergence of large number of defect states. The Stokes shift of ∼0.12 eV between absorption and emission spectra can be attributed to the optically forbidden transition of the ground exciton (“dark exciton”), separated from the first optically active state by the e–h exchange interaction.25,26
Influence of air/vacuum on photoluminescence
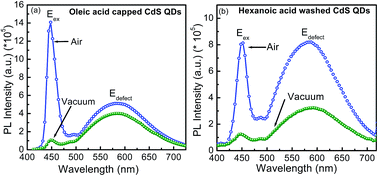
The influence of air/vacuum on the excitonic and defect emission is studied by measuring PL of OA capped and acid washed CdS QDs films. For this study the thin film samples were mounted on the cold finger of cryostat and the cryostat chamber was evacuated by rotary pump. The samples were excited by 375 nm laser source and PL signals were recorded by spectrofluorometer setup. First, PL signal was recorded in air and then vacuum of ∼10−3 mbar. Fig. 4 illustrates the PL spectra of OA capped and acid washed QDs films in air and vacuum. The PL spectra show excitonic and defect emission peaks in air and vacuum but the intensity of both peaks falls in vacuum. It is observed that for OA capped CdS QD film the excitonic emission intensity at λmax at 445 nm quenches by 7 times in vacuum (Fig. 4(a)), where for acid washed CdS QDs film the excitonic emission quenched by ∼3 times (Fig. 4(b)). On the other hand for acid washed QDs defect emission intensity (at 585 nm) fall by 3 times where for OA capped sample fall in intensity is only 30%. The excitonic and defect emission intensity fully recovered to its initial intensity as cryostat vented with air. These observations clearly proved that the enhancement in the PL intensity in air originated from the passivation of surface traps by oxygen. Since acid washed QDs have more trap levels than that of OA capped QDs so the enhancement in defect emission is more.
 |
| Fig. 4 Photoluminescence spectra of CdS QDs films in air and vacuum. (a) PL spectra of OA capped QDs films is air and vacuum. (b) PL spectra of acid washed QDs films is air and vacuum. | |
The results indicated that after acid washing excitonic and defect emission intensity of CdS QDs in solution drastically quenched. On the other hand the QDs films shows quenching in excitonic and defect emission intensity (integrated intensity) in vacuum for both OA capped and acid washed samples as shown in Table 1. The acid washed sample show 80% excitonic and 78% defect emission intensity quenching in vacuum (∼10−3 mbar), while OA capped sample shows 90% and 30% quenching of excitonic and defect emission intensity, respectively.
Table 1 Effect of air/vacuum on the excitonic and defect emission intensity for OA capped and acid washed CdS QDs filmsa
Sample name |
IEx (a.u.) |
IDe (a.u.) |
ITotal (a.u.) |
IQEx (%) |
IQde (%) |
Where, IEx – integrated excitonic band emission intensity, IDe – integrated defect emission band intensity, ITotal – total (excitonic + defect) emission intensity, IQEx – excitonic emission intensity quenching in vacuum, IQde – defect emission intensity quenching in vacuum. |
CdS OA (air) |
3.3 × 10⁷ |
7.3 × 10⁷ |
10.7 × 10⁷ |
|
|
CdS OA (vac.) |
0.32 × 10⁷ |
5.7 × 10⁷ |
5.98 × 10⁷ |
90 |
30 |
CdS acid washed (air) |
2.3 × 10⁷ |
13 × 107 |
14.6 × 10⁷ |
|
|
CdS acid washed (vac.) |
0.49 × 10⁷ |
4.9 × 10⁷ |
5.55 × 10⁷ |
78 |
70 |
To know how quick oxygen enhances the emission intensity, we investigated the emission properties by air/vacuum pressure cycles as shown in Fig. 5. The air/vacuum pressure cycles tell us how PL intensity decreases in the progression of vacuum and how quick increase on sudden venting the chamber. For this study, the PL intensity was monitored as function of time with evacuation and air exposure after sudden venting process. Fig. 5 shows the PL evolution of OA capped and acid washed QDs samples for long and short pressure cycles. Fig. 5(a) (blue line) shows fall in excitonic emission intensity at 445 nm of OA capped QDs during evacuation for 400 s and rises after sudden exposure to air. For short pressure cycles sudden fall and rise in PL intensify give spike like look in the intensity graph (red line). Fig. 5(b) shows the variation in defect emission intensity of OA capped QDs during the air/vacuum pressure cycle. The fall in defect emission intensity is slow than exciton emission intensity fall but after sudden exposure to air rise in intensity as very fast with 30 s it achieves its initial value. Fig. 5(c) and (d) shows the excitonic and defect emission intensity evolution of acid washed QDs with pressure cycles, respectively.
 |
| Fig. 5 Evolution of excitonic and defect emission intensity with air/vacuum pressure cycling. (a) Effect of long (blue line) and short time (red line) pressure cycling on the excitonic emission intensity (at 445 nm) of OA capped QDs film. (b) Effect of long (blue line) and short time (red line) pressure cycling on the defect emission intensity (at 584 nm) of OA capped QDs film. (c) Effect of long (blue line) and short time (red line) pressure cycling on the excitonic emission intensity (at 448 nm) of acid washed sample. (d) Effect of long (blue line) and short time (red line) pressure cycling on the defect emission intensity (at 585 nm) of acid washed sample. Pressure is cycled by (F) filling for 60 s and (b) evacuating for 60 s. Both exciton and defect emission intensity increases for each high pressure cycle and decreases for each low-pressure cycle. | |
The defect emission shows same behaviour as exciton emission but the fall in defect emission intensity takes at slower but rises as faster than exciton emission reaches to its initial value within ∼100 s (from 500 to 600 s). This observation shows that the defect emission recovers it initial intensity before the exciton emission. For acid washed CdS QDs films the observations are slightly different Fig. 5(c) shows the excitonic emission falls faster but recovers slowly on air exposure. The defect emission intensity also takes time (500 s) to achieve its initial value on exposure to air. While, for short pressure cycles upto 8 cycles the recovery in excitonic and defect emission is better.
The enhanced PL intensity in air suggests that the surface traps of QDs are passivated by oxygen molecules. The surface defects of Cd or S and dangling bonds can introduce trap states with energies that are within the bandgap of the CdS. The adsorbed oxygen may interact with these surface states, which are directly involved in the nonradioactive recombination of the photogenerated charge carriers.6,27 If the surface defects are removed by the oxygen, then the nonradioactive recombination should decrease, enhancing the emission intensity. The enhancement of PL intensity in air is explained by the physisorbtion on oxygen on the QD surface. During the evacuation of air the physisorbed interaction can be eliminated, increases the defect states and reduces the excitonic emission intensity but defect emission intensity is reduced may be due to increase in nonradioactive recombination. Moreover, refilling with air recovered the PL emission, indicating that the PL enhancement is a reversible effect and the oxygen passivation of surface states should be attributed to the physisorbed interaction. The above fact is proved by PL properties of the acid washed QDs. The acid washed QDs have unpassivated surfaces, so in this case the interaction between oxygen and surface states will be more, which will results big change in PL intensities. The similar observations are observed as presented in the Fig. 4 and 5. For OA capped CdS QDs, enhance in PL intensity (integrated) with respect to vacuum is ∼4.7 × 10⁷ and for acid washed QDs ∼9.3 × 10⁷ which is about two time higher. The previous studies have reported dramatic enhancement of the fluorescence intensity of CdSe QDs,28 CdSe/ZnS QDs29 CdSe terapods30 upon exposure to air. In all these studies, effect of air on defect emission is not described yet. Our results are consistent with these reports; in addition defect emission is described elaborately in this study.
Effect of low temperature on PL properties
The enhancement in defect emission intensity is supported by measuring temperature dependent PL. Fig. 6 shows the temperature dependence of the PL of the passivated and unpassivated CdS quantum dot films in vacuum condition (∼10−3 mbar). We noted that for passivated QDs (Fig. 6(a)) the intensity of the excitonic emission at room temperature was almost half-that at 10 K, which means that the thermal quenching effect is very small. The above results demonstrates that the non-radiative process is suppressed in the OA capped CdS QDs compared to the acid wash QDs. The non-radiative transitions caused by defects states are suppressed at low temperature, which enhances the emission intensity.
 |
| Fig. 6 Temperature dependent photoluminescence spectra CdS QDs film samples. (a) Temperature dependent photoluminescence spectra of OA capped QDs film. (b) Temperature dependent photoluminescence spectra of acid washed QDs film. | |
As temperature decreases both excitonic and defect emission gains emission intensity, the excitonic emission does not gain intensity at the expense of the defect emission. Thus, it is unexpected that the excitonic emission is strengthened by the defect emission. The excitonic emission shows a monotonic blue shift and simultaneous line narrowing as the temperature decreases. The temperature dependence of the PL peak position can be well described for T < 220 K by following phenomenological expression. This relation was introduced by Varshni,31
|
 | (1) |
where,
Eg, is the band gap which may be direct (
Egd) or indirect (
Egi),
E0 is its value at 0 K, and
α and
β are constants.
At 10 K, the blue-shift is as large as 70 meV, and the line width of the band-edge emission is only ∼80 meV.
IV Conclusions
In summary, excitonic and defect photoluminescence of OA capped and hexanoic acid washed CdS QDs was studied in different air/vacuum conditions. The results indicated that after acid washing excitonic and defect emission intensity of CdS QDs in solution drastically quenched. On the other hand the QDs films shows quenching in excitonic and defect emission intensity (integrated intensity) in vacuum for both OA capped and acid washed samples as shown in Table 1. The acid washed sample show 80% excitonic and 78% defect emission intensity quenching in vacuum (∼10−3 mbar), while OA capped sample shows 90% and 30% quenching of excitonic and defect emission intensity, respectively. In acid washed QDs defect emission quenched strongly because it consist large no of surface defects which is further proved by temperature dependent PL measurement. At low temperature enhancement in defect emission intensity for acid washed QDs is about three times higher that OA capped QDs. In conclusion, we can say that the emission properties QDs can be tuned by acid washing process as well as by controlling the environment. Our analysis can be useful for tuning the PL properties of other QDs and materials.
Acknowledgements
This research work was performed under the project “Design and Fabrication of Organic Solar Cells using Organic-Inorganic Hybrid Absorber” sponsored by the Ministry of New and Renewable Energy (MNRE), India.
References
- M. G. Bawendi, M. L. Steigerwald and L. E. Brus, Annu. Rev. Phys. Chem., 1990, 41, 477 CrossRef CAS.
- M. Nirmal, B. O. Dabbousi, M. G. Bawendi, J. J. Macklin, J. K. Trautman, T. D. Harris and L. E. Brus, Nature, 1996, 383, 802 CrossRef CAS.
- M. G. Bawendi, P. J. Carroll, W. L. Wilson and L. E. Brus, J. Chem. Phys., 1992, 96, 946 CrossRef CAS.
- J. Tittel, W. Gohde, F. Koberling, T. Basche, A. Kornowski, H. Weller and A. Eychmuller, J. Phys. Chem. B, 1997, 101, 3013 CrossRef CAS.
- J. R. Heath, Science, 1995, 270, 1315 CrossRef CAS.
- J. E. B. Katari, V. L. Colvin and A. P. Alivisatos, J. Phys. Chem., 1994, 98, 4109 CrossRef CAS.
- G. Kalyuzhny and R. W. Murray, J. Phys. Chem. B, 2005, 109, 7012 CrossRef CAS PubMed.
- S. R. Cordero, P. J. Carson, R. A. Estabrook, G. F. Strouse and S. K. Buratto, J. Phys. Chem. B, 2000, 104, 12137 CrossRef CAS.
- N. Myung, Y. Bae and A. J. Bard, Nano Lett., 2000, 3, 747 CrossRef.
- X. Peng, M. C. Schlamp, A. V. Kadavanich and A. P. Alivisatos, J. Am. Chem. Soc., 1997, 119, 7019 CrossRef CAS.
- M. Bruchez, M. Moronne, P. Gin, S. Weiss and A. P. Alivisatos, Science, 1998, 281, 2013 CrossRef CAS PubMed.
- B. O. Dabbousi, C. B. Murray, M. F. Rubner and M. G. Bawendi, Chem. Mater., 1994, 6, 216 CrossRef CAS.
- F. Zezza, R. Comparelli, M. Striccoli, M. L. Curri, R. Tommasic, A. Agostiano and M. D. Monica, Synthetic Metals, 2003, 139, 597 CrossRef CAS.
- A. J. Moul, L. Chang, C. Thambidurai, R. Vidu and P. Stroeve, J. Mater. Chem., 2012, 22, 2351 RSC.
- H. L. Chou, C. H. Tseng, K. C. Pillai, B. J. Hwang and L. Y. Chen, Nanoscale, 2010, 2, 2679–2684 RSC.
- H. L. Chou, C. H. Tseng, K. C. Pillai, B. J. Hwang and L.-Y. Chen, J. Phys. Chem. C, 2011, 115, 20856 CAS.
- E. Jang, S. Jun, Y. S. Chung and L. S. Pu, J. Phys. Chem. B, 2004, 108, 4597 CrossRef CAS.
- M. A. Petruska, A. P. Bartko and V. I. J. Klimov, Am. Chem. Soc., 2004, 126, 714 CrossRef CAS PubMed.
- M. A. El-Sayed, Acc. Chem. Res., 2004, 37, 326 CrossRef CAS PubMed.
- C. Landes and M. A. El-Sayed, J. Phys. Chem. A, 2002, 106, 7621 CrossRef CAS.
- C. Landes, M. Braun, C. Burda and M. A. El-Sayed, Nano Lett., 2001, 1, 667 CrossRef CAS.
- W. W. Yu, L. H. Qu, W. Z. Guo and X. G. Peng, Chem. Mater., 2003, 15, 2854–2860 CrossRef CAS.
- O. Schmelz, A. Mews, T. Basche, A. Herrmann and K. Mullen, Langmuir, 2001, 17, 2861 CrossRef CAS.
- Y. Zhou, F. S. Riehle, Y. Yuan, H. F. Schleiermacher, M. Niggemann, G. A. Urban and M. Krüger, Appl. Phys. Lett., 2010, 96, 1 Search PubMed.
- J. Li and J. B. Xia, Phys. Rev. B: Condens. Matter Mater. Phys., 2000, 62, 12613 CrossRef CAS.
- D. Kim, T. Mishima, K. Tomihira and M. Nakayama, J. Phys. Chem. C, 2008, 112, 10668 CAS.
- M. Jones, J. Nedeljkovic, R. J. Ellingson, A. J. Nozik and G. Rumbles, J. Phys. Chem. B, 2003, 107, 11346 CrossRef CAS.
- J. Müller, J. M. Lupton, A. L. Rogach, J. Feldmann, D. V. Talapin and H. Weller, Appl. Phys. Lett., 2004, 85, 381 CrossRef.
- G. W. Shu, W. Z. Lee, I. J. Shu, J. L. Shen, J. C. An Lin, W. H. Chang, R. C. Ruaan and W. C. Chou, IEEE Trans. Nanotechnol., 2005, 4, 632 CrossRef.
- L. Zhao, Q. Pang, S. Yang, W. Ge and J. Wang, Appl. Phys. A, 2011, 103, 279 CrossRef CAS.
- Y. P. Varshni, Physica, 1967, 34, 149 CrossRef CAS.
|
This journal is © The Royal Society of Chemistry 2016 |
Click here to see how this site uses Cookies. View our privacy policy here.