Fabrication of an EGF modified nanodiamonds-based anti-cancer drug targeted delivery system and drug carrier uptake visualization by 3D Raman microscopy†
Xin Chenabc,
Dandan Liac,
Hong Wangb,
Yuan-yuan Jiaod,
Hao Wange,
Yuan Yu*a and
Jinfang Zhi*a
aKey Laboratory of Photochemical Conversion and Optoelectronic Materials, Technical Institute of Physics and Chemistry, Chinese Academy of Sciences, Beijing 100190, P. R. China. E-mail: yyu@mail.ipc.ac.cn; Zhi-mail@mail.ipc.ac.cn
bDepartment of Pharmaceutical Analysis, School of Pharmaceutical Sciences, Peking University, Beijing 100191, P. R. China
cUniversity of Chinese Academy of Sciences, Beijing 100190, P. R. China
dDepartment of Pharmacy, Peking University Cancer Hospital & Institute, Beijing, 100142, P. R. China
eDepartment of Radiation Oncology, Peking University Third Hospital, Beijing 100191, P. R. China
First published on 25th April 2016
Abstract
A nanodiamonds-based anti-cancer drug targeted delivery system, Epidermal Growth Factor (EGF)–nanodiamonds (NDs)–cisplatin (ENC) bioconjugate was developed. Due to the effect of the specific biorecognition process of EGF (a kind of targeting molecule), human liver hepatocellular carcinoma (HepG2) cells could be selectively killed by the ENC system, even in a lower concentration of the cisplatin (a kind of anti-cancer drug) comparing to the traditional drug therapy. The cytotoxicity of ENC could be blocked by EGFR antibody in cancer cells, revealing the specificity of its targeting ability. Because the morphological change of HepG2 cells treated by ENC was observed, from epithelial to mesenchymal-like shape, the related mechanism was evaluated. The results showed that E-cadherin expression declined after ENC treatment, while vimentin expression did not change. The decrease of E-cadherin expression means the loss of cell–cell adhesion. Loose cells provided more specific surface area for drug absorption. Based on these advantages, ENC delivery system would be a promising targeting drug delivery system. Moreover, we located the spatial distribution of ENC system in cells by using the NDs existing in ENC as Raman probe through 3-dimensional (3D) confocal Raman imaging, i.e., we were able to visualize the process of uptake of ENC into living cancer cells, which is helpful to observe the specific biorecognition process between EGF and its receptor (EGFR) in a physiology condition and the cellular uptake of ENC drug delivery system. The present study demonstrates that drug-loaded NDs have a potential as novel intravascular probes for both diagnostic (e.g., imaging) and therapeutic purposes (e.g., targeted drug delivery).
Introduction
Liver cancer is regarded as one of the most common malignant tumors and a major public health issue worldwide. Primary liver cancer is globally the second leading cause of cancer death.1 High rates of liver cancer occur where hepatitis B and C are common, especially in China.2 But surgical treatment for liver cancer suffers from a low curative resection and high recurrent metastasis ratio, while chemotherapeutic and radiotherapeutic drugs generally suffer from poor pharmacokinetics and inappropriate biodistribution.1 Obviously, due to the lack of specificity, those classical approaches generally do not meet patient's expectations, therefore, more highly targeted treatments are needed. Towards this aim, the nanoparticle-based drug targeted delivery systems have emerged as an indispensable platform for modern cancer therapy.1The concept of targeted drug delivery is attractive because it recapitulates some of the advantages of topical application of drugs, e.g., high local concentration and low systemic exposure. Nanoparticle technology offers an attractive platform for drug delivery.3–8 Through surface functionality, the anti-cancer drugs and targeting ligands were able to be anchored onto the surface of nanoparticles, forming targeted delivery systems. The resulting targeted delivery systems could carry the drugs to certain locations due to the effect of the targeting ligands, allowing for use of much lower overall concentrations of the drug compared to the traditional chemotherapy. With the decrease in the injected and freely available drug dose, the risk of adverse side effects, e.g. toxicity or immune system reaction, was lowered. However, regardless of the exciting platform for drug delivery of the nanoparticles, the actual application of nanoparticles in drug delivery still meets some challenges, including improving specificity and stability, regulating bioavailability, as well as developing lower toxicity carriers.9–11
Nanodiamonds (NDs) might be considered to be a very attractive nanoparticle to respond to these challenges because of their superior chemical stability, biocompatibility and drugs accommodating ability.12 A particularly promising approach for biomedical applications is that the NDs surface is usually rich in hydroxyl, carboxyl, which makes the functionalization and biomolecule immobilization easier to be realized on the NDs surface.13–21 Several previous reports have demonstrated in vitro and in vivo targeted of tumor cells with NDs.16,19,22–24 Our previous study has also suggested that NDs modified cisplatin were a new type of controlled-release system.25 Moreover, ND has a unique Raman peak at 1332 cm−1, which does not overlap with the Raman signals of cells, thus, we could locate the spatial distribution of the drugs in cells by using the NDs as Raman probes through a 3-dimensional (3D) confocal Raman imaging. Therefore, NDs is thought to have a potential as novel intravascular probes for therapeutic purposes (e.g., targeted drug delivery), and together with 3D confocal Raman imaging technology, NDs-based delivery system may open up exciting opportunities for targeting biomedical imaging, drug delivering and their visualization.
Generally, in order to realize anti-cancer drug targeted delivery, some targeting molecules that bind to antigens or receptors on cancer cells were used and conjugated with nanoparticles so as to enhance the targeting efficiency of nanoparticles to cancer cells or tumors. For example, the ανβ3 and ανβ5 integrins are highly expressed in tumor endothelium, and their level of expression may be highest in the vessels of the most malignant tumors.26 Enhanced drug delivery with vascular homing peptides has been accomplished using a cyclic peptide containing the integrin-binding RGD motif (CRGDC) to deliver doxorubicin to tumors.27 Besides, EGF (Epidermal Growth Factor), which plays important roles in tumor aggression and proliferation, is another potential targeting ligand due to the overexpression of the EGF receptor in human tumors.11,28
In the present study, we provide the first demonstration that targeted NDs anti-cancer drug delivery system, i.e., Epidermal Growth Factor (EGF)–nanodiamonds (NDs)–cisplatin (ENC) bioconjugate. As a guidance mechanism, the EGF makes the ENC system selectively targeting and killing the human liver hepatocellular carcinoma (HepG2) cells even in a lower overall concentrations of the cisplatin (a kind of anti-cancer drug) than the traditional drug delivery system. Moreover, confocal Raman microscopy technology was first used to investigate the cellular uptake of ENC in living HepG2 cells by using NDs as a Raman probe. We observed the obvious morphological change of HepG2 cells induced by ENC in this study. Although EGF is an attractive choice of targeting motif for cancer-selective delivery, as a growth factor, it also could stimulate cell growth, proliferation, and differentiation by binding to its receptor EGFR (epidermal growth factor receptor). Previous studies reported that EGF could induce similar morphological change and successive cell migration in some tumor cells.29 The recent studies have shown the increasing cancer cell migration could induce the tumor growth and the drug resistance during chemotherapy.30 Whether nanoparticles using EGF as target molecule (e.g., ENC) could induce cell migration is unknown. In this study, we found that ENC could not alter HepG2 cell migration ability. Furthermore, the related mechanism of morphological change induced by ENC need to be well investigated. Epithelial cells express high levels of E-cadherin, whereas mesenchymal cells express high levels of vimentin. Therefore, we investigated the related mechanism (mRNA level expression of E-cadherin and vimentin) for morphological change of HepG2 cells induced by ENC. The results demonstrated first that ENC could cause the loss of cell adhesion and the increase of the surface areas of cancer cells for drug absorption. Present results suggest that diagnostic (e.g., Raman imaging) and therapeutic purposes (e.g., targeted drug delivery) can be realized by using drug-loaded NDs as a carrier and sensitive probe.
Results and discussion
Characterization of ENC
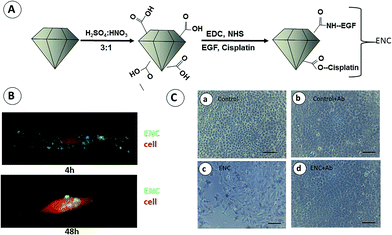
The illustration of ENC preparation was shown in Fig. 1A. The size and zeta potential distribution graph of NDs–cisplatin (NC) and EGF modified NDs–cisplatin (ENC) were shown in Fig. 1B and Table 1. We made a comparison of nanodiamonds, NC, EGF–NDs, and ENC on particle size, zeta potential and their Raman spectra in Fig. S2 and Table S1.† As can be seen in Fig. 1B, after modifying by EGF, the particle intensity mean size of the ENC complexes increased from 207.5 nm to 253.1 nm, suggesting that the EGF has been loaded on the surface of the NDs. The data in Table 1 showed the zeta potentials of ND-based drug-delivery systems changed significantly after EGF conjugation. The apparent difference in zeta potential between ENC and NC implies an interaction between NC and EGF (positively charged), and the EGF conjugation efficiency was 23.6 ± 3.2 μg/100 μg NDs under our experimental conditions. The Table 1 also showed that the drug loading efficiencies for cisplatin loaded with NC and ENC were about 0.9 ± 0.4 and 1.0 ± 0.4/100 μg NDs, suggesting no significantly difference between them.| Formulation | Zeta potential (mV) | Drug loading efficiency (cisplatin, μg/100 μg NDs) | Conjugation efficiency (EGF, μg/100 μg NDs) |
|---|---|---|---|
| NC | −20.7 ± 2.5 | 0.9 ± 0.4 | |
| ENC | −15.9 ± 2.3 | 1.0 ± 0.4 | 23.6 ± 3.2 |
In vitro cellular uptake
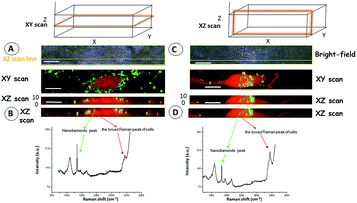
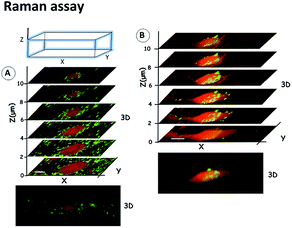
To evaluate the drug delivery capabilities of ENC, the uptake process of ENC was analyzed by confocal Raman microscopy, the XY, XZ and 3D Raman scanning were carried out to get a direct information about the interaction between ENC and HepG2 cells, the results were shown in Fig. 2 and 3. As observed in Fig. 2, the Raman peaks of 1332 cm−1 and 2900 cm−1 corresponded to NDs and HepG2 cells, respectively, and the both Raman signals in same site were isolated relatively and represented clear evidence of the presence of NDs position in the cells. When the cells were incubated with ENC for 4 h (A and B in Fig. 2, A in Fig. 3), large amount of ENC (partially aggregated) were found at the periphery of the cells around the cell membrane in XY and XZ confocal Raman profile due to the specific biorecognition between EGF and EGFR which exists in cell surface. However, after washed and recultured in DMEM medium without ENC for 48 h (C and D in Fig. 2, B in Fig. 3), the amount of ENC aggregated on the cell membrane decreased, and the majority of ENC penetrated well into the cell body. It can be observed that the ENC distribution in cells is not scattered throughout the cytoplasm, it is gathered in some areas of the cells and formed clusters in cells. From XZ confocal Raman profile (Fig. 2D), we could observe that the ENC had incorporated inside the HepG2 cells, that is, cellular imaging has verified that the EGF-targeted NDs drug delivery system, ENC bioconjugate, could effectively enter into the HepG2 cells. On the other hand, from the 3D confocal Raman spectroscopy (Fig. 3A and B), it displayed clearly that the absorbed and devoured processes of the EGF-targeted NDs drug delivery system by the HepG2 cells. The short-term bio-distribution and long-term bio-distribution experiments showed the ENC uptake by the cells contains two steps, i.e., due to the specific biorecognition between EGF and EGFR, the EGF-containing ENC were first attached on the surface of HepG2 cells due to the EGFR overexpressed effect, and then, the anchored ENC were devoured by the HepG2 cells (ESI Fig. S1†).Change in cell morphology
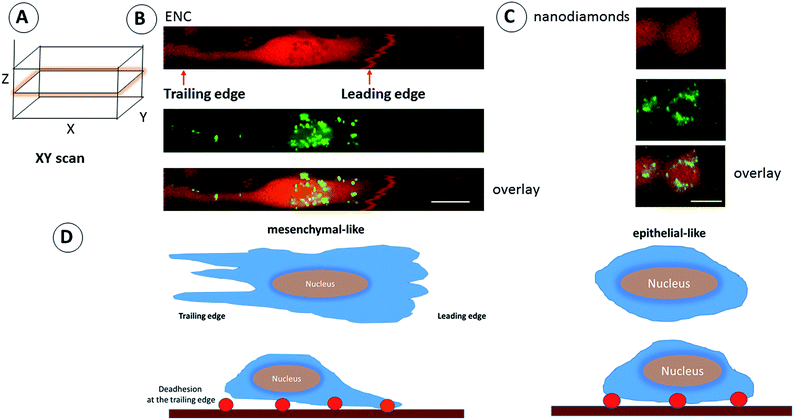
In order to find the significant morphological changes, we compare the Raman images of cells treated with nanodiamonds and ENC for 4 h, and these cells were both recultured for 48 h (Fig. 4). We can find the cell morphology is epithelial-like, when cells were treated with nanodiamonds (Fig. 4C). It is similar to HepG2 without any treatment. After the ENC treatment (Fig. 4B), the cell morphology changed obviously, from epithelial-like to mesenchymal-like. The cells treated with ENC had become longer than those without ENC treatment. Compare the Fig. 4C and B, we could find the big change in cell morphology caused by ENC. The change of cell morphology showed that cells can extended the leading edge (polarized in the direction of movement), and retracted their trailing edge (Fig. 4D).In vitro imaging studies verified that the EGFR-targeted NDs drug delivery system could effectively enter into the cancer cells. The as-developed ENC system combined with confocal Raman imaging technology clearly allows for the observation of NDs uptake by the cells and their intracellular distribution,31,32 thus providing a method to investigate fine details of NDs-drug-to-cell interactions, and their visualization, where the NDs were used as not only the drug carrier but also Raman probe. Furthermore, the new result of our present study is that the change in cell morphology after ENC treatment, which means the possibility of cell migration. The precise assessment of bio-distribution of ENC as well as their long-term cytotoxicity in vivo is currently under further evaluation in our laboratories.
In vitro cell viability assays
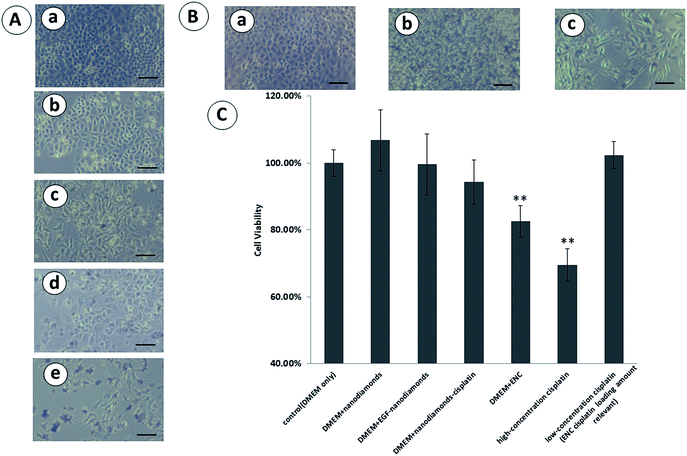
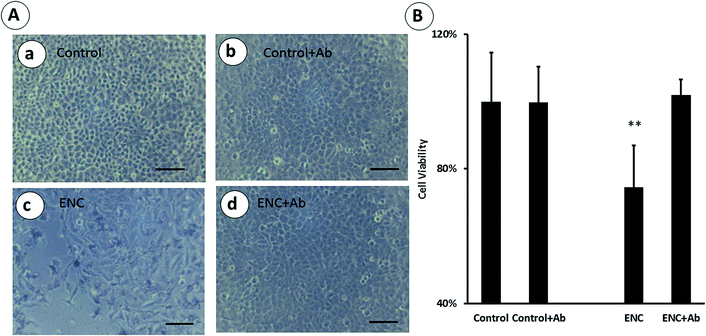
The cytotoxicity of the ENC was examined in HepG2 cells by CCK-8 assays and the results were shown in Fig. 4. No significant change in number between negative control (DMEM only), bare NDs treatment and NC treatment group was observed (Fig. 5Aa, b and d). However, the obvious morphological changes, from epithelial-like to mesenchymal-like, in EN (Fig. 5Ac) and ENC group (Fig. 5Ae) could be observed, showing that EGF could cause morphological change of HepG2 cells, and therefore might affect the migration of HepG2 cells. Fig. 5B showed optical micrographs of the killing process of HepG2 cells with ENC. Exponentially grown HepG2 cells adhered to the plate and these cells were epithelial in morphology (Fig. 5Ba). After incubating with ENC for 4 h, the cell morphology was unclear because of ENC particles on their surfaces (Fig. 5Bb), in addition, after 48 h incubation, a profound change in cell morphology, from epithelial-like to mesenchymal-like morphology was observed in ENC treated cells (Fig. 5Bc), and lots of the cells were dead, which were detached and floating (Fig. 5Bc and Ae). Besides, cells treated with bare NDs, low concentration cisplatin (ENC cisplatin loading amount, ∼0.6 μg ml−1) and NC (the cisplatin concentration is equivalent to that of ENC) showed only very small differences in growth. However, cell growth was inhibited after treated with ENC (Fig. 5C). High concentration cisplatin (5 μg ml−1) could inhibit cell growth as the positive control. Thus, results mentioned above clearly demonstrated that, the EGF in the ENC system played the role of the targeting molecules due to the specific biorecognition between EGF and EGFR, and ENC had a better anti-cancer effect in the same concentration of drugs compared with no-EGF modified NDs system.The EGFR antibody blocking test experiments were carried out to confirm the specific biorecognition between EGF and EGFR. Compared to the bare HepG2 cells, the cell morphology and proliferation of the EGFR antibodies-treated HepG2 cells had no obvious changes (Fig. 6Aa and b). When the bare HepG2 cells (shown in Fig. 6Aa) were treated with ENC system, most of the HepG2 cells were killed (Fig. 5Ac); however, when the bare HepG2 cells were first pre-treated with EGFR antibodies, the growth of HepG2 cells were minimally affected by the ENC targeted delivery system (Fig. 6Ad). Thus, these results revealed that the specific biorecognition between EGF (anchored in ENC) and EGFR (overexpressed on cancer cells) was the main reason for the selective killing of cancer cells. Cell viability data (Fig. 6B) showed that the growth of the HepG2 cells was obviously inhibited after ENC treatment. While the growth of HepG2 cells was hardly affected when the HepG2 cells were pretreated with EGFR antibody for antibody blocking, revealing that ENC bioconjugates could be used as a receptor-guided anticancer drug delivery system.
Results mentioned above clearly demonstrate that NDs bioconjugated with a targeting ligand and cisplatin is superior to untargeted drug-NDs bioconjugates for selective cancer therapy. The selective killing of cancer cells ability of ENC would allow for the use of much lower overall concentrations of the anti-cancer drug in cancer treatment, correspondingly, the risk of adverse side effects induced by the anti-cancer drugs, e.g. toxicity or immune system reaction, were lowered.
Cell migration assay
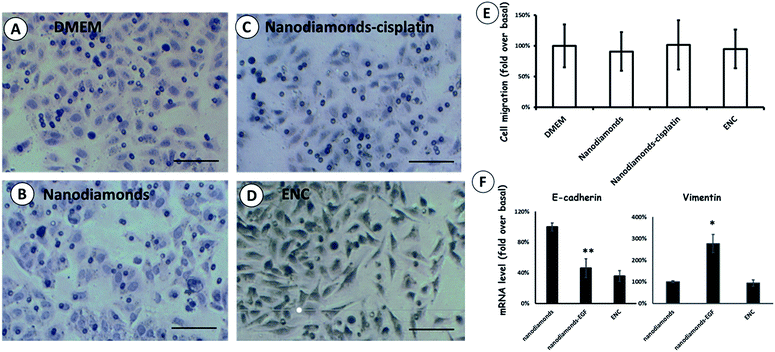
Cell migration plays a crucial role on tumor growth and metastasis. Therefore, the effect of ENC in cell migration needs to be evaluated. Transwell migration assays were used to study the cell migration. As shown in Fig. 7, compared to bare HepG2 cells, the migration ability of the cells was compared by treating the cells with bare NDs, NC and ENC, respectively. We found that the ENC system could not induce or block migration in HepG2 cells as no significant difference could be observed in transwell assay. While EN (EGF–nanodiamonds) could significantly induce migration in HepG2 cells, as shown in Fig. S3† The reasons, which the cell migration of EGF–NDs was different from ENC, are that cisplatin could block cell migration and reduce the EGF-induced cell migration.As mentioned above, the significant morphological changes, from epithelial-like to mesenchymal-like, existing in the ENC system (Fig. 7D, same as Fig. 5Ac and e) can be observed. So the related mechanism for morphological change of HepG2 cells induced by ENC need to be evaluated. Epithelial cells express high levels of E-cadherin, whereas mesenchymal cells express high levels of vimentin. The E-cadherin plays a key role in cellular adhesion.33 Vimentin is important for cancer cell migration. Drugs could inhibit the migration of the cancer cells via downregulation of vimentin.34 The morphological change also indicated that the EMT (epithelial–mesenchymal transition)35 mechanism might involve in the progress. E-cadherin and vimentin are also important effectors of EMT. The EMT is a process by which epithelial cells lose their cell polarity and cell–cell adhesion, and gain migratory abilities, becoming mesenchymal cells finally. However, as shown in Fig. 7F, it was found that NDs–EGF caused significant decrease in E-cadherin mRNA expression and increase in vimentin mRNA expression, indicating that EGF used as targeting molecule for cancer-drug selective delivery might cause EMT risks. Further, when the HepG2 cells were treated with ENC, although the E-cadherin mRNA expression also decreased, the expression of vimentin mRNA had no obvious change. Here, the decrease of E-cadherin expression means the loss of cell–cell adhesion. It is well known that E-cadherin is decreasing and vimentin is increasing during EMT. Therefore, ENC could not induce the EMT of HepG2 cells. These results showed ENC could cause the loss of cell adhesion and the increase of the surface areas of cancer cells for drug absorption. Based on these advantages, ENC (immobilized with EGF and cisplatin) would be a promising targeting drug delivery system.
Experimental
Materials
The 100 nm ND powder was purchased from Guangzhou Kesiman Co., Ltd (Guangzhou, China). Human epidermal growth factor (EGF) was purchased from PeproTech (Rocky Hill, NJ, USA). Cisplatin (CDDP) was purchased from Wako Pure Chemical Industries, Ltd. (Osaka, Japan). Hematein staining solution, N-hydroxysuccinimide (NHS) and 1-(3-dimethylaminopropyl)-3-ethylcarbodiimide hydrochloride (EDC) were from Sigma-Aldrich (St. Louis, MO, USA). Dulbecca's modified Eagle's medium (DMEM) and Modified Dulbecco's phosphate buffered saline (PBS) were purchased from Hyclone (Thermo Scientific, Beijing, China), penicillin–streptomycin and 0.25% trypsin–EDTA solution were from Hyclone (Thermo Scientific, Logan, Utah, USA), and fetal bovine serum (FBS) was from Hyclone (Thermo Scientific, Tauranga, New Zealand). H2SO4, HNO3 and NaOH (analytical or chromatographic grade) were purchased from China National Medicine Corporation (Shanghai, China). Transwell assay kit with 8 mm pores was purchased from FALCON (BD Biosciences; San Diego, CA, USA). The kits employed in this study were as follows: the cell counting kit-8 (CCK-8) was purchased from Dojindo Laboratories (Tokyo, Japan); Pierce® BCA protein assay kit was purchased from Pierce Biotechnology (Rockford, IL, USA). RNeasy® plus mini kits and Omniscript® reverse transcription kits were purchased from QIAGEN GmbH (Hilden, Germany). 2× Power SYBR Green PCR Master Mix was purchased from Applied Biosystems (Thermo Scientific, Beijing, China). The following antibodies were used in this study: anti-EGFR (Santa Cruz Biotechnology, San Diego, CA, USA).Preparation and characterization of EGF–NDs–cisplatin (ENC) bioconjugate
The preparation of carboxylated modified nanodiamond (ND) particles were as follows. NDs were added into the acid mixture of H2SO4![[thin space (1/6-em)]](https://www.rsc.org/images/entities/char_2009.gif) :
:![[thin space (1/6-em)]](https://www.rsc.org/images/entities/char_2009.gif) HNO3 (3
HNO3 (3![[thin space (1/6-em)]](https://www.rsc.org/images/entities/char_2009.gif) :
:![[thin space (1/6-em)]](https://www.rsc.org/images/entities/char_2009.gif) 1) at 70 °C for 24 h. Then, the NDs particles were treated by acid (HCl) and then by alkali (NaOH), respectively. The treated ND particles were subsequently washed with distilled water and centrifuged at 12
1) at 70 °C for 24 h. Then, the NDs particles were treated by acid (HCl) and then by alkali (NaOH), respectively. The treated ND particles were subsequently washed with distilled water and centrifuged at 12![[thin space (1/6-em)]](https://www.rsc.org/images/entities/char_2009.gif) 000 rpm for several times. The final samples dried in air and the carboxylated-NDs were obtained. To form EGF–NDs–cisplatin (ENC) particles, the dried carboxylated NDs were further dissolved in distilled water and were ultrasonically processed for 15 min, then 100 μl carboxylated NDs (1 mg ml−1) were incubated with 100 μl NHS (2 mg ml−1) and 100 μl EDC (2 mg ml−1) for 1 min at room temperature (RT). Then, the cisplatin (1 mg ml−1) and EGF (1 mg ml−1) were added in the mixture (NDs
000 rpm for several times. The final samples dried in air and the carboxylated-NDs were obtained. To form EGF–NDs–cisplatin (ENC) particles, the dried carboxylated NDs were further dissolved in distilled water and were ultrasonically processed for 15 min, then 100 μl carboxylated NDs (1 mg ml−1) were incubated with 100 μl NHS (2 mg ml−1) and 100 μl EDC (2 mg ml−1) for 1 min at room temperature (RT). Then, the cisplatin (1 mg ml−1) and EGF (1 mg ml−1) were added in the mixture (NDs![[thin space (1/6-em)]](https://www.rsc.org/images/entities/char_2009.gif) :
:![[thin space (1/6-em)]](https://www.rsc.org/images/entities/char_2009.gif) EGF
EGF![[thin space (1/6-em)]](https://www.rsc.org/images/entities/char_2009.gif) :
:![[thin space (1/6-em)]](https://www.rsc.org/images/entities/char_2009.gif) cisplatin = 100 μg
cisplatin = 100 μg![[thin space (1/6-em)]](https://www.rsc.org/images/entities/char_2009.gif) :
:![[thin space (1/6-em)]](https://www.rsc.org/images/entities/char_2009.gif) 100 μg
100 μg![[thin space (1/6-em)]](https://www.rsc.org/images/entities/char_2009.gif) :
:![[thin space (1/6-em)]](https://www.rsc.org/images/entities/char_2009.gif) 100 μg), and the resulting mixture reacted for an additional 1 h at 37 °C in a thermo-mixer. Finally, the samples were centrifuged at 12
100 μg), and the resulting mixture reacted for an additional 1 h at 37 °C in a thermo-mixer. Finally, the samples were centrifuged at 12![[thin space (1/6-em)]](https://www.rsc.org/images/entities/char_2009.gif) 000 rpm to pellet bound ENC particles. The unbound EGF and cisplatin remained in the supernatant and were subsequently removed. The ENC particles were then resuspended in 1 ml DMEM and kept ultrasonic treatment for 15 min before use. Control carboxylated NDs and NDs–cisplatin/EGF–NDs (minus EGF or cisplatin) were prepared similarly. The size distribution and zeta potentials were determined in distilled water with a zeta-potential analyzer, Zetasizer 3000HS (Malvern Instruments, Malvern, England). A series of experiments, including the measurement of protein assay and ICP-OES (Varian 710-ES) were carried out to test the loading efficiencies of the EGF and cisplatin on the surface of the NDs. The amounts of EGF in the supernatant of the reaction solution before and after ENC preparation were determined using a Pierce BCA protein assay kit (Rockford, IL, USA). The conjugation efficiency of EGF into ENC were calculated and normalized per 100 μg of ND. Samples (nanodiamonds–cisplatin (NC) and ENC) were first prepared by digesting the ENC and NC into the aqua regia, and then dilute in the water. The loading efficiency of cisplatin was measured with ICP-OES. The loading efficiency of cisplatin was then calculated and normalized per 100 μg of NDs.
000 rpm to pellet bound ENC particles. The unbound EGF and cisplatin remained in the supernatant and were subsequently removed. The ENC particles were then resuspended in 1 ml DMEM and kept ultrasonic treatment for 15 min before use. Control carboxylated NDs and NDs–cisplatin/EGF–NDs (minus EGF or cisplatin) were prepared similarly. The size distribution and zeta potentials were determined in distilled water with a zeta-potential analyzer, Zetasizer 3000HS (Malvern Instruments, Malvern, England). A series of experiments, including the measurement of protein assay and ICP-OES (Varian 710-ES) were carried out to test the loading efficiencies of the EGF and cisplatin on the surface of the NDs. The amounts of EGF in the supernatant of the reaction solution before and after ENC preparation were determined using a Pierce BCA protein assay kit (Rockford, IL, USA). The conjugation efficiency of EGF into ENC were calculated and normalized per 100 μg of ND. Samples (nanodiamonds–cisplatin (NC) and ENC) were first prepared by digesting the ENC and NC into the aqua regia, and then dilute in the water. The loading efficiency of cisplatin was measured with ICP-OES. The loading efficiency of cisplatin was then calculated and normalized per 100 μg of NDs.
Cellular uptake of ENC in HepG2 cells
Qualitative analysis on the cellular uptake of ENC was performed by Raman microscopy (RAMAN-11; Nanophoton, Osaka, Japan), using a 60×/1.2 NA water immersion objective lens (UPLSAPO 60XW, Olympus). The excitation wavelength is 532 nm. The laser intensity used at the sample plane was 0.7 mW μm−2. The exposure time for each line was 5 s and the acquisition time for each sample was 5–8 min. The space resolution: the pixel size (V) was 431.5 nm and the pixel size (H) was 423.5 nm. HepG2 cells were first washed three times with PBS, then incubated with bare NDs, NDs–cisplatin (NC) and ENC at 37 °C for 4 h, respectively, and finally washed three times with PBS before being observed by Raman microscopy for short term localization of ENC in HepG2 cells, moreover, after 4 h treatment, HepG2 cells were recultured and incubated with DMEM (10% FBS) for another 48 h before being observed by Raman microscopy for long-term localization. Cells that had been just exposed to DMEM were used as a control.In vitro cell viability assays
HepG2 cells were first seeded in a 96-well plate (3 × 10³ cells per well) in triplicate for 24 h, and the cells were grown to 50–60% confluency. The media was aspirated and washed three times with PBS. Then, the cells were incubated with fresh media containing ENC (100 μg ml−1) and control complexes for 4 h, then washed three times in PBS solution. The pretreated cells were finally incubated in fresh media for an additional 48 h. The cells that had been just exposed to DMEM were used as the control samples. Cell viability was measured by CCK-8 assay, and measured optically at 450 nm. All experiments were repeated in triplicate.Antibody blocking experiments: HepG2 cells were seeded in a 96-well plate (3 × 10³ cells per well) in triplicate for 24 h. The media was aspirated and washed three times with PBS. And then, the cells were incubated with fresh media with/without EGFR antibody for 2 h. The media was aspirated and washed three times with PBS. Next, the cells were incubated with fresh media containing ENC (100 μg ml−1) and without ENC for 4 h, respectively. After three times washes in PBS, cells were incubated for an additional 48 h in a fresh media. Cell viability was measured by CCK-8 assay, and measured optically at 450 nm. All experiments were repeated in triplicate.
Cell migration assay
Cell migration was measured by using Transwell assay kit with 8 mm pores as described previously.36 HepG2 cells were treated with ENC (100 μg ml−1) or the control complexes in serum-free DMEM medium, and plated on to the Transwell insert placed in the chamber containing DMEM with 10% FBS. The chambers were incubated at 37 °C in 5% CO2 for 16 h. Migrated cells, which adhered to the lower surface of the porous membrane, were fixed in 4% paraformaldehyde for 15 min, and then stained with hematein staining solution. Unmigrated cells on the upper membrane surface were removed with a cotton swab. The migration was quantified by analyzing at least six random fields per filter for each independent experiment. All experiments were repeated in triplicate.RNA preparation and quantitative polymerase chain reaction (qPCR)
Total RNA from pancreas was extracted with the RNeasy® plus mini kit. cDNA was prepared by in vitro transcription using Omniscript® reverse transcription kit. cDNA was used as a template for PCR amplification in a 20 μl reaction volume using gene-specific primer pairs. 2× Power SYBR Green PCR Master Mix was used. The following cycle was used for the amplification: 95 °C for 10 min, followed by 40 cycles of denaturation at 95 °C for 15 s and primer extension at 60 °C for 1 min. Relative changes in gene expression were calculated by the comparative 2−ΔΔCt method in which 18 s was used for normalization with the reported method.37 Primer sets for vimentin, E-cadherin and 18 s: vimentin F, AAGGCGAGGAGAGCAGGATT, R, GGTCATCGTGATGCTGAGAAG; E-cadherin F, CCTGGCAAGATGCAGAAACTG, R, TGCTGCTTGGCCTCAAAAT; 18 s F, GTAACCCGTTGAACCCCATT, R, CCATCCAATCGGTAGTAGCG. For each reaction, a parallel reaction that lacked template was performed as a negative control. All RT-PCR reactions for each sample were done in triplicate.Statistical analysis
Data were expressed as means ± standard deviation (SD) and were analyzed by Student's t-test when appropriate. p < 0.05 was considered statistically significant.Conclusions
A visualization of targeted drug delivery system, EGF–NDs–cisplatin (ENC) bioconjugate was developed, where EGF was used as targeting molecular and NDs were used as not only drug carrier but also Raman probe. Due to the specific biorecognition between EGF (anchored in ENC) and EGFR (overexpressed on cancer cells), the ENC targeted delivery system could selectively kill the cancer cells in a lower overall concentrations of the anti-cancer drug in cancer treatment, correspondingly, the risk of adverse side effects induced by the anti-cancer drugs, e.g. toxicity or immune system reaction, were lowered. Because the ENC system might induce the morphologic change of cell from epithelial to mesenchymal-like, it could increase the surface areas of cancer cells for drug absorption. Combined with Raman imaging technique, the developed ENC targeted drug delivery system opens up exciting opportunities for targeting biomedical imaging, drug delivering and their visualization.Abbreviations
| ENC | EGF–nanodiamonds–cisplatin |
| EN | EGF–nanodiamonds |
| NC | Nanodiamonds–cisplatin |
| EMT | Epithelial–mesenchymal transition |
| The EPR effect | The enhanced permeability and retention effect |
| EGF | Epidermal growth factor |
| FBS | Fetal bovine serum |
| NDs | Nanodiamonds |
Acknowledgements
This work was supported by the National Natural Science Foundation of China (No. 21375137), the International Science & Technology Cooperation Program of China (No. 2013DFG50150).Notes and references
- World Health Organization, World Cancer Report, 2014, ch. 1.1 Search PubMed.
- A. Jemal, F. Bray, M. M. Center, J. Ferlay, E. Ward and D. Forman, Ca-Cancer J. Clin., 2011, 61, 69–90 CrossRef PubMed.
- Y. Liu and W. Lu, Expert Opin. Drug Delivery, 2012, 9, 671–686 CrossRef CAS PubMed.
- E. K. Chow and D. Ho, Sci. Transl. Med., 2013, 5, 216rv214 Search PubMed.
- V. Vaijayanthimala, D. K. Lee, S. V. Kim, A. Yen, N. Tsai, D. Ho, H. C. Chang and O. Shenderova, Expert Opin. Drug Delivery, 2015, 12, 735–749 CrossRef CAS PubMed.
- N. Tsai, B. Lee, A. Kim, R. Yang, R. Pan, D. K. Lee, E. K. Chow and D. Ho, J. Lab. Autom., 2014, 19, 511–516 CrossRef PubMed.
- D. Ho, Cancer Treat. Res., 2015, 166, 85–102 CrossRef CAS PubMed.
- D. Ho, C. H. Wang and E. K. Chow, Sci. Adv., 2015, 1, e1500439 Search PubMed.
- A. A. Bhirde, V. Patel, J. Gavard, G. Zhang, A. A. Sousa, A. Masedunskas, R. D. Leapman, R. Weigert, J. S. Gutkind and J. F. Rusling, ACS Nano, 2009, 3, 307–316 CrossRef CAS PubMed.
- M. Creixell, A. Herrera, V. Ayala, M. Latorre-Esteves, M. Perez-Torres, M. Torres-Lugo and C. Rinaldi, J. Magn. Magn. Mater., 2010, 322, 2244–2250 CrossRef CAS.
- A. M. Master and A. Sen Gupta, Nanomedicine, 2012, 7, 1895–1906 CrossRef CAS PubMed.
- D. Ho, ACS Nano, 2009, 3, 3825–3829 CrossRef CAS PubMed.
- A. Adnan, R. Lam, H. Chen, J. Lee, D. J. Schaffer, A. S. Barnard, G. C. Schatz, D. Ho and W. K. Liu, Mol. pharmaceutics, 2011, 8, 368–374 CrossRef CAS PubMed.
- M. Chen, E. D. Pierstorff, R. Lam, S. Y. Li, H. Huang, E. Osawa and D. Ho, ACS Nano, 2009, 3, 2016–2022 CrossRef CAS PubMed.
- E. K. Chow, X. Q. Zhang, M. Chen, R. Lam, E. Robinson, H. Huang, D. Schaffer, E. Osawa, A. Goga and D. Ho, Sci. Transl. Med., 2011, 3, 73ra21 Search PubMed.
- H. B. Man, H. Kim, H. J. Kim, E. Robinson, W. K. Liu, E. K. Chow and D. Ho, Nanomedicine: Nanotechnology, Biology, and Medicine, 2014, 10, 359–369 CrossRef CAS PubMed.
- R. A. Shimkunas, E. Robinson, R. Lam, S. Lu, X. Xu, X. Q. Zhang, H. Huang, E. Osawa and D. Ho, Biomaterials, 2009, 30, 5720–5728 CrossRef CAS PubMed.
- A. H. Smith, E. M. Robinson, X. Q. Zhang, E. K. Chow, Y. Lin, E. Osawa, J. Xi and D. Ho, Nanoscale, 2011, 3, 2844–2848 RSC.
- T. B. Toh, D. K. Lee, W. Hou, L. N. Abdullah, J. Nguyen, D. Ho and E. K. Chow, Mol. Pharmaceutics, 2014, 11, 2683–2691 CrossRef CAS PubMed.
- X. Q. Zhang, R. Lam, X. Xu, E. K. Chow, H. J. Kim and D. Ho, Adv. Mater., 2011, 23, 4770–4775 CrossRef CAS PubMed.
- W. S. Yeap, Y. Y. Tan and K. P. Loh, Anal. Chem., 2008, 80, 4659–4665 CrossRef CAS PubMed.
- G. Xi, E. Robinson, B. Mania-Farnell, E. F. Vanin, K. W. Shim, T. Takao, E. V. Allender, C. S. Mayanil, M. B. Soares, D. Ho and T. Tomita, Nanomedicine: Nanotechnology, Biology and Medicine, 2014, 10, 381–391 CrossRef CAS PubMed.
- X. Wang, X. C. Low, W. Hou, L. N. Abdullah, T. B. Toh, M. Mohd Abdul Rashid, D. Ho and E. K. Chow, ACS Nano, 2014, 8, 12151–12166 CrossRef CAS PubMed.
- V. Vaijayanthimala, D. K. Lee, S. V. Kim, A. Yen, N. Tsai, D. Ho, H. C. Chang and O. Shenderova, Expert Opin. Drug Delivery, 2014, 1–15, DOI:10.1517/17425247.2015.992412.
- B. Guan, F. Zou and J. Zhi, Small, 2010, 6, 1514–1519 CrossRef CAS PubMed.
- A. Erdreich-Epstein, H. Shimada, S. Groshen, M. Liu, L. S. Metelitsa, K. S. Kim, M. F. Stins, R. C. Seeger and D. L. Durden, Cancer Res., 2000, 60, 712–721 CAS.
- W. Arap, R. Pasqualini and E. Ruoslahti, Science, 1998, 279, 377–380 CrossRef CAS PubMed.
- I. Astsaturov, R. B. Cohen and P. M. Harari, Cancer Treat. Res., 2008, 139, 135–152 Search PubMed.
- J. C. Cheng, N. Auersperg and P. C. Leung, PLoS One, 2012, 7, e34071 CAS.
- B. Waclaw, I. Bozic, M. E. Pittman, R. H. Hruban, B. Vogelstein and M. A. Nowak, Nature, 2015, 525, 261–264 CrossRef CAS PubMed.
- B. Zhang, Y. Li, C. Y. Fang, C. C. Chang, C. S. Chen, Y. Y. Chen and H. C. Chang, Small, 2009, 5, 2716–2721 CrossRef CAS PubMed.
- I. Pope, L. Payne, G. Zoriniants, E. Thomas, O. Williams, P. Watson, W. Langbein and P. Borri, Nat. Nanotechnol., 2014, 9, 940–946 CrossRef CAS PubMed.
- J. Pasquier, N. Abu-Kaoud, H. Al Thani and A. Rafii, J. Oncol., 2015, 2015, 792182 Search PubMed.
- R. P. Singh, K. Raina, G. Sharma and R. Agarwal, Clin. Cancer Res., 2008, 14, 7773–7780 CrossRef CAS PubMed.
- M. Tania, M. A. Khan and J. Fu, Tumor Biol., 2014, 35, 7335–7342 CrossRef CAS PubMed.
- Y. Kong, H. Wang, T. Lin and S. Wang, Mediators Inflammation, 2014, 2014, 565369 Search PubMed.
- K. J. Livak and T. D. Schmittgen, Methods, 2001, 25, 402–408 CrossRef CAS PubMed.
Footnote |
| † Electronic supplementary information (ESI) available. See DOI: 10.1039/c6ra04753j |
| This journal is © The Royal Society of Chemistry 2016 |

