Improving the mechanical stability of proton conducting SPEEK membranes by in situ precipitation of zirconium phosphate phenylphosphonates

Monica Pica*a, Roberto D'Amatob, Anna Donnadioa, Donatella Capitanic, Elisabetta Tronib, Cristiano Zuccacciab and Mario Casciola*b
aDepartment of Pharmaceutical Sciences, Perugia University, Via del Liceo 1, 06123 Perugia, Italy. E-mail: monica.pica@unipg.it; Fax: +39 075 585 5566; Tel: +39 075 585 5564
bDepartment of Chemistry, Biology and Biotechnologies, Perugia University, Via Elce di Sotto 8, 06123 Perugia, Italy. E-mail: mario.casciola@unipg.it
cLaboratorio di Risonanza Magnetica “Annalaura Segre”, Istituto di Metodologie Chimiche, CNR, Via Salaria km 29.300, 00016 Monterotondo Scalo (RM), Italy. Fax: +39 075 585 5566; Tel: +39 075 585 5564

Received 22nd February 2016 , Accepted 6th April 2016

First published on 7th April 2016


Abstract

The formation of layered zirconium phosphate phenylphosphonates, Zr(O3POH)2−x(O3PC6H5)x (hereafter ZP(PP)x, with x in the range 0–2.0) from precursor solutions of zirconyl propionate, phosphoric and/or phenylphosphonic acids was studied by using NMP as solvent. On the basis of this investigation, composite membranes made of a SPEEK matrix (EW = 625, hereafter FUM) filled with ZP(PP)x, with x = 0, 0.72 and 2.0 and filler loading up to 36 wt%, were prepared by casting mixtures of the precursor solution and a FUM dispersion in NMP. All the composite membranes exhibited lower swelling in water than FUM up to 110 °C, and, among them, the membrane with 32 wt% ZP(PP)0.72 (hereafter FUM/ZP(PP)0.72-32) showed the lowest water uptake and the highest Young's modulus, with a proportional increase up to 60% with respect to FUM, at 70 °C and 80% relative humidity (RH). At 80 °C, the proton conductivity of all the composites decreased with increasing filler loading, and FUM/ZP(PP)0.72-32 was less conductive than FUM by a factor of ∼5, both at 50% and 95% RH. However, differently from FUM, the conductivity of FUM/ZP(PP)0.72-32 turned to be stable over time even at 110 °C in the presence of liquid water, being around 0.1 S cm−1.

1 Introduction

The use of aromatic polymers, such as polyether ketones (PEK) with varying number of ether and ketone functionalities (PEEK, PEKK, PEKEKK, etc.), is a promising route for the fabrication of proton conducting polymer electrolyte membranes, as alternatives to perfluorosulfonic acid (PFSA) membranes.1,2 Commercially available aromatic polymers are less expensive than PFSA ionomers, and ionic or ionogenic groups, such as sulfonic groups, can be easily anchored to the polyaromatic backbone as pendant groups.1 However, the main drawback, especially of highly sulfonated PEK (SPEK) ionomers, is that they swell too easily at operating temperatures between 60 and 80 °C and lose their mechanical stability. On the other hand, high levels of sulfonation are required in order to assure a suitable proton conductivity for fuel cell applications. As an example, a no-thermally treated sulfonated PEEK membrane (SPEEK), with ion exchange capacity (IEC) = 2.10 meq g−1, completely dissolves in water at 80 °C.3 Different strategies have been adopted to improve the mechanical stability of polyaromatic ionomers, among which the use of inorganic fillers as stiffeners. The literature offers several examples of polymeric composites based on SPEEK and hydrophilic inorganic and inorgano-organic fillers,1,2,4 among which low proton conductive materials such as SiO2, TiO2, ZrO2, WO3, zirconium phosphate and highly conductive compounds such as heteropolyacids and zirconium phosphate sulfophenylphosphonates. Differently, very few data are available for SPEK composites based on hydrophobic fillers.5 On the other hand, it was recently reported that the insertion of a hydrophobic filler into PFSA matrices turns out to be highly effective for their mechanical reinforcement.6 In light of these considerations, the present work reports the synthesis and the physico-chemical characterization of new polymeric composite membranes based on a SPEEK matrix and inorgano-organic fillers containing hydrophobic phenyl rings. Specifically, single phase mixed zirconium phosphate phenylphosphonates, Zr(O3POH)2−x(O3PC6H5)x (hereafter ZP(PP)x), were used as fillers. These compounds can be considered as organic derivatives of α-type layered Zr(IV) phosphate (α-Zr(HPO4)2, hereafter ZP), in which part of the O3POH groups (hereafter P) of the inorganic layers are replaced by phenylphosphonate groups (O3PC6H5, hereafter PP). The P and PP groups are randomly arranged on the layers, thus originating “porous pathways”, which can facilitate the access of the polymer chains in the interlayer region:7 this possibility, together with the chemical affinity of the phenyl groups for the polyaromatic backbone of SPEEK, are quite important features in order to achieve a good degree of dispersion of the filler within the polymer matrix. The present paper describes the synthesis of ZP(PP)x materials according to the “precursor method”8 and their use for the preparation of composite membranes which have been characterized by 31P MAS NMR, water uptake measurements, stress–strain tests, and conductivity measurements as function of temperature and relative humidity (RH).

2 Experimental

2.1 Materials

Zirconyl propionate (ZrO1.26(C2H5COO)1.49, MW = 220 Da) was supplied by Magnesium Elektron Ltd., England. Concentrated orthophosphoric acid (85%, 14.8 M) and N-methyl-2 pyrrolidone (NMP) was supplied by Fluka. FUMION E-625 solution 20 wt% in NMP (ion exchange capacity, IEC = 1.6 meq g−1), was purchased from FuMA-Tech. Phenylphosphonic acid (H2O3PC6H5, hereafter H2PP) and all other reagents were purchased from Aldrich.

2.2 Preparation of zirconium phosphate phenylphosphonates by using the “precursor method”

Zirconium phosphate phenylphosphonates, ZP(PP)x, were prepared according to the “precursor method”.8 Specifically, 2 mmol of zirconyl propionate were dissolved in NMP. Separately, H2PP and concentrated phosphoric acid were dissolved in NMP, so that the H2PP molar fraction, XH2PP = [H2PP]/([H2PP] + [H3PO4]), was in the range 0.0625–0.75. The first solution was added to the second one under stirring at room temperature, thus obtaining a clear solution, in which the total phosphorus concentration, Ptot, was 0.9 M and the Ptot/Zr molar ratio (hereafter R) was in the range 3–9.

Precursor solutions of pure zirconium phosphate (hereafter ZP) and pure zirconium phenylphosphonate (hereafter Z(PP)2) were also prepared by adding, to a solution of zirconyl propionate in NMP, a suitable amount of a solution of phosphoric acid and phenylphosphonic acid in NMP, respectively (R = 3, [H3PO4] or [H2PP] = 0.9 M, [Zr] = 0.3 M).

2.3 Preparation of the pure FUMION membrane

In order to have a polymer dispersion suitable for the filming step, a certain amount of NMP was added to the commercial 20 wt% FUMION solution in NMP, so as to reduce the polymer concentration up to 14 wt%. The dispersion was then cast on a glass plate by using an automatic film coater (Elcometer 4340 Applicator). The membrane was first heated at 50 °C for 24 h and then at 90 °C for 2 h to remove the residual solvent, washed with 1 M HCl at RT for approximately 3 h, and finally thermally treated at 160 °C in an oven for 1 h. The FUMION membrane (hereafter FUM) was stored at room temperature and 53% RH before analysis.

2.4 Preparation of the composite membranes based on FUMION and ZP(PP)x

A suitable amount of the ZP(PP)0.72 precursor solution (R = 3, XH2PP = 0.25, [Zr] = 0.3 M) was added, dropwise and under stirring, to the 20 wt% FUMION solution in NMP. Then, NMP was added to the above mixture so as to reduce the polymer concentration up to 10 wt%. The mixture was left under stirring for about 30 min, degassed and then cast. The composite membrane was treated as previously described for the FUM membrane. The filler loading of the composite membranes (hereafter FUM/ZP(PP)0.72-w, where w indicates the filler wt%), determined by thermogravimetric analysis, was 8, 14, 25 and 32 wt%.

By using the same procedure composite membranes containing ZP (hereafter FUM/ZP-w, with w = 17, 26, 34) and Z(PP)2 (hereafter FUM/Z(PP)2-w, with w = 12, 27, 36) were also prepared.

All the membrane samples, having thickness 70–90 μm, were stored at room temperature and 53% RH before characterization.

2.5 Techniques

X-ray diffraction patterns of powders were collected with a Philips X'Pert PRO MPD diffractometer operating at 40 kV and 40 mA, with a step size 0.03341 and step scan 40 s, using CuKα radiation and an X'Celerator detector. To minimize preferred orientations, the powder samples were carefully side-loaded onto a glass sample holder.

Thermogravimetric analysis was carried out by a NETZSCH STA449 Jupiter thermal analyzer connected to a NETZSCH TASC 414/3 A controller at a heating rate of 10 °C min−1, with an air flow of about 30 mL min−1.

Quantitative solution phase 31P NMR spectra were measured on a Bruker Avance III HD 400 spectrometer equipped with a smartprobe using the standard inverse-gated decoupling pulse sequence available on the Bruker TopSpin 3.2 library. The relaxation delay was set to 30 s and 16 to 32 scans were collected for each spectrum. Referencing is relative to external 85% D3PO4 in D2O. The chemical shifts of the phosphoric and phenylphosphonic acid signals were +0.7 and +15.0 ppm, respectively. Each NMR sample was prepared by dissolving about 30 mg of the solids in 3 M HF (≈2 mL) and adding about 0.5 mL of D2O.

Solid state 31P MAS NMR spectra were performed at 161.97 MHz on a Bruker Advance 400 spectrometer. The samples were packed into 4 mm zirconia rotors and sealed with Kel-F caps. The spin rate was 8 kHz. The π/2 pulse width was 3.5 μs, and the recycle delay was 140 s; 1200 scans were collected for each spectrum. Spectra were acquired using 2048 data points. All spectra were zero filled and Fourier transformed. The chemical shift was externally referred to H3PO4 85%. The deconvolution of 31P MAS spectra was performed using the DM2006 program.10 The Gaussian/Lorentzian model was selected. Each resonance was characterized by the amplitude, the resonance frequency in parts per million (ppm), and the width at half-height.

Stress–strain mechanical tests were carried out by a Zwick Roell Z1.0 testing machine, with a 200 N static load cell, equipped with a climatic chamber operating in the RH range 30–95% (±0.5%) and in the temperature range 10–80 °C (±0.5 °C), on rectangle shaped film stripes, obtained by a cutting machine, length and width of which were 100 and 5 mm, respectively. Room temperature tests were performed on samples equilibrated for 7 days in vacuum desiccators at 53% RH and room temperature (20–23 °C), while the high temperature tests were performed after equilibration of the samples in the climate chamber at 70 °C and 80% RH for one day. The thickness of the film stripe, determined with an uncertainty of 5 μm, was in the range 70–90 μm. An initial grip separation of 10.000 ± 0.002 mm and a crosshead speed of 30 mm min−1 were used. At least five replicate film stripes were analyzed. The data were elaborated by the TestXpert V11.0 Master software.

Water uptake determinations from liquid water in the temperature range 25–110 °C, or from water vapour at 70 °C to 80% RH, were performed on 40 × 30 mm rectangle shaped film stripes. Water uptake (WU) was calculated by the following equation:

image file: c6ra04676b-t1.tif
where Whydr is the weight of the membrane after equilibration in liquid water at different temperatures for one day, while Wdry is the weight of the dry membrane, obtained by heating the hydrated membrane at 120 °C for 5 hours.

The λ values of the FUM membrane were calculated according to the following formula:

image file: c6ra04676b-t2.tif
where M(H2O) is the water molar mass and IEC is the ionomer ion exchange capacity (in meq g−1).

The λ values of the composite membranes were calculated by assigning all the uptaken water molecules to the ionomer, since it is not trivial to determine the hydration of the inorganic filler, formed within the ionomer matrix. Therefore, the λ values thus calculated, represent upper limit values.

The in-plane conductivity of the membranes was determined on 5 cm × 0.5 cm membrane strips in the frequency range 10 Hz to 100 kHz with 100 mV signal amplitude by four-probe impedance measurements by using an Autolab, PGSTAT30 potentiostat/galvanostat equipped with a frequency response analysis (FRA) module as described in ref. 9. The RH was controlled by using stainless steel sealed-off cells that consist of two communicating cylindrical compartments held at different temperatures. The cold compartment contained water, and the hot compartment housed the membrane under test. RH values were calculated from the ratio between the pressures of saturated water vapor (p) at the temperatures of the cold (Tc) and hot (Th) compartment as follows:

RH = p(Tc)/p(Th) × 100.

3 Results and discussion

All composite membranes were obtained by casting mixtures of a FUM dispersion and suitable amounts of the filler precursor solution: when the solvent is evaporated, the ionomer and the filler co-precipitate thus forming the FUM/ZP(PP)x composite films. In order to set up the conditions leading to fillers with the desired composition, ZP(PP)x compounds were first precipitated ex situ from precursor solutions with different composition in terms of H2PP molar fraction and Ptot/Zr molar ratio. Therefore, the synthesis of these compounds will be reported before the preparation and the characterization of the composite membranes.

3.1 Preparation of ZP(PP)x by using the “precursor method”

In order to promote the ZP(PP)x formation in the same conditions used for the preparation of the composite membranes, the precursor solution was left at 50 °C for 24 h: a semitransparent gel was obtained, which was washed and dried in oven at 60 °C for 15 h. The corresponding powder sample was washed and finally dried in oven at 60 °C for 15 h. Several materials were prepared by changing the experimental parameters as shown in Table 1.
Table 1 Experimental parameters used for the synthesis of the ZP(PP)x materials and their composition
Solution Solid, ZP(PP)x
R XH2PP [Zr] (M) XPP
3 0.25 0.3 0.72 ± 0.05
4 0.0625 0.5 0.51 ± 0.04
4 0.125 0.5 0.63 ± 0.04
4 0.25 0.5 0.97 ± 0.06
4 0.375 0.5 1.85 ± 0.09
4 0.5 0.5 1.9 ± 0.1
4 0.75 0.5 1.96 ± 0.04
6 0.25 0.2 1.1 ± 0.1
9 0.25 0.1 1.4 ± 0.1


Thermogravimetric curves of ZP(PP)x, shown in Fig. 1, are typical of zirconium(IV) phosphonates:10 after the first weight loss, centred around 100 °C and due to adsorbed and intercalated water molecules, a significant weight loss is observed in the range 400–1200 °C due to the decomposition of the organic moieties and to the loss of condensation water, with formation of cubic zirconium pyrophosphate.


image file: c6ra04676b-f1.tif
Fig. 1 Thermogravimetric curves of ZP(PP)x, obtained for XH2PP = 0.25 and R = 3 (a), R = 4 (b), R = 6 (c) R = 9 (d).

Taking into account that the Ptot/Zr molar ratio of the solids, calculated by ICP analysis, was around 2, it was possible to determine their composition from the second weight loss. The phosphate/phosphonate molar ratio of ZP(PP)x was also determined by 31P liquid NMR on samples previously dissolved in water by treatment with concentrated HF: the x values thus calculated are in good agreement with those determined by TG analysis, with a maximum uncertainty of 15%. The x values for ZP(PP)x are reported in Table 1.

The molar fraction of PP groups in ZP(PP)x, XPP = x/2, was plotted vs. XH2PP in the solution, as shown in Fig. 2.


image file: c6ra04676b-f2.tif
Fig. 2 Molar fraction of PP groups in ZP(PP)x (XPP) as function of the molar fraction of H2PP in the mother solution (XH2PP), for R = 4.

As already observed for zirconium phosphate phenylphosphonates prepared according to the “gel method”,10b all the PP molar fraction values of ZP(PP)x lie above the diagonal line which represents the expected composition of the materials, calculated by assuming that the Zr(IV) affinity for the phenylphosphonate anion is the same as that for monohydrogen phosphate. This result further proves that the PP groups have a higher affinity toward Zr(IV) than the HPO4 groups, at least when the synthesis is carried out in organic solvents.

X-ray powder diffraction (XRPD) patterns of the ZP(PP)x samples are shown in Fig. 3.


image file: c6ra04676b-f3.tif
Fig. 3 XRPD of ZP(PP)x samples for the reported x values.

Due to the low degree of crystallinity of the samples, just few qualitative structural considerations can be done. A broad peak at low 2θ values is generally observed, due to the (00l) crystallographic planes and associated to the interlayer distance. Moreover, in some cases, the peak at 33.8° 2θ (d = 2.65 Å), typical of the Zr–Zr separation in the α-type layer, was also evident, suggesting that the ZP(PP)x materials have an α-layer structure. It is also noteworthy that the peak at 11.6° 2θ (d = 7.56 Å), typical of α-ZP·H2O, was never observed. In addition, the interlayer distance progressively increases with increasing x from 10.4 Å and 14.7 Å, lying between that of α-ZP·H2O and that of ZP(PP)2 (d = 14.7 Å). In light of this, it is reasonable to infer that also the precursor method allows to obtain single-phase mixed zirconium phosphate phenylphosphonates. As previously reported, the presence of functional groups with different size, randomly interdispersed on the layer surface, can promote both the diffusion of host species, such as solvent molecules, and the interaction with the polymer chains in a polymeric nanocomposite.7,10

3.2 FUM/ZP(PP)x composite membranes

The idea that inspired the present work was to improve the mechanical resistance of the SPEEK polymer matrix by promoting specific polymer–filler interactions. On this regard, many efforts are currently devoted, in the field of polymer electrolyte membranes for fuel cell applications, to the enhancement of the membrane mechanical stability, which is a necessary requirement to avoid premature membrane failure caused by hydration changes (and associated mechanical stress) during fuel cell operation. In light of these considerations, ZP(PP)0.72 was selected as filler for FUM, by taking into account that the hydrophobic phenyl rings and the protogenic phosphate groups, interdispersed on the layer surface, are expected to interact with the aromatic backbone and with the hydrophilic sulfonic groups of the ionomer, respectively.

FUM/ZP(PP)0.72-w composite membranes, with w in the range 8–32, were prepared and their physico-chemical properties were compared with those of the pure ionomer, as well as with those of FUM/ZP-w (with w = 17, 26, 34) and FUM/Z(PP)2-w (with w = 12, 27, 36) composite membranes.

3.2.1 31P MAS NMR. Fig. 4 shows the 31P MAS NMR spectra of ZP(PP)0.72 and FUM/ZP(PP)0.72-32. In both spectra the presence of two main signals, at around −22 and −4 ppm, is observed, which are assigned to the phosphate and phenyl phosphonate groups, respectively, bonded through the oxygens to three Zr(IV) atoms. Moreover, the two weaker signals at around −14.5 and +5.5 ppm are attributed to the phosphate and phenylphosphonate groups, respectively, connected to two Zr(IV) atoms. Similar spectra were obtained for zirconium phosphate phenylphosphonates synthesized by topotactic exchange reaction carried out on gels of nanosized ZP.10b
image file: c6ra04676b-f4.tif
Fig. 4 31P MAS NMR of ZP(PP)0.72 powder (A) and FUM/ZP(PP)0.72-32 membrane (B).

By deconvolution of the peaks of spectra (A) and (B), it has been observed that:

- the phosphate/phenylphosphonate molar ratio of the ZP(PP)0.72 powder sample is the same as that found for the composite membrane FUM/ZP(PP)0.72-32. This result is not trivial, since in the composite membrane the filler was formed within the polymer matrix, by solvent evaporation from the cast membrane; moreover, the composite membrane underwent several treatments, which could modify the filler composition;

- the percentage of the double-connected phosphate and phosphonate groups, was ≤7% of the total groups;

- the phosphate/phenylphosphonate molar ratio of the powder sample (spectrum A) is in very good agreement with that obtained by TG and 31P liquid NMR; similar results were obtained for the other powder samples.

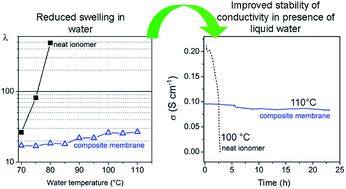
3.2.2 Membrane water uptake. The proton transport properties and the dimensional stability of the ionomeric membranes are closely connected to their water content. In light of this, the water uptake (WU) of all membranes was determined in liquid water in the temperature range 25–110 °C, as described in the experimental section. The WU values were used to calculate the λ values of both FUM and composite membranes. The λ values of FUM and those of the three different groups of membranes are reported in Fig. 5 as function of the water temperature. It can be observed that, for the neat polymer, λ goes from 11.6 to 16.2 in the temperature range 25–60 °C. Then, λ starts to increase rapidly and reaches 490 at 80 °C; it was not possible to determine the λ values at temperatures ≥85 °C, since the membrane completely loses its mechanical stability in the temperature range 60–85 °C and tends to dissolve in water. The composite membranes exhibit λ values close to those of the neat ionomer in the temperature range 20–60 °C (data not reported for the sake of simplicity) while their hydration is significantly lower than that of FUM at temperatures ≥75 °C. On the whole, the λ values of the composites decreases with increasing the filler loading: maximum values of 134, 127 and 187 were found at 95 °C for FUM/ZP(PP)0.72-8, FUM/Z(PP)2-12 and FUM/ZP-26, respectively: these membranes completely loose their mechanical stability in the temperature range 95–100 °C.
image file: c6ra04676b-f5.tif
Fig. 5 Water uptake (λ) from liquid water as function of temperature for FUM, FUM/ZP(PP)0.72, FUM/Z(PP)2 and FUM/ZP membranes.

For the membranes with the highest filler loadings it was possible to determine the water content up to at least 110 °C, without observing a significant mechanical failure: at 110 °C λ values of 27, 34, 72 were found for FUM/ZP(PP)0.72-32, FUM/Z(PP)2-36 and FUM/ZP-34, respectively. The above results proved that the polymer–filler interaction effectively reduces the water uptake, thus shifting to higher values the temperature at which the polymer matrix starts to lose the mechanical stability (maximum ΔT = 30 °C). Moreover, among the different kinds of composite membranes, the best result, in terms of water uptake reduction, was obtained with the membrane FUM/ZP(PP)0.72-32, thus suggesting that the co-presence, on the filler particles, of functional groups with different size and hydrophilic character can better tune the interaction with the ionomer matrix.

The swelling behaviour of the membranes can be further evaluated by investigating the correlation between the volume and the weight changes determined by water uptake at different temperatures. To this aim, the volume increase (ΔV), referred to 1 g of membrane previously equilibrated at 25 °C to 53% RH, is plotted in Fig. 6 as a function of the corresponding weight increase (ΔW).


image file: c6ra04676b-f6.tif
Fig. 6 Volume increase (ΔV) as function of the corresponding weight increase (ΔW) for FUM, FUM/ZP(PP)0.72, FUM/Z(PP)2 and FUM/ZP membranes equilibrated in liquid water at different temperatures; ΔV and ΔW refer to 1 g of anhydrous membrane, at 25 °C and 53% RH.

It can be observed that, in spite of some scatter, mainly due to the difficulty to measure the membrane thickness with high accuracy, the experimental points lie along the straight line with slope equal to 1 mL g−1, thus indicating that the density of the absorbed water is on average 1 g mL−1. These results suggest that when the membranes are equilibrated in liquid water at temperatures >25 °C, the excess of water, uptaken by the membrane with respect to that at 25 °C and 53% RH, behaves as liquid water, so that it is possible to foresee the volume swelling, just on the basis of the weight of absorbed water.

3.2.3 Membrane mechanical properties. Stress–strain mechanical tests were performed on the membrane samples, both at 25 °C – 53% RH and 70 °C – 80% RH. Fig. 7 shows representative stress–strain curves of some samples.
image file: c6ra04676b-f7.tif
Fig. 7 Stress–strain curves of FUM (a), FUM/ZP(PP)0.72-14 (b), FUM/ZP(PP)0.72-32 (c), at 25 °C and 53% RH (A); 70 °C and 80% RH (B).

The neat polymer shows a typical ductile behavior in both conditions; the sample elastically deforms until the yield point, then an irreversible plastic deformation starts to occur, associated with the neck formation: the stress then decreases and the neck propagates along the specimen at constant stress until break. As expected, the presence of the filler particles reduces the polymer ductility and modifies the curve profile, increasing the curve slope in the elastic region and the yield stress, and reducing the elongation at break. As already observed for perfluorosulfonic acid ionomers, the curve profiles are also affected by the experimental conditions, and, as a general trend, the samples become more flexible with increasing temperature and relative humidity, as a consequence of a reduction of both the intermolecular forces between the polymer chains and the interactions within the ionic clusters.6a,11 The values of the Young's modulus, at 25 °C – 53% RH and 70 °C – 80% RH, calculated from the curve slope at low strain values are shown in Table 2.

Table 2 Young's modulus (E) and water content (λ), determined at 25 °C to 53% RH and 70 °C to 80% RH, of FUM, FUM/ZP(PP)0.72, FUM/Z(PP)2 and FUM/ZP membranes
Membrane E (MPa) 25 °C 53% RH λ (±0.5) 25 °C 53% RH E (MPa) 70 °C 80% RH λ (±0.5) 70 °C 80% RH
FUM 1357 ± 40 4.5 1077 ± 63 7.2
FUM/ZP(PP)0.72-8 1447 ± 22 4.6 1107 ± 27 6.5
FUM/ZP(PP)0.72-14 1668 ± 116 5.2 1308 ± 8 6.9
FUM/ZP(PP)0.72-25 1845 ± 54 5.4 1420 ± 12 7.0
FUM/ZP(PP)0.72-32 2131 ± 68 5.6 1723 ± 42 7.3
FUM/Z(PP)2-12 1371 ± 59   1289 ± 8  
FUM/Z(PP)2-27 1557 ± 45   1250 ± 41  
FUM/Z(PP)2-36 1657 ± 32   1348 ± 30  
FUM/ZP-17 1497 ± 99   1191 ± 26  
FUM/ZP-26 1523 ± 43   1316 ± 25  
FUM/ZP-34 1656 ± 32   1214 ± 69  


It can be observed that FUM based membranes exhibits much higher values of Young's modulus than PFSA based membranes,6b,8b,12 owing to the presence of inflexible and bulky aromatic groups; moreover, the elastic modulus of the composites is in all cases ≥than that of the neat ionomer, and it generally increases with increasing the filler loading. To better evaluate the filler effect on the mechanical properties of the polymer matrix, the proportional increase of the Young's modulus against neat FUM (100 × ΔE/E) has been calculated and reported in Fig. 8.


image file: c6ra04676b-f8.tif
Fig. 8 Proportional increase of the Young's modulus for FUM/ZP(PP)0.72, FUM/Z(PP)2 and FUM/ZP membranes with different filler loadings at 25 °C and 53% RH, 70 °C and 80% RH.

The maximum proportional increase of the Young's modulus for the FUM/Z(PP)2 and FUM/ZP membrane is around 20% in both conditions, while it is higher than 30% for FUM/ZP(PP)0.72 membranes with filler loadings ≥25 wt%; in particular, (100 × ΔE/E) reaches around 60% with FUM/ZP(PP)0.72-32 both at 25 °C – 53% RH and 70 °C – 80% RH; by taking into account that in these conditions the hydration of FUM/ZP(PP)0.72 membranes is approximately the same as that of FUM, the higher elastic modulus of the composites can be completely ascribed to the polymer–filler interaction. It is also noteworthy that, even though a significant reduction of the plastic deformation is observed for the FUM/ZP(PP)0.72-32 sample, it however keeps a certain degree of flexibility and handleability, necessary for the realization of membrane-electrode-assembly systems.

In light of these results, it is possible to infer that the lower swelling in water of the composites, with respect to the neat ionomer, is due to their higher mechanical resistance; as previously described for PFSA membranes, higher values of elastic modulus result in a greater counter-elastic force of the ionomer matrix which more effectively counteracts the volume expansion due to water-uptake.13

3.2.4 Proton conductivity. The in-plane conductivity (σ) of composite membranes loaded with different amounts of ZP(PP)0.72, Z(PP)2 or ZP was determined by impedance measurements at 80 °C, with RH = 95% and 50%, and compared with that of an unmodified FUM membrane.

Fig. 9 shows that in all cases the conductivity decreases with increasing the filler loading and that FUM/ZP membranes are more conductive than the other membranes, especially at 50% RH and high filler loading, probably due to the larger proton concentration of the filler and its hydrophilic character.


image file: c6ra04676b-f9.tif
Fig. 9 Conductivity at 80 °C for composite FUM membranes as a function of filler loading: FUM (■, □), FUM/ZP (▲, △), FUM/ZP(PP)0.72 (●, ○) and FUM/Z(PP)2 (◆, ◇). The straight lines are the least square fits of the FUM, FUM/ZP(PP)0.72 and FUM/Z(PP)2 data at 95 and 50% RH.

On the other hand, both at 95 and 50% RH, log[thin space (1/6-em)]σ values of FUM/ZP(PP)0.72 and FUM/Z(PP)2 gather around a straight line, thus indicating that the conductivity of these membranes can be regarded as roughly independent of the filler composition.

Interestingly, the least-squares linear fit of the two sets of data gives two straight lines with the same slope (−0.01917 ± 0.00374 at 50% RH, and −0.01846 ± 0.00307 at 95% RH): as a consequence, for the same membrane, the proportional decrease in conductivity due to an RH change from 95 to 50% is, to a good approximation, independent of filler loading, while at each RH the FUM conductivity decreases by about the same factor for the same increase in filler loading.

Accordingly, in the plot of log[thin space (1/6-em)]σ versus RH (Fig. 10) the curves of FUM and FUM/ZP(PP)0.72-32 are nearly parallel in the RH range 50–95%. All these findings seem to indicate that the filler modifies the network of the FUM conduction pathways, in terms of reduced percolation and/or increased path tortuosity, without substantially altering their transport properties.


image file: c6ra04676b-f10.tif
Fig. 10 Conductivity at 80 °C as a function of RH for FUM (a) and FUM/ZP(PP)0.72-32 (b) membranes.

While ZP(PP)0.72 membranes are less conductive than the unmodified ionomer, they are mechanically stronger and undergo reduced swelling in water at temperature above 70 °C: therefore, above this temperature and in the presence of liquid water, their conductivity is expected to be more stable than that of the unmodified ionomer.

To check this hypothesis, conductivity measurements as a function of time were carried out on FUM and FUM/ZP(PP)0.72-32 membranes in the presence of supersaturated water vapour at RH = 110% (Fig. 11).


image file: c6ra04676b-f11.tif
Fig. 11 Conductivity as a function of time, in supersaturated water vapour (110% RH), for FUM at 80 °C (a) and at 100 °C (b), and for FUM/ZP(PP)0.72-32 at 110 °C (c) and 120 °C (d).

At 80 °C, the conductivity of FUM was around 0.2 S cm−1 and decreased by about 30% within 16 h, while a much faster decay (−75% in about 1 h) was observed for a second membrane at 100 °C. Due to the large conductivity decrease, the measurement was stopped and inspection of the conductivity cell showed that the membrane had changed into a gel. Differently, the conductivity of a FUM/ZP(PP)0.72-32 membrane turned out to be fairly stable at 110 °C for at least 25 h, and started to decrease when the temperature was raised to 120 °C. These findings are in good agreement with the swelling data. Interestingly, at 110 °C, the conductivity of FUM/ZP(PP)0.72-32 is close to 0.1 S cm−1, thus indicating that this membrane is suitable for operation at temperature well above 70 °C even in the presence of liquid water.

4 Conclusions

The synthetic approach based on the formation of zirconium phosphate phenylphosphonates from precursor solutions of zirconium propionate, phosphoric and phenylphosphonic acids allowed the preparation of dispersion-cast FUM composite membranes, by in situ precipitation of ZP(PP)0.72, ZP and Z(PP)2. In comparison with pure FUM, all the composites exhibited lower swelling in water, especially at temperatures ≥70 °C, higher Young' modulus, both at 25 °C to 53% RH and 70 °C to 80% RH, but lower proton conductivity at 80 °C, both at 50 and 95% RH.

Among the composites, the most interesting results were obtained for the membranes filled with ZP(PP)0.72. In particular, FUM/ZP(PP)0.72-32 exhibited the lowest swelling in water and the highest mechanical strength, thus suggesting that the co-presence of hydrophilic groups (–POH and –SO3H) and hydrophobic phenyl rings both on the filler and on the ionomer can promote a double hydrophilic/hydrophobic interaction between filler and ionomer, which is supposed to be stronger than that achievable with only hydrophilic (ZP) or hydrophobic (Z(PP)2) fillers. Finally, the decrease in conductivity, caused by the high filler loading, is offset by the ability of the composite membrane to withstand temperatures as high as 110 °C in the presence of liquid water with conductivity of the order of 0.1 S cm−1, which are of interest for application in electrochemical devices.

Acknowledgements

M. C. and C. Z. thank the University of Perugia (Fondo Ricerca di Base 2014 D. D. n. 170, 23/12/2014) for financial support.

References

  1. S. J. Peighambardoust, S. Rowshanzamir and M. Amjadi, Int. J. Hydrogen Energy, 2010, 35, 9349–9384 CrossRef CAS.
  2. J. Rozière and D. J. Jones, Annu. Rev. Mater. Res., 2003, 33, 503–555 CrossRef.
  3. J. Wang, Z. Yue and J. Economy, J. Membr. Sci., 2007, 291, 210–219 CrossRef CAS.
  4. (a) S. M. Javaid Zaidi, Research Trends in Polymer Electrolyte Membranes for PEMFC, in Polymer Membranes for Fuel Cells, ed. S. M. J. Zaidi and T. Matsuura, Springer Science + Business Media, LLC, 2009, ch. 2 Search PubMed; (b) S. Sambandam and V. Ramani, J. Power Sources, 2007, 170, 259–267 CrossRef CAS; (c) S. Sonpingkam and D. Pattavarakorn, Int. J. Chem. Eng. Appl., 2014, 5, 181–185 CAS; (d) A. Chandan, M. Hattenberger, A. El-kharouf, S. Du, A. Dhir, V. Self, B. G. Pollet, A. Ingram and W. Bujalski, J. Power Sources, 2013, 231, 264–278 CrossRef CAS; (e) S. J. Zaidi, S. D. Mikhailenko, G. P. Robertson, M. D. Guiver and S. Kaliaguine, J. Membr. Sci., 2000, 173, 17–34 CrossRef CAS.
  5. M. L. Di Vona, E. Sgreccia, A. Donnadio, M. Casciola, J. F. Chailan, G. Auer and P. Knauth, J. Membr. Sci., 2011, 369, 536–544 CrossRef CAS.
  6. (a) A. Donnadio, M. Pica, D. Capitani, V. Bianchi and M. Casciola, J. Membr. Sci., 2014, 462, 42–49 CrossRef CAS; (b) A. Donnadio, M. Pica, S. Subianto, D. J. Jones, P. Cojocaru and M. Casciola, ChemSusChem, 2014, 7, 2176–2184 CrossRef CAS PubMed; (c) X. Zhang, S. W. Tay, L. Hong and Z. Liu, J. Membr. Sci., 2008, 320, 310–318 CrossRef CAS; (d) E. Y. Safronova and A. B. Yaroslavtsev, Solid State Ionics, 2012, 221, 6–10 CrossRef CAS; (e) V. Di Noto, M. Piga, G. A. Giffin, M. Schuster, G. Cavinato, L. Toniolo and S. Polizzi, Chem. Mater., 2011, 23, 4452–4458 CrossRef CAS; (f) V. Di Noto, N. Boaretto, E. Negro and G. Pace, J. Power Sources, 2010, 195, 7734–7742 CrossRef CAS; (g) V. Di Noto, M. Bettiol, F. Bassetto, N. Boaretto, E. Negro, S. Lavina and F. Bertasi, Int. J. Hydrogen Energy, 2012, 37, 6169–6181 CrossRef CAS.
  7. W. J. Boo, L. Sun, J. Liu, A. Clearfield and H.-J. Sue, J. Phys. Chem. C, 2007, 111, 10377–10381 CAS.
  8. (a) G. Alberti, M. Casciola, M. Pica, T. Tarpanelli and M. Sganappa, Fuel Cells, 2005, 5, 366–374 CrossRef CAS; (b) G. Alberti, M. Casciola, D. Capitani, A. Donnadio, R. Narducci, M. Pica and M. Sganappa, Electrochim. Acta, 2007, 52, 8125–8132 CrossRef CAS.
  9. M. Casciola, A. Donnadio and P. Sassi, J. Power Sources, 2013, 235, 129–134 CrossRef CAS.
  10. (a) M. Pica, A. Donnadio, E. Troni, D. Capitani and M. Casciola, Inorg. Chem., 2013, 52, 7680–7687 CrossRef CAS PubMed; (b) M. Pica, A. Donnadio, R. D'Amato, D. Capitani, M. Taddei and M. Casciola, Inorg. Chem., 2014, 53, 2222–2229 CrossRef CAS PubMed.
  11. Y. Kawano, Y. Wang, R. A. Palmer and S. R. Aubuchon, Polim.: Cienc. Tecnol., 2002, 12, 96–101 CAS.
  12. (a) M. Casciola, D. Capitani, A. Donnadio, V. Frittella, M. Pica and M. Sganappa, Fuel Cells, 2009, 9, 381–386 CrossRef CAS; (b) M. Casciola, D. Capitani, A. Comite, A. Donnadio, V. Frittella, M. Pica, M. Sganappa and A. Varzi, Fuel Cells, 2008, 8, 217–224 CrossRef CAS.
  13. G. Alberti, R. Narducci and M. Sganappa, J. Power Sources, 2008, 178, 575–583 CrossRef CAS.

This journal is © The Royal Society of Chemistry 2016
Click here to see how this site uses Cookies. View our privacy policy here.