Excellent microwave absorption properties of Fe ion-doped SnO2/multi-walled carbon nanotube composites

Honglong Xing*, Zhenfeng Liu, Ling Lin, Lei Wang, Dexin Tan, Ying Gan, Xiaoli Ji and Guocai Xu
School of Chemical Engineering, Anhui University of Science and Technology, Huainan, Anhui Province 232001, P. R. China. E-mail: austxhl@163.com; Tel: +86-554-6668497

Received 20th February 2016 , Accepted 15th April 2016

First published on 20th April 2016


Abstract

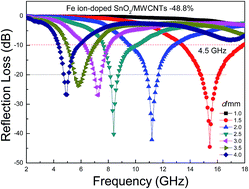
In this work, Fe ion-doped SnO2/multi-walled carbon nanotubes (MWCNTs) composites were synthesized using a hydrothermal method. X-ray diffraction, TEM, Raman and X-ray photoelectron spectroscopy, and vector network analyses were conducted to demonstrate the structure, interaction, morphology, chemical content, and electromagnetic parameters of the Fe ion-doped SnO2/MWCNTs composites. The as-structured Fe ion-doped SnO2/MWCNTs composites were proven to be outstanding lightweight microwave absorbers when the Fe ion doping percentage was relatively high. Fe ion doping at a molar percentage of 48.8% resulted in a maximum reflection loss (RL) of −44.5 GHz at 15.44 GHz with a layer thickness of 1.5 mm. The maximum RL ≤ −10 dB reached 4.5 GHz at the Ku band. The excellent microwave absorption of the as-prepared composites was principally due to proper attenuation and impedance matching, electric polarization, interfacial polarization, and conductive network. Such composites may have further applications in microwave absorption.

Introduction

Given the rapid development of electronic equipment and military supplies, microwave absorption materials have become a part of our daily lives. Low thickness, light weight, broad frequency, and strong absorption are requirements for ideal microwave absorption materials.1,2 Multi-walled carbon nanotubes (MWCNTs) are widely utilized in microwave absorption because of their light weight, high conductivity, and low filler loading ratio.3–5 Semiconductor oxides, such as ZnO,6 TiO2,7 and SnO2,8,9 result in improved microwave absorption because of their broad bandgap. The combination of conductivity loss absorbing materials and dielectric loss absorbing materials is tunable for the balance of complex permittivity and permeability to enhance the microwave absorption properties effectively.10,11 Previous research has shown that this type of composite can be extensively used in electromagnetic absorption.12,13

The absorption bandwidth is related to impedance, structure, and size. To date, Fe, Co, and Ni, as well as their alloys and magnetic nanoparticles, are widely explored for their potential to achieve a broad frequency range in effective microwave absorption.14 Magnetic materials usually have high density and ease of oxidation; most absorbers do not have excellent microwave absorption properties when they are a single component, so their applications are limited to microwave absorption.15,16 One way to effectively solve this problem is to synthesize hybrid structures, such as core–shell or flower-like structures. Zhang et al.17 synthesized ring-like sphere and flower-like sphere Fe3O4/graphene composites; their flower-like composites exhibited strong absorption and a relatively wide range of 7.9 GHz. Lv et al.18 synthesized core–shell CNT@Fe@SiO2, which has the largest effective microwave absorption bandwidth of 9.8 GHz. An et al.19 prepared shelled hollow microspheres of SiO2–Ni–carbon composites; a broad effective absorption bandwidth of 6.3 GHz can be obtained. Compared with Fe- and Ni-based magnetic materials, the effective microwave absorption bandwidth of Co-based materials is still narrow.20 Interestingly, Fe-based magnetic materials possess comparatively broader effective absorption frequency than Ni-based materials.21,22 Moreover, the effective bandwidth of Fe is slightly larger than that of Ni-based materials for some types of composites. Xiang et al.23 prepared magnetic carbon nanofibers containing Fe/Co/Ni nanoparticles, and their discussion showed that CNFs/Fe possess the largest effective microwave absorption bandwidth when reflection loss (RL) < −20 dB. However, some issues in their production, such as uncontrollable morphology, size, and complex processing, need to be addressed.

Metal ion doping is a useful way to enhance microwave absorption by adjusting the electromagnetic parameters, which can partially solve the complex post-processing of samples. Yan et al.24 synthesized iron-doped titanium nitride nanocrystals using calcination; the maximum RL reached −26.0 dB at 5.84 GHz, demonstrating the ferromagnetism and microwave electromagnetism properties of the nanocrystals. Duan et al.25 introduced Ni/Co-doped manganese dioxides and showed that Ni/Co doping has a certain effect on the dielectric properties. Few attempts have been made to improve the microwave absorption properties of SnO2/MWCNTs composites. Our previous work investigated the microwave absorption performance of Ni-doped SnO2@MWCNTs composites.26 The differences in radii of metal ions may exert various effects on microwave absorption. Therefore, in the present work, we further investigated Fe ion-doped SnO2/MWCNTs composites.

Fe ion-doped SnO2/MWCNTs composites were prepared through a hydrothermal method. The structure, morphology, and electromagnetic parameters in the range of 2–18 GHz were discussed in detail. Results indicated that the Fe ion-doped SnO2/MWCNTs composites have great potential in the field of microwave absorption and provide a basis for the development of lightweight broad-frequency microwave absorbers.

Materials and methods

All reagents were of analytical grade and used without further purification. MWCNTs were provided by Chengdu Organic Chemicals Co. Ltd. SnCl4·5H2O, ammonia, HCl, and Fe(NO3)3·9H2O were all supplied by Sinopharm Chemical Reagent Co., Ltd. Distilled water was produced in our laboratory.

Synthesis of the Fe ion-doped SnO2/MWCNTs composites: our method was similar to that described in the literature, including all conditions,26 except the doping amount of Fe(NO3)3·9H2O was according to the molar ratios (Fe3+[thin space (1/6-em)]:[thin space (1/6-em)]Fe3+ + Sn4+) of 16.2%, 29.2%, 39.8%, and 48.8%. The as-prepared Fe ion-doped SnO2/MWCNTs composites were washed with ethanol and distilled water and then dried in an oven for 24 h at 60 °C.

Characterization and measurement: field emission transmission electron microscopy (FEI, Tecnai G2 F20, USA) was conducted to characterize the morphology of the Fe ion-doped SnO2/MWCNTs composites. The diffraction data of the as-prepared composites were characterized by X-ray diffraction (XRD; LabX XRD-6000, Shimadzu, Japan) in the range of 20–80° with the scan speed of 4° min−1 using Cu Kα (λ = 1.54 Å). Raman spectra of the Fe ion-doped SnO2/MWCNTs composites were obtained on LabRAM-HR (Horiba Jobin Yvon, France) equipped with a 514 nm laser. X-ray photoelectron spectroscopy (XPS; Thermo ESCALAB 250XI, USA) was conducted using a monochromatic Al Kα X-ray source. The as-obtained samples with paraffin wax in a molar ratio of 3[thin space (1/6-em)]:[thin space (1/6-em)]1 were pressed into a ring-like compact structure (7.0 mm outer diameter, 3.0 mm inner diameter). The electromagnetic parameters of these samples were then determined. Measurements were conducted within the range of 2–18 GHz via vector network analysis (AV3629D, China). RL of different Fe ion doping contents on the SnO2/MWCNTs–paraffin composites was calculated using the following equation:27–29

 
image file: c6ra04589h-t1.tif(1)
where Zin is the normalized input impedance, which can be deduced from the formula below:
 
image file: c6ra04589h-t2.tif(2)
where μr and εr are the complex permeability (μr = μ′ − ′′) and complex permittivity (εr = ε′ − ′′), respectively; c is the velocity of light; f is the frequency of electromagnetic wave; and d is the thickness of the absorber.

Results and discussion

The crystal structures of the as-prepared Fe ion-doped SnO2/MWCNTs composites were examined using wide-angle XRD (Fig. 1). As shown in Fig. 1, the four main peaks located at 2θ = 26.4°, 34.0°, 37.6°, and 52.2° referred to the (110), (101), (200), and (211) planes of the Fe ion-doped SnO2/MWCNTs composites. The curves of the SnO2/MWCNTs composites doped with different Fe ion contents exhibited a similar trend to those of pure SnO2 (JPCDS 41-1445) in the black vertical bars. This finding indicated that Fe ion doping did not damage the structure of SnO2/MWCNTs. Meanwhile, no species of Fe and its oxide were detected, possibly because of the very small size or low content of Fe species, the scattered distribution of Fe oxides, or the limitations of instrument detection. Interestingly, the (110) plane of the four composites corresponded well with the standard card, and its angle was constant. Furthermore, the (101) and (200) planes moved slightly to the right, whereas the (211) plane evidently moved to the right. The intensity of the (110) plane decreased and the intensity of the (101) plane increased. This finding showed that the lattice constant of the as-synthesized samples varied with increasing doping content, but the structure was not damaged. The radius of Fe3+ (0.64 Å) is smaller than that of Sn4+ (0.71 Å), which may cause the Fe atoms to substitute the Sn atoms to some extent.26,30 The lattice constants of the Fe ion-doped SnO2/MWCNTs composites are illustrated in Table 1. As the Fe ion doping content increased, the lattice constants of the SnO2/MWCNTs decreased, which may be due to the difference in radii between the Sn and Fe atoms. Therefore, the XRD patterns revealed that the Fe ions were successfully incorporated into the SnO2/MWCNTs composites when the doping content was relatively high.
image file: c6ra04589h-f1.tif
Fig. 1 XRD pattern of Fe ion-doped SnO2/MWCNTs composites with different doping contents.
Table 1 Lattice constant of Fe ion-doped SnO2/MWCNTs composites with different doping contents
Samples Lattice constant
a = b (Å) c (Å)
16.2% Fe ion-doped SnO2/MWCNTs 4.7426 3.1589
29.2% Fe ion-doped SnO2/MWCNTs 4.7043 3.1208
39.9% Fe ion-doped SnO2/MWCNTs 4.7050 3.1065
48.8% Fe ion-doped SnO2/MWCNTs 4.6892 3.0790


The interior structures of the as-prepared Fe ion-doped SnO2/MWCNTs composites were analyzed by TEM [Fig. 2(a) and (b)] and HRTEM [Fig. 2(c)]. As shown in Fig. 2(b), the SnO2 nanoparticles decorated on the MWCNTs displayed a size of 3–5 nm, which was consistent with our previous work.26 However, Fe ion doping generated some agglomeration on the surface of the MWCNTs [Fig. 2(a)], which may enhance the microwave absorption performance of Fe ion-doped SnO2@MWCNTs. Some SnO2 nanoparticles were assembled on the MWCNTs after Fe ion doping and resulted in the formation of grape-like structures.4 This unique structure allowed the charge transfer between SnO2 nanoparticles and MWCNTs with minimal hindrance,16 as well as favored the formation of a conductive network. Moreover, this structure caused more interfaces than Ni doping; the said interfaces may strongly influence the microwave absorption properties of Fe ion-doped SnO2@MWCNTs composites. Meanwhile, some SnO2 nanoparticles were scattered outside of the MWCNTs, making the surface rough.


image file: c6ra04589h-f2.tif
Fig. 2 (a and b) TEM and (c) HRTEM of the Fe ion-doped SnO2/MWCNTs; (d) EDS spectrum of the Fe ion-doped SnO2/MWCNTs.

The HRTEM image of the Fe ion-doped SnO2/MWCNTs composites is shown in Fig. 2(c). According to calculations from the planes of the Fe ion-doped SnO2/MWCNTs composites, three different planes were observed in the HRTEM image. Specifically, 0.33 nm represented the (002) plane in the MWCNTs. Moreover, 0.32 and 0.25 nm belonged to the (110) and (101) planes of SnO2, respectively. No Fe species plane was detected by HRTEM, indicating that Fe ion doping did not change the structure of the Fe ion-doped SnO2/MWCNTs composites. The EDS spectrum showed elemental C, O, Sn, and Fe in the composites of the Fe ion-doped SnO2/MWCNTs in Fig. 2(d). In line with the atom content in EDS, the Fe to Fe and Sn atomic ratio was 0.38, which was close to the raw material ratio of 0.49. Thus, the iron and tin sources were involved in the reaction.

To further verify the incorporation of Fe ions in the SnO2/MWCNTs composites and the valence states of the elements on the as-synthesized product, XPS was conducted. The survey spectrum of Fig. 3(a) verified the elements of C, O, Sn, and Fe in the as-prepared Fe ion-doped SnO2/MWCNTs composites. Fig. 3(b) depicts the line of C 1s in the binding energy range of 280–300 eV, which was deconvoluted into four main peaks. These peaks indicated four different species of C in the Fe ion-doped SnO2/MWCNTs composites. The binding energies at 284.6, 285.0, 285.9, and 289.5 eV were assigned to the C[double bond, length as m-dash]C, C[double bond, length as m-dash]O, C–O–C, and –COO types, respectively.26 For the O 1s level of the Fe ion-doped SnO2/MWCNTs composites in Fig. 3(c), the peaks located at 530.6, 531.2, and 532.3 eV corresponded to the bonds of C[double bond, length as m-dash]O, C–O, and Fe–O, respectively.31 Furthermore, the binding energies of 487.1 and 495.5 eV in Fig. 3(d) reflected the characteristic peaks of Sn 3d3/2 and Sn 3d5/2, respectively; this finding suggested that SnO2 was present in the Fe ion-doped SnO2/MWCNTs composites.32 In particular, the oxidation state of Fe atom was resolved in Fig. 3(e), which clearly revealed Fe 2p3/2 and Fe 2p1/2 of the Fe level. The Fe 2p peak positions situated at 712.6 and 725.9 eV referred to Fe 2p3/2 and Fe 2p1/2, signifying the oxidation state of +3 in Fe atoms.21 As reported, no metallic Fe or FeO was observed in the as-prepared composites, which showed peaks of Fe 2p1/2 at 719.9 eV and Fe 2p3/2 at 706.7 eV in metallic Fe, as well as FeO at 722.3 and 709.3 eV.33,34 The peak at 711.4 eV could also be assigned to Fe 2p3/2; simultaneously, satellite lines of Fe 2p3/2 appeared at 714.3 eV.35–37 The binding energy at 717.5 eV could be related to the satellite peak of Fe 2p3/2.38 However, the peak with the binding energy of 716.2 eV could be concluded as the level of Sn 3p overlapped with the spectrum line of Fe 2p, which was inevitable in measurements. As discussed above, Fe ions were incorporated into SnO2/MWCNTs with the oxidation state of +3. According to the integral area of the line of Fe 2p and the atomic ratio of Fe in the composites of 4.1%, the Fe–O content in the as-prepared Fe ion-doped SnO2/MWCNTs composites was approximately 2.3%.


image file: c6ra04589h-f3.tif
Fig. 3 XPS spectra of (a) the Fe ion-doped SnO2/MWCNTs; (b) high-resolution C 1s, (c) O 1s, (d) Sn 3d, and (e) Fe of the Fe ion-doped SnO2/MWCNTs.

Raman spectroscopy is a useful tool to confirm the interaction between the components in the Fe ion-doped SnO2/MWCNTs composites. The Raman spectrum of the Fe ion-doped SnO2/MWCNTs composites is shown in Fig. 4. The three main peaks at 1349.6, 1579.6, and 2696.3 cm−1 were associated with the bands of D, G, and 2D, respectively. The D band originates from the defects in graphene, the G band is attributed to the stretching mode of sp2 carbon atoms, and the 2D band is the double resonance feature induced by the defects in graphene sheets.39 Compared with the Raman spectrum of SnO2/MWCNTs in our previous work, the three main peaks all moved slightly toward the left, and the value of ID/IG was 0.82, which was higher than that of SnO2/MWCNTs.26 These small changes indicated that Fe ion doping did not change the structure of SnO2/MWCNTs but strengthened the interactions between SnO2 and MWCNTs.


image file: c6ra04589h-f4.tif
Fig. 4 Raman spectrum of Fe ion-doped SnO2/MWCNTs composites.

Microwave absorption of the Fe ion-doped SnO2/MWCNTs–paraffin composites was closely related to complex permittivity εr (εr = ε′ − ′′) and permeability μr (μr = μ′ − ′′). The real parts ε′ and μ′ represent the storage capability of energy for the electric and magnetic energies, respectively; the imaginary parts ε′′ and μ′′ imply the loss of electrical and magnetic energies, respectively.40,41 A proper balance between εr and μr can enhance the microwave absorption of an electromagnetic wave absorber. Fig. 5 illustrates the values of ε′, ε′′, μ′, and μ′′ of the Fe ion-doped SnO2/MWCNTs–paraffin composites versus frequency in the range of 2–18 GHz. As shown in Fig. 5(a) and (b), ε′ decreased for different contents of Fe ion doping as the frequency increased in the range of 2–18 GHz. The value of ε′ was in the range of 25.2–10.8 for the four composites. Notably, ε′ and ε′′ of the 29.2% Fe ion-doped SnO2/MWCNTs were the highest among the four composites [Fig. 5(b)]. High ε′ indicates more storage of electric energy, which results from the polarizations among the interfaces on the MWCNTs and dipolar polarization caused by SnO2 particles.4 The value of ε′′ fluctuated in the range of 13.9–5.19 for the four composites, with four similar multiple peaks, thereby suggesting multiple resonance behavior.8 High ε′′ or high loss ability of electric energy indicates high conductivity of the samples, resulting in electric polarization.42 In particular, high ε does not indicate good microwave absorption.26,43,44 Therefore, an appropriate ε is necessary.


image file: c6ra04589h-f5.tif
Fig. 5 Frequency dependence of (a) the real and (b) imaginary parts of complex permittivity; (c) the real and (d) imaginary parts of complex permeability; and (e) dielectric loss tangent and (f) magnetic loss tangent for the Fe ion-doped SnO2/MWCNTs–paraffin composites at different Fe ion contents.

Fig. 5(c) and (d) depict the values of μ′ and μ′′ of different Fe ion-doped SnO2/MWCNTs–paraffin composites. Notably, the value of μ′ was nearly 1, and μ′′ was almost maintained at 0 in the whole spectra, indicating the weak magnetic properties of the Fe ion-doped SnO2/MWCNTs.

The dielectric loss tangent (tan[thin space (1/6-em)]δe = ε′′/ε′) and magnetic loss tangent (tan[thin space (1/6-em)]δm = μ′′/μ′) are critical parameters for microwave absorbers because they evaluate electromagnetic wave absorption. High loss tangent can enhance microwave absorption. Fig. 5(e) and (f) represent the curves of tan[thin space (1/6-em)]δe and tan[thin space (1/6-em)]δm of the Fe ion-doped SnO2/MWCNTs composites. The value of tan[thin space (1/6-em)]δe (both above 0.4) was much higher than the value of tan[thin space (1/6-em)]δm (almost around 0), showing that the Fe ion-doped SnO2/MWCNTs composites mainly functioned as dielectric loss microwave absorbers. As the ratio of Fe ion doping increased, tan[thin space (1/6-em)]δe rose and tan[thin space (1/6-em)]δm declined in the range of 2–18 GHz. Among the four composites, the high values of tan[thin space (1/6-em)]δe with 29.2% Fe ion doping were not defined as the best microwave absorption performance, which may be due to the relatively high complex permittivity. The 48.8% Fe ion-doped SnO2/MWCNTs composites exhibited the lowest tan[thin space (1/6-em)]δe. Moreover, proper impedance matching properties were obtained as complex permittivity was similar to complex permeability, leading to optimal microwave absorption.

The microwave absorption of the Fe ion-doped SnO2/MWCNTs–paraffin composites was further evaluated. The attenuation constant α plays an important role in microwave absorbers based on the following formula:23,45

 
image file: c6ra04589h-t3.tif(3)
where f is the frequency of the electromagnetic wave. Fig. 6(a) shows the relationship between the attenuation constant of the Fe ion-doped SnO2/MWCNTs–paraffin composites and frequency within the whole field of 2–18 GHz. The 29.2% Fe ion-doped SnO2/MWNTs demonstrated relatively higher α than the other three composites, whereas the 48.8% Fe ion-doped SnO2/MWNTs showed the best microwave absorption caused by appropriate impedance matching.


image file: c6ra04589h-f6.tif
Fig. 6 Attenuation constant (a) and impedance matching at the thickness of 1.5 mm with different contents (b) of Fe ion-doped SnO2/MWCNTs–paraffin composites.

Good impedance matching requires that the values of εr and μr should be as close to each other as possible, which can also be represented by the impedance matching degree Δ in the following equations:46–48

 
Δ = |sinh2(Kfd) − M| (4)
 
image file: c6ra04589h-t4.tif(5)
 
image file: c6ra04589h-t5.tif(6)
 
image file: c6ra04589h-t6.tif(7)
 
image file: c6ra04589h-t7.tif(8)
where d and f correspond to the thickness of the absorber and frequency of the electromagnetic wave, respectively, and d is 1.5 mm. In general, the electromagnetic wave mostly enters the absorber when Δ is zero; thus, the product achieves good impedance matching and results in enhanced microwave absorption.47 However, if impedance matching and attenuation constant are imbalanced, the microwave absorption performance of the absorber may be poor.46 Fig. 6(b) depicts the impedance matching degree of the Fe ion-doped SnO2/MWCNTs–paraffin composites at a layer thickness of 1.5 mm. The value of Δ for the 29.2% Fe ion-doped SnO2/MWCNTs composites was the smallest (0.15) among the four composites; an imbalance between the high attenuation and low impedance matching degree may result in poor microwave absorption. By contrast, for the 48.8% Fe ion-doped SnO2/MWCNTs composites, Δ was 0.35; a proper balance between the low attenuation and relatively high Δ may result in superior microwave absorption.

The microwave absorption performance of the Fe ion-doped SnO2/MWCNTs–paraffin composites could be further determined by the RL calculated in Fig. 7. Fig. 7 shows the RL curves of the Fe ion-doped SnO2/MWCNTs–paraffin composites for different Fe ion doping contents at different thicknesses in the range of 2–18 GHz.


image file: c6ra04589h-f7.tif
Fig. 7 RL versus frequency of the Fe ion-doped SnO2/MWCNTs–paraffin composites for different Fe ion doping contents at different thicknesses: (a) 16.2% Fe ion doping percentage; (b) 29.2% Fe ion doping percentage; (c) 39.9% Fe ion doping percentage; and (d) 48.8% Fe ion doping percentage.

Fig. 7(a)–(d) show that all the RL curves moved to the low frequency regions as the thicknesses increased. Both Fig. 7(a) and (b) show that the microwave absorption performance of the 16.2% and 29.2% Fe ion-doped SnO2/MWCNTs composites was poor, with maximum RLs of −13.1 dB at 8.48 GHz and −11.8 dB at 11.6 GHz, respectively. Such poor performance was caused by the imbalance between impedance matching and attenuation constant. Impedance matching determines the energy that enters microwave absorbers, whereas the attenuation constant decides the energy dissipated in the absorber. These two factors determine microwave absorption, so the balance between them is crucial.49 When the Fe ion doping content reached 39.9%, microwave absorption improved [Fig. 7(c) vs. Fig. 7(a) and (b)]. The maximum RL reached −22.5 dB at 13.6 GHz with a thickness of 1.5 mm, and the maximum width of RL ≤ −10 dB was achieved at 4.0 GHz. As the Fe ion doping content further increased to 48.8%, the microwave absorption of the composites enhanced significantly with regard to both the maximum RL and the effective absorption width as a result of the proper balance between impedance matching and attenuation constant. As shown in Fig. 7(d), the maximum RL decreased to −44.5 dB at 15.44 GHz with a layer thickness of 1.5 mm and the effective absorption width of RL ≤ −10 dB reached 4.5 GHz. The absorption performance of the other thicknesses was also enhanced, which indicated that the 48.8% Fe ion-doped SnO2/MWCNTs composites possessed excellent microwave absorption properties.

The excellent microwave absorption of the 48.8% Fe ion-doped SnO2/MWCNTs–paraffin composites was due to several aspects. The possible mechanism of microwave absorption is illustrated in Fig. 8. First, the oxygen defects in the composites can serve as polar centers and introduce more electric polarization, which can enhance microwave absorption.9,50 The improved microwave absorption causes more interfacial polarization and benefits from the multiple interfaces among MWCNTs, SnO2 nanoparticles, and Fe ions.9 Second, Fe ion doping can effectively reduce the complex permittivity of the composites. A proper balance between impedance matching and attenuation constant is attained with a relatively high Fe ion doping content and leads to enhanced microwave absorption properties. Third, the smaller radii of Fe atoms than Sn atoms allow the Fe atoms to substitute the Sn atoms to some degree, resulting in optimal microwave absorption under high Fe ion doping content.26 The high conductivity of MWCNTs is essential to form a conductive network for improving microwave absorption of the as-prepared composites; electron hopping and migration (Fig. 8) form the key link in the conductive network of the Fe ion-doped SnO2/MWCNTs.4,51 Notably, Fe ion doping generated grape-like special structures, which contributed to the easy formation of a conductive network and produced more interfaces. Such interfaces enhanced the microwave absorption properties of Fe ion-doped SnO2@MWCNTs composites in terms of the absorption intensity and effective absorption bandwidth. These results suggested that the Fe ion-doped SnO2/MWCNTs composites could be further utilized in electromagnetic wave absorption because of their light weight and strong absorption capabilities.


image file: c6ra04589h-f8.tif
Fig. 8 Schematic of the possible electromagnetic wave absorption mechanism of the Fe ion-doped SnO2/MWCNTs–paraffin composites.

Conclusion

In summary, Fe ion-doped SnO2/MWCNTs composites were designed using a hydrothermal method, and the microwave absorption of different contents of Fe ion doping was investigated in the range of 2–18 GHz. Our study showed that the 48.8% Fe ion-doped SnO2/MWCNTs–paraffin composites represented superior microwave absorption because of the synergistic effects among attenuation and impedance matching, electric polarization, interfacial polarization, and conductive network. The microwave absorption properties of the 48.8% Fe ion-doped composites could be extended to −44.5 dB at 15.44 GHz with a layer thickness of 1.5 mm. Such composites also displayed an effective absorption bandwidth of 4.5 GHz (RL ≤ −10 dB) in the Ku band. Therefore, the smart microwave absorption properties of the Fe ion-doped SnO2/MWCNTs–paraffin composites with high efficiency, wide band, and thin thickness have potential for further investigations on microwave absorption.

Acknowledgements

This work was financially supported by the Natural Science Foundation of China (Grant No. 51477002; 51173002) and the Doctor's Start-up Research Foundation of Anhui University of Science and Technology.

References

  1. C. H. Wang, Y. J. Ding, Y. Yuan, X. D. He, S. T. Wu, S. Hu, M. C. Zhou, W. Q. Zhao, L. S. Yang, A. Y. Cao and Y. B. Li, J. Mater. Chem. C, 2015, 3, 11893–11901 RSC.
  2. H. B. Yang, T. Ye and Y. Lin, RSC Adv., 2015, 5, 103488–103493 RSC.
  3. H. C. Ling, L. T. Hu, Z. T. Kai, L. H. Guang, L. L. Hao and Z. W. Juan, New Carbon Mater., 2013, 3, 184–190 Search PubMed.
  4. M. M. Lu, M. S. Cao, Y. H. Chen, W. Q. Cao, J. Liu, H. L. Shi, D. Q. Zhang, W. Z. Wang and J. Yuan, ACS Appl. Mater. Interfaces, 2015, 7, 19408–19415 CAS.
  5. Y. H. Chen, Z. H. Huang, M. M. Lu, W. Q. Cao, J. Yuan, D. Q. Zhang and M. S. Cao, J. Mater. Chem. A, 2015, 3, 12621–12625 CAS.
  6. M. Najim, G. Modi, Y. K. Mishra, R. Adelung, D. Singh and V. Agarwala, Phys. Chem. Chem. Phys., 2015, 17, 22923–22933 RSC.
  7. T. Xia, C. Zhang, N. A. Oyler and X. B. Chen, Adv. Mater., 2013, 25, 6905–6910 CrossRef CAS PubMed.
  8. B. Zhao, B. B. Fan, G. Shao, W. Y. Zhao and R. Zhang, ACS Appl. Mater. Interfaces, 2015, 7, 18815–18823 CAS.
  9. B. Zhao, B. B. Fan, Y. W. Xu, G. Shao, X. D. Wang, W. Y. Zhao and R. Zhang, ACS Appl. Mater. Interfaces, 2015, 7, 26217–26225 CAS.
  10. L. Zhang, X. H. Zhang, G. J. Zhang, Z. Zhang, S. Liu, P. F. Li, Q. L. Liao, Y. G. Zhao and Y. Zhang, RSC Adv., 2015, 5, 10197–10203 RSC.
  11. T. K. Gupta, B. P. Singh, V. N. Singh, S. Teotia, A. P. Singh, I. Elizabeth, S. R. Dhakate, S. K. Dhawan and R. B. Mathur, J. Mater. Chem. A, 2014, 2, 4256–4263 CAS.
  12. Y. F. Zhu, Q. Q. Ni and Y. Q. Fu, RSC Adv., 2015, 5, 3748–3756 RSC.
  13. X. S. Qi, Y. Deng, W. Zhong, Y. Yang, C. Qin, C. Au and Y. W. Du, J. Phys. Chem. C, 2010, 114, 808–814 CAS.
  14. A. Ansari and M. J. Akhtar, RSC Adv., 2016, 6, 13846–13857 RSC.
  15. M. K. Han, X. W. Yin, S. Ren, W. Y. Duan, L. T. Zhang and L. F. Chang, RSC Adv., 2016, 6, 6467–6474 RSC.
  16. X. Jian, B. Wu, Y. F. Wei, S. X. Dou, X. L. Wang, W. D. He and N. Mahmood, ACS Appl. Mater. Interfaces, 2016, 8, 6101–6109 CAS.
  17. R. Zhang, X. X. Huang, B. Zhong, L. Xia, G. W. Wen and Y. Zhou, RSC Adv., 2016, 6, 16952–16962 RSC.
  18. H. L. Lv, G. B. Ji, H. Q. Zhang and Y. W. Du, RSC Adv., 2015, 5, 76836–76843 RSC.
  19. Z. G. An and J. J. Zhang, Dalton Trans., 2016, 45, 2881–2887 RSC.
  20. T. Liu, X. B. Xie, Y. Pang and S. Kobayashi, J. Mater. Chem. C, 2016, 4, 1727–1735 RSC.
  21. F. B. Meng, W. Wei, X. N. Chen, X. L. Xu, M. Jiang, L. Jun, Y. Wang and Z. W. Zhou, Phys. Chem. Chem. Phys., 2016, 18, 2510–2516 RSC.
  22. T. Wu, Y. Liu, X. Zeng, T. T. Cui, Y. T. Zhao, Y. N. Li and G. X. Tong, ACS Appl. Mater. Interfaces, 2016, 8, 7370–7380 CAS.
  23. J. Xiang, J. L. Li, X. H. Zhang, Q. Ye, J. H. Xu and X. Q. Shen, J. Mater. Chem. A, 2014, 2, 16905–16914 CAS.
  24. C. Yan, X. Q. Cheng, Y. Zhang, D. Z. Yin, C. H. Gong, L. G. Yu, J. W. Zhang and Z. J. Zhang, J. Phys. Chem. C, 2012, 116, 26006–26012 CAS.
  25. Y. P. Duan, Z. Liu, H. Jing, Y. H. Zhang and S. Q. Li, J. Mater. Chem., 2012, 22, 18291–18299 RSC.
  26. L. Lin, H. L. Xing, R. W. Shu, L. Wang, X. L. Ji, D. X. Tan and Y. Gan, RSC Adv., 2015, 5, 94539–94550 RSC.
  27. T. K. Zhao, C. L. Hou, H. Y. Zhang, R. X. Zhu, S. F. She, J. G. Wang, T. H. Li, Z. F. Liu and B. Q. Wei, Sci. Rep., 2014, 4, 5619 CAS.
  28. A. Shah, A. Ding, Y. H. Wang, L. Zhang, D. X. Wang, J. Muhammad, H. Huang, Y. P. Duan, X. L. Dong and Z. D. Zhang, Carbon, 2016, 96, 987–997 CrossRef CAS.
  29. C. Y. Cui, P. P. Zhou, N. D. Wu, Y. H. Lv and X. G. Liu, Mater. Lett., 2015, 161, 325–327 CrossRef CAS.
  30. L. P. Chikhale, J. Y. Patil, A. V. Rajgure, F. I. Shaikh, I. S. Mulla and S. S. Suryavanshi, Measurement, 2014, 57, 46–52 CrossRef.
  31. X. Tang, R. Y. Jia, T. Zhai and H. Xia, ACS Appl. Mater. Interfaces, 2015, 7, 27518–27525 CAS.
  32. A. S. Ganeshraja, A. S. Clara, K. Rajkumar, Y. J. Wang, Y. Wang, J. H. Wang and K. Anbalagan, Appl. Surf. Sci., 2015, 353, 553–563 CrossRef CAS.
  33. S. Manna, A. K. Deb, J. Jagannath and S. K. De, J. Phys. Chem. C, 2008, 112, 10659–10662 CAS.
  34. X. Xie, C. G. Hu, D. L. Guo, H. Hua, T. J. Liu and P. Jiang, J. Phys. Chem. C, 2012, 116, 23041–23046 CAS.
  35. K. Fominykh, P. Chernev, I. Zaharieva, J. Sicklinger, G. Stefanic, M. Döblinger, A. Müller, A. Pokharel, S. Böcklein, C. Scheu, T. Bein and D. F. Rohlfing, ACS Nano, 2015, 9, 5180–5188 CrossRef CAS PubMed.
  36. L. F. Gao, T. Wen, J. Y. Xu, X. P. Zhai, M. Zhao, G. W. Hu, P. Chen, Q. Wang and H. L. Zhao, ACS Appl. Mater. Interfaces, 2016, 8, 617–624 CAS.
  37. Y. K. Hsu, Y. C. Chen and Y. G. Lin, ACS Appl. Mater. Interfaces, 2015, 7, 14157–14162 CAS.
  38. Z. X. Yang, W. Zhong, C. T. Au, X. Du, H. A. Song, X. S. Qi, X. J. Ye, M. H. Xu and Y. W. Du, J. Phys. Chem. C, 2009, 113, 21269–21273 CAS.
  39. B. Bateer, L. Wang, L. Zhao, P. Yu, C. G. Tian, K. Pan and H. G. Fu, RSC Adv., 2015, 5, 60135–60140 RSC.
  40. Y. Y. Lü, Y. T. Wang, H. L. Li, Y. Lin, Z. Y. Jiang, Z. X. Xie, Q. Kuang and L. S. Zheng, ACS Appl. Mater. Interfaces, 2015, 7, 13604–13611 Search PubMed.
  41. Y. X. Huang, Y. Wang, Z. M. Li, Z. Yang, C. H. Shen and C. C. He, J. Phys. Chem. C, 2015, 118, 26027–26032 Search PubMed.
  42. B. Zhao, W. Y. Zhao, G. Shao, B. B. Fan and R. Zhang, ACS Appl. Mater. Interfaces, 2015, 7, 12951–12960 CAS.
  43. F. Wu, A. Xie, M. X. Sun, Y. Wang and M. Y. Wang, J. Mater. Chem. A, 2015, 3, 14358–14369 CAS.
  44. G. X. Tong, F. T. Liu, W. H. Wu, F. F. Du and J. G. Guan, J. Mater. Chem. A, 2014, 2, 7373–7382 CAS.
  45. H. L. Lv, X. H. Liang, G. B. Ji, H. Q. Zhang and Y. W. Du, ACS Appl. Mater. Interfaces, 2015, 7, 9776–9783 CAS.
  46. X. Y. Hong, Q. Wang, Z. H. Tang, W. Q. Khan, D. W. Zhou and T. F. Feng, J. Phys. Chem. C, 2016, 120, 148–156 CAS.
  47. Z. Ma, Y. Zhang, C. T. Cao, J. Yuan, Q. F. Liu and J. B. Wang, Phys. B, 2011, 406, 4620–4624 CrossRef CAS.
  48. X. Y. Yuan, L. F. Cheng, L. Kong, X. W. Yin and L. T. Zhang, J. Alloys Compd., 2014, 596, 132–139 CrossRef CAS.
  49. Q. L. He, T. T. Yuan, X. Zhang, X. R. Yan, J. Guo, D. W. Ding, M. A. Khan, D. P. Young, A. Khasanov, Z. P. Luo, J. R. Liu, T. D. Shen, X. Y. Liu, S. Y. Wei and Z. H. Guo, J. Phys. Chem. C, 2014, 118, 24784–24796 CAS.
  50. Y. F. Wang, D. L. Chen, X. Yin, P. Xu, F. Wu and M. He, ACS Appl. Mater. Interfaces, 2015, 7, 26226–26234 CAS.
  51. M. Verma, P. Verma, S. K. Dhawan and V. Choudhary, RSC Adv., 2015, 5, 97349–97358 RSC.

This journal is © The Royal Society of Chemistry 2016