DOI:
10.1039/C6RA04535A
(Paper)
RSC Adv., 2016,
6, 51205-51210
Controlling nanoflake motion using stiffness gradients on hexagonal boron nitride
Received
20th February 2016
, Accepted 19th May 2016
First published on 20th May 2016
Abstract
Durotaxis has been emerging as a novel technique for manipulating directional motion of nanoscale particles. Two-dimensional materials with low surface friction, such as hexagonal boron nitride (hBN), are well-suited to serve as a platform for solid–solid transportations or manipulations. Here we employ molecular dynamics simulations to explore the feasibility of utilizing a stiffness gradient on a large hBN substrate to control the motion of a small hBN or graphene nanoflake on it. Our attempts to systematically investigate the mechanism of durotaxis-induced transportation are centered on the fundamental driving mechanism of the motion and the quantitative effect of significant parameters such as stiffness gradient, substrate temperature, and material of the nanoflake on its motion. Simulation results have demonstrated that, while the stiffness gradient plays a pivotal role in the evolution of the motion of the nanoflake on the substrate surface, the temperature of the substrate greatly influences the behavior of the nanoflake as well. There is no significant difference in directional motion between hBN and graphene nanoflakes on the hBN substrate. An interesting relation between the effective driving force and the stiffness gradient has been quantitatively captured by employing steered molecular dynamics. These findings will provide fundamental insights into the motion of nanodevices on a solid surface due to durotaxis, and will offer a novel view for manipulating directional motion of nanoscale particles on a solid surface.
Introduction
As nanoscience and nanotechnology rapidly advance, experimental techniques for the manipulation of materials at the nanoscale have gained unparalleled accuracy, as reflected in the development and utilization of atomic force microscopy,1–3 magnetic and optical tweezers,4–7 and nanoindentation,8,9 to name a few. There are many routes for this manipulation: chemical,10 mechanical,11 electrostatic,12 ultrasonic13 and surface dynamic14 interactions etc. Recently, tremendous efforts have been devoted to investigating methods of impetus which require no external energy beyond that of fabrication; here we present motion derived from a stiffness gradient, or durotaxis. Durotaxis is a term coined by Lo et al.15 to define the directed motion of cells along stiffness gradients; in this manuscript we more broadly apply the term to any directed motion generated by a difference in environmental stiffness. Similar to the thermophoretic effect,16 the driving force of durotaxis likely arises from non-symmetric phonon effects between the opposite edges of the chosen vehicle.17 An induced stiffness gradient can provide more sensitivity in manipulating structures than mechanically-inclined methods such as atomic force microscopy, optic tweezers, or nano pipettes.
Two-dimensional nanomaterials which have an in-plane homogenous sp2 hexagonal crystalline structure, such as graphene or hexagonal boron nitride sheets, seem tailor-made for gradient-induced motion, as they are exceptionally flat and have very low frictional coefficients. Carbon–carbon sliding, especially in the form of carbon nanotube bearings, has been studied extensively.16,18–23 There has been some work on strain-related motion performed with planar graphene,24–26 but to the best knowledge of the authors, there has been no research investigating the effect of stiffness gradients on the similar structure of hexagonal boron nitride (hBN), which may prove to be a more useful candidate for durotaxis manipulation in some cases due to its insulative properties and similar mechanical strength. Stiffness-gradient induced two-dimensional nanomaterial sliding has multiplex applications, from the precise positioning of material flakes to rapid, controlled motion of nanoparticles of various geometries. In order to better use this many-faceted and multipurpose technique to its full capacity, persistent efforts to unravel the fundamental mechanism of hBN–hBN and graphene–hBN sliding from the perspective of atomic level is worthwhile to make, with both computational and experimental investigations.
This work seeks to employ non-equilibrium molecular dynamics simulation to determine the effect of varying distinct parameters (geometry, stiffness gradient, nanoflake material) on the durotaxis-induced motion of boron nitride and graphene nanoflakes across a boron nitride substrate. First we describe the details of the simulation methodologies. Next, we present and analyze the results obtained by varying the initial parameters of stiffness gradient magnitude, geometry of the nanoflake, and size of the nanoflake. Conclusions are drawn and discussed in the final section.
Computational model & methodology
In what follows, molecular dynamics simulations based on the open source code LAMMPS27 are employed to perform the simulation of hBN–hBN and graphene–hBN durotaxis motion. Langevin dynamics and periodic boundary conditions are employed to set up the simulation system. In order to accurately capture the behavior of hexagonal boron nitride, the Tersoff potential is utilized, which takes the form |
 | (1) |
where fR is a repulsive two-body term while fA is an attractive three-body term managed by the bij bond function. The negative gradient of this potential is the vector force experienced by each atom. The parameters of the Tersoff potential utilized here for BN were documented by Matsunaga.28 For the durotaxis tests, the sample is set up as shown in Fig. 1.
 |
| Fig. 1 Set up and durotaxis-induced motion. The color scale represents stiffness G of the substrate, normalized on a scale from 0 to 1. The solid curve represents its past traveling path; the dash line represents its potential future traveling path. | |
The substrate we simulate is a single sheet of hBN 22 nm along the x direction and 4 nm along the y direction with the periodic boundary in the y direction concurrent with the edges of the large sheet in order to simulate an infinitely wide sheet. Fig. 1 shows the computational set-up of the hBN we simulate. The first nanometer of each of the free ends of the sheet is fixed and a stiffness gradient is applied across the x direction. The substrate is temperature controlled using canonical NVT Nosé–Hoover thermostat with a temperature set as desired, with standard velocity–Verlet time integration with a timestep of 1 fs in order to preserve a balance between accuracy and computational cost; the pressure is not controlled. The transported nanoflake of hBN or graphene is controlled using Newtonian dynamics, with no thermostats applied. Stiffness is applied to each atom in the substrate by attaching it to a virtual harmonic spring, such that the entire substrate may be thought of as being on a bed of springs as in previous literature,24 restricting motion in the z-direction to a greater or lesser degree dependent on stiffness of the spring. To better capture the stiffness profile in the hBN sheet, the central 20 nm region of hBN sheet is partitioned into twenty regions with the width of 1 nm each as depicted in Fig. 1, with negative x being low stiffness end and positive x being the high stiffness end. The stiffness gradients here are all normalized relative to the value of 1.6 nN nm−2, which is referred to as G. Values presented are thus 0.01 G, 0.5 G, etc.
A nanoflake made of hBN (or graphene) is placed above the large sheet at a distance of 5 nm from the fixed end with low stiffness, with the entire nanoflake controlled by non-thermostatted Newtonian dynamics. During the initial, equilibrium phase, the center of mass of the nanoflake is constrained to prevent motion. At the end of the initial phase, the constraint is released and the nanoflake is allowed to move freely. After equilibrium status, the system is allowed to run for 1 ns and the result is documented for further analysis. In order to better present the effect of stiffness gradient on the motion of nanoflake, the low-stiffness end of the system is kept with no stiffness constraint for each run while the stiffness of the hot end is set as a variety of values to provide the desired durotaxis gradient. Stiffness is applied to each atom of the base hBN sheet by coupling it to a virtual spring with the appropriate stiffness value, with the stiffness constant of the spring determined by its x-position and the applied stiffness gradient. In this work, the initial plane of the nanosheet is considered to be the x − y plane, and perpendicular to the nanosheet is the z direction. A randomized initial velocity is applied to each atom in accordance with the sample temperature with sum zero linear and angular momenta. In order to provide the friction force data, during the friction measurement test the flake is pulled using steered molecular dynamics with a spring constant of 100 eV Å−2. The total pulling speed is 2.5 nm ns−1, as this pulling speed is slow enough to have negligible velocity-dependent effects. The results of the tests are then compiled and analyzed.
Results & discussion
Mechanism of stiffness gradient motion
To apply and tune the stiffness-induced durotaxis in potential application, we need to understand its fundamental mechanism and answer the basic question: where is the driving force from? As we know, thermal noise energy for a nonconstrained nanoflake-substrate system we study here would be completely random and generally cancel itself out. The driving force observed in our simulations may be attribute to that the thermal energy of atoms ‘up’ the stiffness gradient is restricted by the stiffness of the spring which they are attached to. As the springs get stiffer, the atoms are further restricted, and thus contribute less ‘random’ energetic motion to the nanoflake. Via this mechanism, the nanoflake moves towards areas which are bound by stiffer springs, or alternatively towards a less energetic substrate as is equally the case for thermophoresis-induced nanoflake motion.16 The force the nanoflake experiences can be characterized aswhere F(t) is the time-dependent force on the nanoflake, Ff is the frictional force between nanoflake and substrate, g(x) is a restraining function which varies with the stiffness of the atoms which itself is a function of the x-coordinate, and ζ(t) is the time-dependent random force induced by atoms in the substrate through both L–J van der Waals and electrostatic Coulomb forces. The thermal force ζ(t) can be considered to have a zero mean when time-averaged, which without the function g(x) would cause no net change in the position of the nanoflake. In a previous study it has been shown that the mechanism of action is the decrease in potential force due to increased stiffness.24 This decrease in potential force is caused by the increased stiffness' reduction of thermal noise. The durotaxis force FD was tested using steered molecular dynamics as described in the Methods section. The nanoflake was slowly pulled first with the gradient, then against it, and the difference of the force needed to pull in each direction was halved to grant the force of the durotaxis motion. The nanoflake was free to rotate and move in the y- and z-directions. The freedom of motion we provide our nanoflake makes it necessary to include a discussion of the frictional force experienced by the flake. As has been shown for graphene–graphene sliding, the friction force is dependent on the relative angle of lattices between the substrate and the nanoflake.29 As the nanoflake moves, it shows a stick-slip behavior commonly seen on graphene–graphene sliding, for both the hBN and the graphene nanoflake on the hBN substrate. Due to this stick-slip behavior, the force required to move the nanoflake regularly cycles through high and low values, dependent on the friction from the relative stacking angle, and as a result the force is time-averaged. It has been shown before that durotaxis-induced force for 2D material sliding of graphene is an order of magnitude greater than the friction between the nanoflake and the substrate (∼1 pN compared with ∼0.1 pN).24,29 The time-averaged force FD is determined for each stiffness gradient at 300 K via the above method, and the results are graphed in Fig. 2. From this surface plot, we can see the general trend of there being a maximum driving force achieved for a certain range of temperatures and stiffness gradients. In the next several sections, we shall take a closer look at this phenomenon.
 |
| Fig. 2 A surface plot of the measured force FD as a function of temperature and gradient. | |
Effect of stiffness gradient
There is a certain range of stiffness gradient which is most conducive to propelling the nanoflake. If the gradient is too small, there is not enough of a difference to overcome random thermal noise. If the gradient is too large, the overly stiff atoms impede the progress of the nanoflake, as there is very little thermal motion to contribute to FD. Here we examine exactly what stiffness gradient ranges are useful, and see if there is a qualitative ‘best’ value. The stiffness gradient values were chosen to range from 0.01 G to 10 G, as it was noticed that below or above these values, motion was either extremely slow or highly erratic, with seemingly little influence from the gradient itself. In Fig. 3 we determine that a value of 0.1–1.0 G displays the fastest movement of the nanoflake, and the values are comparable to those seen previously for durotaxis-induced motion.24 At very low G, the stiffness gradient is not enough to create a very large imbalance of force across the nanoflake, such that random thermal motion is a large factor in the motion of the nanoflake. When G is above this range of values however, the velocity of the nanoflake is not as high, as the overly stiff springs restraining the substrate cannot transfer as much thermal noise and thus do not contribute as much to driving the nanoflake. Thus it can be seen that, for a hBN nanoflake on hBN substrate, there is indeed a qualitative ‘best’ range for the stiffness gradient for durotaxis induced motion.
 |
| Fig. 3 Velocity of hBN nanoflake as a function of gradient, for (a) low and (b) high temperatures. | |
Effect of temperature
Similar to stiffness gradient, the temperature also should be within a certain range for maximum efficacy, so that there is enough thermal noise to contribute to the nanoflake's motion, but above a certain temperature the system will break down. From Fig. 4, there is indeed a range of temperatures for which the durotaxis-induced motion is fastest. If the temperature of the system is too low, then the thermal noise responsible for FD is barely enough to drive the nanoflake. At very high temperatures, the nanoflake is constantly being bombarded by an excess of thermal noise, making consistent movement in a single direction less likely. The thermal range chosen for this study was between 100 K and 500 K. It was noticed that below 100 K, motion was almost nonexistent, and so this was the cutoff chosen for the low temperature. At temperatures higher than 500 K, the hBN begins to break apart, and so this was decided as the highest value for the thermal range. It can be seen from Fig. 4 that the optimal range for increasing the velocity of a given G value is in the range of 350–450 K. It should be noted, however, that motion is more controlled at lower values, with higher temperatures introducing a larger amount of thermal noise and thus having a wider spread of potential velocity values. It can easily be seen that at lower temperatures, there is much less variation in velocity amongst different stiffness gradients. As the temperature increases however, the velocity profile shows a much larger variation in values amongst different stiffness gradients.
 |
| Fig. 4 Velocity of hBN nanoflake as a function of temperature, for (a) low and (b) high gradients. | |
Effect of nanoflake composition and charge
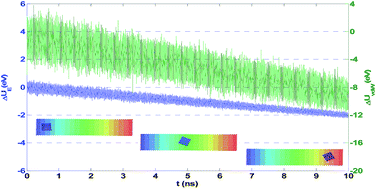
Combining the stiffness gradient and the temperature gradient data gives us a surface curve of the velocity profile, as shown in Fig. 5. This representation clearly shows the characteristic maximum around a gradient of 0.1–1.0 G and around a temperature of 250–400 K. Next, we would like to investigate stiffness-gradient induced motion on nanoflakes in general. To determine the widespread applicability of this type of durotaxis-induced motion, we replaced the hBN nanoflake with a graphene nanoflake for several trials. The graphene nanoflake was also 20 nm × 20 nm, and contained the same number of atoms as the hBN nanoflake. The velocity profile of a graphene flake on hBN is shown in Fig. 6. From this profile, we can see that graphene clearly travels at a slower rate over hBN than does a flake of hBN. Part of this deficit can be attributed to the slightly lower mass of the graphene sheet versus hBN (average atomic mass of 12.011 amu for graphene vs. 12.41 amu for hBN), but the mass difference of 3.3% is not enough to explain such a large difference. To more fully investigate the mechanism behind this phenomenon, we ran several cases of the hBN nanoflake with electrostatic terms turned off in order to see the contribution of the charged atoms in hBN (versus the neutral graphene). The surface plot of this set of cases is visualized in Fig. 7, which can be seen to be quite similar in magnitude to the plot of graphene in Fig. 6. From this comparison, and by comparing Fig. 5 with 7, we can see that the long-range electrostatic forces contribute a great deal to hBN–hBN interactions when compared with the van der Waals forces which dominate when it comes to graphene or other uncharged nanoflakes. To better elucidate this phenomenon, we calculated the change in potential energy on an hBN nanoflake during durotaxis-induced motion due to the van der Waals and electrostatic forces from the substrate; and the results of a single run with a temperature of 300 K and a gradient of 0.1 G are displayed in Fig. 8. It is clear that, although the value change of the electrostatic forces is noticeably less than that of the van der Waals forces, both effects conspicuously decrease over the course of the run, as fewer perturbations from thermal motions cause disequilibrium in the nanoflake. Due to this phenomenon, we can state that hBN on hBN durotaxis induced motion is superior to nonpolar materials on hBN, as the electrostatic forces of the partially charged atoms in hBN allow contributions beyond the range of the van der Waals forces, increasing the velocity of a given nanoflake.
 |
| Fig. 5 Surface plot of velocity versus gradient and temperature for hBN on hBN. | |
 |
| Fig. 6 Surface plot of velocity versus gradient and temperature for graphene on hBN. | |
 |
| Fig. 7 Surface plot of velocity versus gradient and temperature for hBN on hBN, with no electrostatic interactions. | |
 |
| Fig. 8 Electrostatic and van der Waals energy variation on an hBN flake as it travels up the stiffness gradient, for temperature 300 K and gradient 0.1 G. | |
Concluding remarks
In summary, we have utilized molecular dynamics simulations to investigate the effects of various factors such as substrate temperature and stiffness gradient value on the durotaxis-induced motion of an hBN nanoflake across an hBN substrate. Our findings show that a larger stiffness gradient generates faster motion of the nanoflake up to a certain limiting value, which provides a novel concept to manipulate the motion of the particle at nanoscale. There is a key stiffness gradient between 0.1 G and 1 G for hBN nanoflakes where the durotaxis-induced velocity undergoes a local maximum in magnitude; while above this value the increasing stiffness mitigates the effective driving thermal noise. Our simulations also demonstrate that the temperature of the substrate plays a significant role in the velocity of and force on the hBN nanoflake, with a key range of 250–400 K. Most importantly, however, we have shown that the electrostatic interactions of hBN on hBN sliding contribute greatly to the durotaxis induced motion, and if these charges are not present, the velocity of a given stiffness gradient and temperature is reduced by at least two thirds. This work provides a comprehensive approach to inter-hexagonal boron nitride durotaxis-induced motion necessary to develop novel methods of nano-transportation and the fine positioning of nanoparticles.
Acknowledgements
The authors acknowledge support from the National Science Foundation and University of Georgia (UGA) start-up fund. The facility support for modeling and simulations from the UGA Advanced Computing Resource Center are greatly appreciated.
References
- J. Le Rouzic, P. Vairac, B. Cavallier and B. Cretin, IEEE Sens. J., 2013, 13, 1340–1346 CrossRef CAS.
- D. Ziegler, T. R. Meyer, R. Farnham, C. Brune, A. L. Bertozzi and P. D. Ashby, Nanotechnology, 2013, 24, 335703 CrossRef PubMed.
- C. M. Wang and H. Itoh, Meas. Sci. Technol., 2013, 24, 035401 CrossRef CAS.
- M. C. Mullenbroich, N. McAlinden and A. J. Wright, J. Opt., 2013, 15, 075305 CrossRef.
- M. Michihata, T. Yoshikane, T. Hayashi and Y. Takaya, International Journal of Optomechatronics, 2013, 7, 46–59 CrossRef.
- B. M. Lansdorp, S. J. Tabrizi, A. Dittmore and O. A. Saleh, Rev. Sci. Instrum., 2013, 84, 044301 CrossRef PubMed.
- Z. Bryant, F. C. Oberstrass and A. Basu, Curr. Opin. Struct. Biol., 2012, 22, 304–312 CrossRef CAS PubMed.
- G. Guillonneau, G. Kermouche, S. Bec and J. L. Loubet, J. Mater. Res., 2012, 27, 2551–2560 CrossRef CAS.
- C. K. S. Moy, M. Bocciarelli, S. P. Ringer and G. Ranzi, Comput. Mater. Sci., 2011, 50, 1681–1691 CrossRef.
- L. Y. Zhang and X. Q. Wang, J. Appl. Phys., 2014, 115, 4306 Search PubMed.
- E. Omidi, A. H. Korayem and M. H. Korayem, Precis. Eng., 2013, 37, 658–670 CrossRef.
- D. R. Reyes, G. I. Mijares, B. Nablo, K. A. Briggman and M. Gaitan, Appl. Surf. Sci., 2011, 257, 8373–8377 CrossRef CAS.
- J. D. Whitehill, I. Gralinski, D. Joiner and A. Neild, J. Nanopart. Res., 2012, 14, 1–11 CrossRef.
- L. J. Xu, G. B. Han, J. W. Hu, Y. He, J. G. Pan, Y. J. Li and J. N. Xiang, Phys. Chem. Chem. Phys., 2009, 11, 6490–6497 RSC.
- C. M. Lo, H. B. Wang, M. Dembo and Y. L. Wang, Biophys. J., 2000, 79, 144–152 CrossRef CAS PubMed.
- M. Becton and X. Q. Wang, J. Chem. Theory Comput., 2014, 10, 722–730 CrossRef CAS PubMed.
- Z. R. Guo, T. C. Chang, X. M. Guo and H. J. Gao, J. Mech. Phys. Solids, 2012, 60, 1676–1687 CrossRef CAS.
- P. M. Shenai, J. Ye and Y. Zhao, Nanotechnology, 2010, 21, 495303 CrossRef PubMed.
- X. F. Feng, S. Kwon, J. Y. Park and M. Salmeron, ACS Nano, 2013, 7, 1718–1724 CrossRef CAS PubMed.
- X. H. Zhang, G. E. Santoro, U. Tartaglino and E. Tosatti, Philos. Mag., 2013, 93, 922–948 CrossRef CAS.
- B. Bourlon, D. C. Glattli, C. Miko, L. Forro and A. Bachtold, Nano Lett., 2004, 4, 709–712 CrossRef CAS.
- P. Tangney, S. G. Louie and M. L. Cohen, Phys. Rev. Lett., 2004, 93, 065503 CrossRef PubMed.
- L. Zhang and X. Wang, J. Chem. Theory Comput., 2014, 10, 3200–3206 CrossRef CAS PubMed.
- T. C. Chang, H. W. Zhang, Z. R. Guo, X. M. Guo and H. J. Gao, Phys. Rev. Lett., 2015, 114, 015504 CrossRef PubMed.
- Y. Huang, S. Zhu and T. Li, Extreme Mechanics Letters, 2014, 1, 83–89 CrossRef.
- S. T. Gill, J. H. Hinnefeld, S. Z. Zhu, W. J. Swanson, T. Li and N. Mason, ACS Nano, 2015, 9, 5799–5806 CrossRef CAS PubMed.
- S. Plimpton, J. Comput. Phys., 1995, 117, 1–19 CrossRef CAS.
- K. Matsunaga, C. Fisher and H. Matsubara, Jpn. J. Appl. Phys., 2000, 39(2), L48–L51 CAS.
- H. W. Zhang, Z. R. Guo, H. Gao and T. C. Chang, Carbon, 2015, 94, 60–66 CrossRef CAS.
|
This journal is © The Royal Society of Chemistry 2016 |
Click here to see how this site uses Cookies. View our privacy policy here.