Effects of non-equimolar lithium salt glyme solvate ionic liquid on the control of interfacial degradation in lithium secondary batteries

Shiro Seki*a, Nobuyuki Serizawaab, Katsuhito Takeia, Seiji Tsuzukic, Yasuhiro Umebayashid, Yasushi Katayamab, Takashi Miurab, Kaoru Dokkoe and Masayoshi Watanabee
aMaterials Science Research Laboratory, Central Research Institute of Electric Power Industry (CRIEPI), 2-6-1 Nagasaka, Yokosuka-shi, Kanagawa 240-0196, Japan. E-mail: s-seki@criepi.denken.or.jp
bDepartment of Applied Chemistry, Faculty of Science and Technology, Keio University, 3-14-1 Hiyoshi, Kohoku-ku, Yokohama-shi, Kanagawa 223-8522, Japan
cNational Institute of Advanced Industrial Science and Technology (AIST), 1-1-1 Umezono, Tsukuba-shi, Ibaraki 305-8568, Japan
dGraduate School of Science and Technology, Niigata University, 8050 Ikarashi, 2-no-cho, Nishi-ku, Niigata-shi, Niigata 950-218, Japan
eDepartment of Chemistry and Biotechnology, Yokohama National University, 79-5 Tokiwadai, Hodogaya-ku, Yokohama-shi, Kanagawa 240-8501, Japan

Received 18th February 2016 , Accepted 18th March 2016

First published on 21st March 2016


Abstract

Control of interfacial properties between the electrode and electrolyte is important for obtaining long life-cycle lithium-ion secondary batteries. To control interfacial degradation, we investigated the effect of changing the composition ratio of lithium salt (LiN(SO2CF3)2) and low-molecular-weight ether (CH3–O–(C2H4O)3–CH3) in the system. A highly electrochemically stable lithium salt glyme solvated ionic liquid electrolyte was realized, with long-lived, robust lithium solvation complexes by increasing the lithium salt composition ratio. Lithium secondary batteries using the electrolyte show notable suppression of the degradation of interfacial resistance at the interface of the electrolyte and the positive electrode (high oxidation state), which leads to a longer life-cycle of the batteries.

Introduction

Lithium (Li)-ion batteries are expected to scale up from consumer electronic goods, such as mobile personal computers and smart phones, to applications that require high-energy densities, such as electric vehicles and energy-storage devices. Advances in performance (such as long life achieved by high electrode stability and high power derived from low resistance) and safety assurance are important requirements, and many types of electrolytes (inorganic solid,1 genuine polymer,2 room-temperature ionic liquid,3 and new-type liquid4) have been reported as highly safe electrolyte materials for next-generation Li-ion batteries. Equimolar (1[thin space (1/6-em)]:[thin space (1/6-em)]1) complex electrolytes composed of a low-molecular-weight ether (glyme) and a Li salt have been reported to exhibit high thermal and electrochemical stabilities owing to strong interactions between the oxygen in the ether and the Li cation (Li salt glyme solvate ionic liquids), although oxidative instability at low Li salt concentrations was observed.5 Favorable performances (up to 400 charge/discharge cycles) were achieved using 3V-class [LiFePO4|Li metal] and 4V-class [LiNi1/3Mn1/3Co1/3O2|Li metal] cells.6 Moreover, Li salt glyme solvate ionic liquids have weak coordinating ability, which allows for innovative Li-sulfur batteries with a long cycle life (over 400 cycles) by suppressing the dissolution of the polysulfide into the electrolyte.7 More specifically, it is becoming clear that Li salt glyme solvate ionic liquids have important benefits in performance (low Lewis acidity and basicity) in addition to their safety advantages.

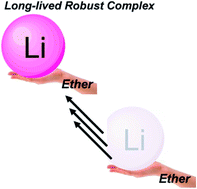
The amount of free glyme near the electrode/electrolyte interface may be reduced by adding excess lithium bis(trifluoromethanesulfonyl)amide (LiTFSA). In fact, the free glyme mole fraction to total glyme in the bulk solvate ionic liquid was estimated to be less than 2.3% in the glyme[thin space (1/6-em)]:[thin space (1/6-em)]LiN(SO2CF3)2 = 1[thin space (1/6-em)]:[thin space (1/6-em)]1 solvate ionic liquid by previously reported Raman speciation analysis.8 In previous research, we showed, using an electrochemical quartz crystal microbalance (EQCM) for dynamic observation, that the decrease in local viscosity near the electrode/electrolyte interface is attributable to the concentration distribution of Li salt and the transitional liberation of glyme molecules during the deposition of Li metal.9 To improve the electrochemical stability of Li salt glyme solvate ionic liquids, it is therefore necessary to form long-lived robust complexes between oxygen in the ether electrolyte and the Li cation. In this paper, we propose Li salt glyme solvate ionic liquids that are non-equimolar and that are prepared by adding Li salt to achieve a higher Li salt concentration than in the original 1[thin space (1/6-em)]:[thin space (1/6-em)]1 equimolar complex electrolyte, even though viscosity of electrolyte is increased. This excess Li salt is indispensable for providing compensating Li cations close to the electrode during the charge/discharge process. A lower Li salt concentration electrolyte than in the original 1[thin space (1/6-em)]:[thin space (1/6-em)]1 electrolyte was also investigated as a reference. Although the number of reports of high salt concentration liquid electrolytes10–12 and it's solvated structures13,14 has increased in recent years, the main claim of this research is control of lithium salt concentration to obtain long-lived robust lithium solvation complexes. Here, we report the charge/discharge performances and internal resistance changes based on alternating current (AC) impedance measurements on [LiCoO2|Li metal] cells using three types of Li salt glyme solvate ionic liquids. A new method of control at the electrolyte/electrode interface is proposed from the perspective of the electrolyte—specifically the choice of solvent and salt chemistry.

Experimental section

Triethylene glycol dimethyl ether (triglyme, G3, Nippon Nyukazai Co., Ltd.) and lithium bis(trifluoromethanesulfonyl)amide (LiN(SO2CF3)2, LiTFSA, Solvay Co., Ltd.) were used for the solvent and Li species, respectively. These materials were stored in a dry argon-filled glovebox. LiTFSA and G3 were weighed in various molar ratios LiTFSA[thin space (1/6-em)]:[thin space (1/6-em)]G3 = 1.00[thin space (1/6-em)]:[thin space (1/6-em)]1.25 ([Li(G3)1.25]TFSA, representing the low Li salt concentration electrolyte), 1.00[thin space (1/6-em)]:[thin space (1/6-em)]1.00 ([Li(G3)1]TFSA, as a standard), and 1.00[thin space (1/6-em)]:[thin space (1/6-em)]0.80 ([Li(G3)0.8]TFSA, as the high Li salt concentration electrolyte). Each sample was weighed in the desired molar ratio and stirred in a sample bottle to obtain a homogeneous liquid electrolyte.

Li secondary battery characteristics were investigated using [LiCoO2 positive electrode|[Li(G3)x]TFSA electrolyte + separator|Li metal negative electrode] cells. The positive electrode sheet was composed of LiCoO2 (85 wt%) as the active material, acetylene black (6 wt%, Denka) as an electrically conductive additive, and polyvinylidene difluoride (PVDF) (9 wt%, Kureha Chemical) as a binder polymer. These materials were thoroughly mixed with N-methylpyrrolidone in a homogenizer. The resulting paste was uniformly applied onto an aluminum current collector using an automatic applicator (LiCoO2 weight: 2.3–2.8 mg cm−2). After drying the applied paste at 80 °C, the positive electrode sheets were compressed using a roll-press machine to increase packing density and improve electrical conductivity (pressed thickness: ca. 20 μm). The positive electrode sheet (ϕ 16 mm), the polypropylene-based separator (ϕ 19 mm), the [Li(G3)x]TFSA electrolyte, and the Li metal negative electrode (ϕ 16 mm) were then encapsulated in a 2032-type coin cell. To ensure complete penetration of the electrolyte into the pressed positive electrode sheet, the prepared cells were aged at 60 °C for more than 18 h.15

Charge/discharge cycle tests were performed on the cells between 2.7 and 4.3 V with a current of 20 mA g−1 (ca. C/8) under constant-current charge and discharge conditions using a multi-potentiostat (Bio-Logic VMP3; rest time: 10 min). AC impedance measurements were performed during each cycle in the charged state (frequency region: 200 kHz to 50 mHz; applied voltage: 10 mV).

To analyze the resistance changes of the electrolyte bulk and electrolyte/electrode interfaces at a high state of charge under conditions of specific constant applied voltage, different AC impedance measurement techniques were used (i.e., constant-voltage impedance measurements).16 The prepared cells were first charged to 4.2, 4.3, or 4.4 V (current density: 8.0 mA g−1 = ca. C/20). Their AC impedances were then measured while the cell potential was held at the selected voltage. The cycle number and voltage–applied time dependencies of the impedance spectra were obtained using the fitting program, Zview. Three cells were prepared for each electrochemical measurement; their properties were evaluated using the average values obtained. All of the electrochemical measurements were performed at 30 °C.

Results and discussion

To investigate the electrochemical performances of the three types of [Li(G3)x]TFSA electrolytes, charge/discharge cycle tests were carried out while the various resistive components were monitored using AC impedances. Fig. 1 shows (a) the discharge profiles (1st and 30th cycles) and the cycle number dependencies of (b) the average discharge capacities and (c) average coulombic efficiencies obtained in the cycle tests. Initial discharge profiles for each of the cells show values close to the theoretical capacity for LiyCoO2 (150 mA h g−1; 0.45 < y < 1), although slight polarizations due to an increment in the Li salt concentration were observed. The changes in the average discharge voltage with the cycle number depend on the LiTFSA[thin space (1/6-em)]:[thin space (1/6-em)]G3 ratio (average discharge voltages during 1st cycle: 3.96 V ([Li(G3)1.25]TFSA), 3.93 V ([Li(G3)1]TFSA), and 3.92 V ([Li(G3)0.8]TFSA); average discharge voltages during 30th cycle: 3.78 V ([Li(G3)1.25]TFSA), 3.83 V ([Li(G3)1]TFSA), and 3.86 V ([Li(G3)0.8]TFSA)]). Significant increases in polarization and decreases in discharge capacity were observed for the lower Li salt concentration, [Li(G3)1.25]TFSA. The discharge capacities retained after 30 cycles were 66.1% ([Li(G3)1.25]TFSA), 74.6% ([Li(G3)1]TFSA), and 84.4% ([Li(G3)0.8]TFSA). A similar improvement in coulombic efficiency (associated with the suppression of side reactions) was observed with increasing Li salt concentration. It is therefore suggested that these three effects are related to the composition ratio of G3 and the Li cations.
image file: c6ra04404b-f1.tif
Fig. 1 Discharge profiles of [LiCoO2 positive electrode|[Li(G3)x]TFSA electrolyte|Li metal negative electrode] cells at the 1st and 30th cycles (a), cycle number dependencies of discharge capacities per positive electrode (b), and coulombic efficiencies (c) at 30 °C (voltage range: 2.7–4.3 V, current: ca. C/8). Each plot is calculated from the average values of all cells; the maximum and minimum values are indicated as error bars in (b) and (c).

To analyze the degradation components of the prepared cells as a function of the number of charge/discharge cycles, we investigated the changes in cell internal resistance by AC impedance. Fig. 2 shows the cycle number dependencies of the impedance spectra of [LiCoO2|[Li(G3)x]TFSA|Li] cells ((a) x = 1.25; (b) x = 0.8). An x-intercept and two semicircular arcs were observed in all cycles for each system. Based on the response frequency (related to the time constant of the kinetics for each electrode) obtained in previous studies,6,17 it is concluded that the impedance components are attributable to the electrolyte bulk (x-intercept), Li metal/electrolyte interface (high-frequency semicircular arc), and LiCoO2/electrolyte interface (low-frequency semicircular arc). We therefore defined the equivalent circuit to be a series circuit of Rbulk, (RlithiumQlithium), and (RLiCoO2QLiCoO2) (where R is the resistance; Q is the incomplete capacitance element). Using this equivalent circuit, spectral fitting of impedance was performed to determine the resistive components. In particular, RLiCoO2 was the dominant component in all total cell resistance changes observed in this study. The charge/discharge cycle number dependencies of average RLiCoO2 values are shown in Fig. 2(c). RLiCoO2 increased with the cycle number, and increasing rates of RLiCoO2 were increased in the order of [Li(G3)1.25]TFSA > [Li(G3)1]TFSA > [Li(G3)0.8]TFSA, which is correlated with the observed discharge capacity deterioration behavior when the LiTFSA[thin space (1/6-em)]:[thin space (1/6-em)]G3 composition ratio is changed. From this AC impedance analysis, it is inferred that the dominant cause of the decrease in capacity during charge–discharge cycling is degradation at the LiCoO2/[Li(G3)x]TFSA electrolyte interface (oxidative decomposition of G3 and release of oxygen from LiCoO2) and that the resistance growth of RLiCoO2 is influenced by the LiTFSA[thin space (1/6-em)]:[thin space (1/6-em)]G3 composition ratio. We previously observed the decrease of viscosity near the electrode attributable to the transient liberation of G3 during deposition of Li metal by EQCM technique.9 In the same manner, G3 may be liberated from a complex cation during discharge process in this system (especially initial stage of discharge mode at high voltage), leading to the oxidative decomposition of G3 on the LiCoO2 surface. The stability of the solvate structure therefore also depends on the current density and potential. More detailed information regarding the battery performance (capacity and resistance changes) may be obtained by changing parameters such as the current direction and current density. On the other hand, LixCoO2 is reported to be unstable and change to Co3O4 by releasing oxygen at high voltage region.18 Adding excess LiTFSA has a possibility to make the effect on the suppression of this reaction.


image file: c6ra04404b-f2.tif
Fig. 2 Cycle number dependencies of impedance spectra for [LiCoO2 positive electrode|[Li(G3)x]TFSA electrolyte|Li metal negative electrode] cells ((a) [Li(G3)1.25]TFSA, (b) [Li(G3)0.8]TFSA), and RLiCoO2 (c) at 30 °C (voltage range: 2.7–4.3 V, current: ca. C/8). Each plot is calculated from the average values of all cells; the maximum and minimum values are indicated as error bars in (c).

In this study, we assumed that exposure to the high voltage state (high oxidation state) was one of the main degradation factor in the prepared cells. To observe the degradation rate at the LiCoO2 positive electrode/electrolyte interface at high voltages (high oxidation state) inside the cells, constant-voltage impedance measurements were carried out at a charged state of 4.3 V. Fig. 3 shows the time dependencies of impedance spectra for [LiCoO2|[Li(G3)x]TFSA|Li] cells (not cycled) at 4.3 V ((a) x = 1.25; (b) x = 0.8) at 30 °C. The increase in resistance was largest at the LiCoO2 positive electrode/[Li(G3)x]TFSA electrolyte interface, similar to the trends observed in Fig. 2(a) and (b) from the AC impedance analysis. Moreover, significant suppression of the RLiCoO2 increase was confirmed in the case of the higher Li salt concentration, [Li(G3)0.8]TFSA. The AC impedance spectra obtained at a high oxidation state were analyzed to investigate the time dependencies of RLiCoO2, which is the dominant degradation component. These time dependencies of average RLiCoO2 are shown in Fig. 3(c). RLiCoO2 increased with time, and the rate of increase changed with the composition ratio of G3 to LiTFSA ([Li(G3)1.25]TFSA > [Li(G3)1]TFSA > [Li(G3)0.8]TFSA). The increase of RLiCoO2 was also dominant for the case of charge/discharge cycle tests with good correlation. Moreover, it was found that the high voltage state influenced the increase of RLiCoO2 as well as the capacity and coulombic efficiency. In other words, the main causes of capacity decreases in [LiCoO2|[Li(G3)x]TFSA|Li] cells are side reactions at the LiCoO2/[Li(G3)x]TFSA interface under high oxidation states. If the free G3 in the [Li(G3)x]TFSA electrolyte was decomposed, total amount of free G3 should be decreased and reach higher LiTFSA concentration (x: decreased). Its influence on decomposition of LiCoO2 at highly charged state should be also considered. It is difficult for quantitative understanding of decrease in the free G3 with decomposition during measurements, therefore, concentrations are discussed as constant values. As a result, it became clear that non-equimolar (high salt concentration) lithium salt glyme solvate ionic liquid is effective in suppressing the cell degradation.


image file: c6ra04404b-f3.tif
Fig. 3 Time dependencies of impedance spectra for [LiCoO2 positive electrode|[Li(G3)x]TFSA electrolyte|Li metal negative electrode] cells when a cell voltage of 4.3 V was applied to (a) [Li(G3)1.25]TFSA, (b) [Li(G3)0.8]TFSA, and (c) RLiCoO2 at 30 °C. Each plot is calculated from the average values of all cells; the maximum and minimum values of are indicated as error bars in (c).

We also investigated the effects of applied constant voltage to understand the suppressing effect of changing the resistance at the LiCoO2 positive electrode/[Li(G3)x]TFSA electrolyte interface using the various composition ratios listed above. Fig. 4 shows the applied voltage dependencies of RLiCoO2 (100 h)/RLiCoO2 (20 h) for [LiCoO2|[Li(G3)x]TFSA|Li] cells with varying LiTFSA[thin space (1/6-em)]:[thin space (1/6-em)]G3 composition ratios. RLiCoO2 (100 h)/RLiCoO2 (20 h) increased with increasing applied voltage for each electrolyte. This result implies that the frequency factor of the degradation reaction is influenced by the composition ratio. In other words, significant changes in degradation site resulting from the introduction of variable compositions of G3 and LiTFSA are suggested; as mentioned in the introduction, decreasing the free G3 is also expected by adding excess LiTFSA. Enhancement of energy density is an important targets for next-generation batteries; achieving strong electrochemical stabilization at high potential (for example, over 4.2 V vs. Li/Li+) is one of the important requirements. The control of interfacial degradation at high operating voltages by varying the composition ratio of G3 to LiTFSA is a promising idea, although the work of Orita et al. was conducted mainly from the perspective of rate performance.19 Improvement in rate performance can also be expected, resulting from the introduction of non-coordinating co-solvents in the electrolyte without destroying the strongly solvated structures.7


image file: c6ra04404b-f4.tif
Fig. 4 Applied voltage dependencies of RLiCoO2 (100 h)/RLiCoO2 (20 h) for [LiCoO2 positive electrode|[Li(G3)x]TFSA electrolyte|Li metal negative electrode] cells with varying composition ratios of G3 to LiTFSA. Each plot is calculated from the average values of all cells; the maximum and minimum values are indicated as error bars.

Although both the charge/discharge cycle performances (capacity retention) and impedance changes (RLiCoO2) were improved by introducing a higher Li salt concentration into the complex electrolyte of glyme and Li salt, the reasons for the observed relationships in the resistance changes between the dynamic (charge/discharge: Fig. 2) and quasi-static (constant voltage state: Fig. 3) measurements are still unclear. For example, desolvation of Li from the G3–Li+ complex occurs during the cell's discharge process [LiyCoO2 + (1 − y)e + (1 − y)Li+ → LiCoO2] on the positive electrode side. The solvated structure (a strong complex formed between G3 and Li+) near the high oxidation state positive electrode should be more easily broken during the discharge process than during the charge process. Therefore, degradation of the cell should be occurred to various degrees in both dynamic charge/discharge processes (local composition change of [Li(G3)x]TFSA) and charged state (effect of free G3 in [Li(G3)x]TFSA).

Conclusions

In summary, we have confirmed that excess Li salts in glyme solvent (non-equimolar lithium salt glyme solvate ionic liquid) perform as compensate ionic species for the oxidation/reduction (dissolution/deposition) process. Using this idea, the electrochemical stability at the electrolyte/electrode (LiCoO2, positive electrode side) interface is improved with respect to the charge/discharge reaction and leads to a longer cycle life of the batteries.

Acknowledgements

This work was partially supported by the Advanced Low Carbon Technology Research and Development Program (ALCA) of the Japan Science and Technology Agency (JST), Japan.

Notes and references

  1. N. Kamaya, K. Homma, Y. Yamakawa, M. Hirayama, R. Kanno, M. Yonemura, T. Kamiyama, T. Kato, S. Hama, K. Kawamoto and A. Mitsui, Nat. Mater., 2011, 10, 682 CrossRef CAS PubMed.
  2. A. Nishimoto, K. Agehara, N. Furuya, T. Watanabe and M. Watanabe, Macromolecules, 1999, 32, 1541 CrossRef CAS.
  3. H. Sakaebe and H. Matsumoto, Electrochem. Commun., 2003, 5, 594 CrossRef CAS.
  4. L. Suo, Y.-S. Hu, H. Li, M. Armand and L. Chen, Nat. Commun., 2013, 4, 1481 CrossRef PubMed.
  5. K. Yoshida, M. Nakamura, Y. Kazue, N. Tachikawa, S. Tsuzuki, S. Seki, K. Dokko and M. Watanabe, J. Am. Chem. Soc., 2011, 133, 13121 CrossRef CAS PubMed.
  6. S. Seki, N. Serizawa, K. Takei, K. Dokko and M. Watanabe, J. Power Sources, 2013, 243, 323 CrossRef CAS.
  7. K. Dokko, N. Tachikawa, K. Yamauchi, M. Tsuchiya, A. Yamazaki, E. Takashima, J.-W. Park, K. Ueno, S. Seki, N. Serizawa and M. Watanabe, J. Electrochem. Soc., 2013, 160, A1304 CrossRef CAS.
  8. K. Ueno, R. Tatara, S. Tsuzuki, S. Saito, H. Doi, K. Yoshida, T. Mandai, M. Matsugami, Y. Umebayashi, K. Dokko and M. Watanabe, Phys. Chem. Chem. Phys., 2015, 17, 8248 RSC.
  9. N. Serizawa, S. Seki, K. Takei, H. Miyashiro, K. Yoshida, K. Ueno, N. Tachikawa, K. Dokko, Y. Katayama, M. Watanabe and T. Miura, J. Electrochem. Soc., 2013, 160, A1529 CrossRef CAS.
  10. Y. Yamada, K. Furukawa, K. Sodeyama, K. Kikuchi, M. Yaegashi, Y. Tateyama and A. Yamada, J. Am. Chem. Soc., 2014, 136, 5039 CrossRef CAS PubMed.
  11. Y. Yamada, M. Yaegashi, T. Abe and A. Yamada, Chem. Commun., 2013, 49, 11194 RSC.
  12. J. Qian, W. A. Henderson, W. Xu, P. Bhattacharya, M. Engelhard, O. Borodin and J.-G. Zhang, Nat. Commun., 2015, 6, 6362 CrossRef CAS PubMed.
  13. P. Jankowski, M. Dranka, G. Z. Żukowska and J. Zachara, J. Phys. Chem. C, 2015, 119, 9108 CAS.
  14. D. M. Seo, P. D. Boyle, J. L. Allen, S. Han, E. Jónsson, P. Johansson and W. A. Henderson, J. Phys. Chem. C, 2014, 118, 18377 CAS.
  15. S. Seki, Y. Kobayashi, H. Miyashiro, Y. Ohno, Y. Mita, A. Usami, N. Terada and M. Watanabe, Electrochem. Solid-State Lett., 2005, 8, A577 CrossRef CAS.
  16. S. Seki, Y. Kobayashi, H. Miyashiro, A. Yamanaka, Y. Mita and T. Iwahori, J. Power Sources, 2005, 146, 741 CrossRef CAS.
  17. S. Seki, T. Kobayashi, N. Serizawa, Y. Kobayashi, K. Takei, H. Miyashiro, K. Hayamizu, S. Tsuzuki, T. Mitsugi, Y. Umebayashi and M. Watanabe, J. Power Sources, 2010, 195, 6207 CrossRef CAS.
  18. S. Seki, Y. Kobayashi, H. Miyashiro, A. Usami, Y. Mita and N. Terada, J. Electrochem. Soc., 2006, 153, A1073 CrossRef CAS.
  19. A. Orita, K. Kamijima, K. Yoshida, K. Dokko and M. Watanabe, J. Power Sources, 2011, 196, 3874 CrossRef CAS.

This journal is © The Royal Society of Chemistry 2016