Self-powered photosensing characteristics of amorphous carbon/silicon heterostructures
L. Z. Hao*a,
Y. J. Liua,
W. Gaoa,
Z. D. Hana,
Z. J. Xua,
Y. M. Liua and
J. Zhub
aCollege of Science, China University of Petroleum, Qingdao, Shandong 266580, People's Republic of China. E-mail: haolanzhong@upc.edu.cn
bState Key Laboratory of Electronic Thin Films and Integrated Devices, University of Electronic Science and Technology of China, Chengdu 610054, People's Republic of China
First published on 18th April 2016
Abstract
Amorphous carbon (a-C) thin films are deposited on p-type silicon (Si) substrates using magnetron sputtering technique and the photodetector devices based on the a-C/Si heterostructures are fabricated. The photosensing characteristics of the devices are investigated. Under light irradiation, the fabricated a-C/Si device exhibits obvious photovoltaic characteristics. This enables its application as a self-powered photodetector operated at zero bias voltage. The obtained results show that the device is highly sensitive to broadband wavelength from the ultraviolet to near-infrared light, showing a high detectivity of ∼2.9 × 1013 cm Hz1/2 W−1, as well as a high responsitivity of ∼292.5 mA W−1, and a fast response speed of ∼8.3 μs. The mechanisms to the self-powered photosensing characteristics are clarified by the determination of the energy-band alignment near the interface of the a-C/Si heterostructures.
I Introduction
Amorphous carbon (a-C) thin films have become potential candidates in developing various kinds of electronic devices due to their excellent optical, electrical, magnetic and mechanical properties.1–4 Amorphous carbon has sp2 in addition to sp3 hybrid bonds. This makes it a much more complex system.5 Compared with other nanoscale semiconductors,6 a-C has many advantages, such as low manufacturing cost, ease of mass production, and a tunable band gap in a relatively wide range of 0.2–3.0 eV by controlling the structures.7 Presently, silicon (Si) is dominating the commercial electronic device market due to its high abundance and mature processing technology. In order to develop practically applicable electronic devices, it is of great valuable to realize the integration of a-C thin films on Si. So far, extensive efforts have been devoted to a-C/Si optoelectronic devices, such as photodetectors.8–11 Due to its structural characteristics of single carbon component, the deficiencies of atoms in a-C films could be prevented and the structural defects could be much less compared to other films composed of compounds. This could increase the production of photo-generated carriers in the films and enhance the a-C/Si optoelectronic device performance. For example, Jiang et al. reported the deposition of the Co-doped carbon films on n-type Si substrates and the a-C/Si heterojunctions were fabricated.8 A giant photoconductivity was observed in the fabricated heterojunctions and the obtained photosensitivity was as large as ∼105. According to reported results, the previous a-C/Si photodetectors belong photoconductor-type devices and large external bias is necessary for the devices to operate. In recent years, solar cells based on a-C/Si junctions have been reported.12–15 These a-C/Si heterojunction devices show good photovoltaic characteristics. For example, a-C/Si p–n junction has been prepared using an arc-discharge plasma CVD technique.12 The cell has a high power conversion efficiency (PCE) of 7.9% with an open circuit voltage (Voc) of 0.58 V and a short circuit current density (JSC) of 32.5 mA cm−2. The photovoltaic properties supplies possibilities for a-C/Si to work without any external bias voltage as a self-powered photodetector. Compared with photoconductor-type ones, self-powered photodetectors is more favorable in practical application due to their low energy consumption, safe operation and simplifying design of driving circuits.16 Thus, it could be expected that a-C/Si heterostructures would have large potential applications in the area of future optoelectronic devices. However, the related studies on the self-powered characteristics of the a-C/Si devices are present rarely.In this work, a-C thin films are deposited onto Si substrates using dc magnetron sputtering technique. Under the light illumination, obvious photovoltaic characteristics is achieved in the a-C/Si heterojunction device, enabling its applications as self-powered photodetectors operated at zero bias voltage. The a-C/Si photodetectors show high performance in terms of wide wavelength range to detect, as well as high detectivity and high responsivity, and fast response speed.
II Experimental section
Amorphous carbon thin films were deposited on (100)-oriented Si substrates using dc magnetron sputtering technique. The graphite powders (purity, 99.9%) were cold-pressed into disk as the target during sputtering under 20 MPa. The Si substrates used in this work are p-type semiconductors with the resistivity of 1.2–1.8 Ω cm. Before the deposition, the substrates were ultrasonically cleaned in sequence by alcohol, acetone, and de-ionized water. Then, the substrates were dipped into HF solution (∼5.0%) for 60.0 s to remove the natural oxide layer from the Si surface. After that, surface passivation of the Si were performed in peroxide solution (∼40.0%) at 100 °C for 20.0 min to form a ∼3.0 nm-thickness SiO2 passivation layer on the Si surface. Subsequently, ∼80 nm-thickness a-C thin films were deposited. During the deposition, the working pressure of argon gas and deposition temperature were 1.0 Pa and 400.0 °C, respectively. After the deposition, rapid thermal annealing (RTA) was performed at 400 °C under the vacuum condition (×10−4 Pa). Finally, the top ∼30 nm-thickness Pd electrode layer was fabricated on the a-C film using dc magnetron sputtering technique. The back ∼300 nm-thickness indium (In) electrode was covered on the whole backside of the Si substrate.Samples were characterized using Raman spectroscopy (Renishaw, 514 nm laser). Surface morphologies were studied by atomic force microscope (AFM, SPM-300HV, SEIKO). The transmission spectra were measured by Shimadzu UV-3150 spectrophotometer. Ultraviolet photoelectron spectroscopy (UPS) measurements were made using an unfiltered He–I (21.22 eV) gas discharge lamp. The current density–voltage (J–V) curves were measured using two-point measurement by a Keithley2400 source meter at RT. To obtain the sensitivity of the device, a Xe lamp with tuneable output power combined with double monochromators (7ISW302 and 7ISW304, Sofn Instruments Co., Ltd, China) was used to produce the monochromatic light from 300–1100 nm. The response speed of the photodetector was evaluated by combining a pulsed 980 nm laser (SCT-DSL, Shaanxi Scitower Photoelectricity Equipment Co., Ltd, China) and a digital oscilloscope (Tektronix TDS 2012C).
III Results and discussion
Fig. 1 shows the Raman spectrum of the a-C films on the Si substrates. Two significant active modes of the deposited film are located at ∼1343 cm−1 and ∼1570 cm−1 which correspond to D band and G band in carbon-based materials, respectively. The D band is associated with the breathing mode of six-fold sp2 rings and is identified as the disorder-activated band. This mode is absent in perfect graphite and only becomes active in the presence of disorder.17 The G band is associated with the bond stretching vibrations of all sp2 sites.18 The results demonstrate that the as-deposited thin films exhibit amorphous carbon characteristics. The inset in Fig. 1 shows AFM topographic image of the a-C thin film on the Si substrate. As shown in the figure, outgrowths are evident. The surface of the film is composed of dense grains. According to the measurements, the root-mean-square roughness of the film is about 2.2 nm, and the average size of grains is about 73.6 nm in diameter and the covering ratio of the grains reaches about 84.9%. The rough surface is important for the optoelectronic devices because it can effectively decrease the reflection to light and improve the efficiency of photogenerated carrier.19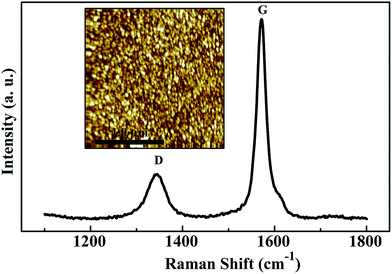 | ||
| Fig. 1 Raman spectra of the a-C films deposited on the Si substrate. The inset shows the AFM surface morphologies of the sample. | ||
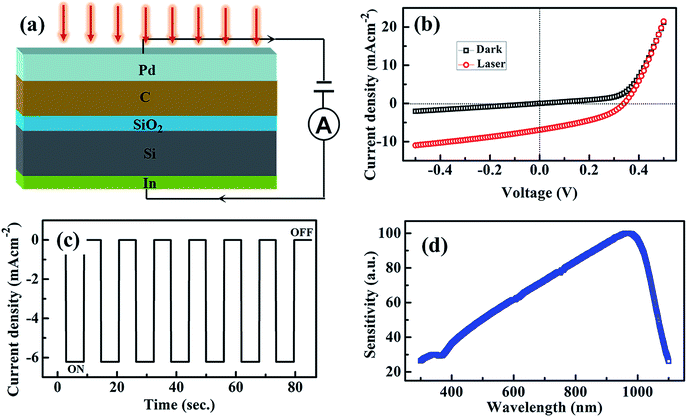
Fig. 2(a) shows the schematic illustration of the photoelectrical measurement of the fabricated photodetector device. Forward voltages are defined as the positive voltages applied on the In bottom electrode. Fig. 2(b) shows the J–V curves of the a-C/Si device measured in the dark and under irradiation of an NIR 980 nm laser with a light intensity of 30 mW cm−2. In the dark condition, obvious rectifying behavior can be observed from the figure. The rectifying ratio (I+/I−) measured at ±0.5 V is about 10. In our experiments, both the J–V curves of Pd/a-C and In/Si are almost linear, illustrating the ohmic nature of the contacts. Therefore, the rectifying J–V characteristic in the device structure is mainly dominated by the a-C/Si contact. Under the light irradiation, the current density of the device is larger than that in the dark, as shown in the figure. This indicates that light absorption in the a-C thin film and the Si substrate generates a photocurrent. From the figure, obvious photovoltaic characteristics can be seen. According to the measured results, the fabricated device has an open-circuit voltage (Voc) of 0.33 V and a short-circuit current density (JSC) of 6.9 mA cm−2. As we know, a photodetector device with photovoltaic activity can operate at zero bias voltage. Thus, this kind of self-driven photodetector is a promising candidate for future optoelectronic devices with low energy consumption and reduced size. Fig. 2(c) shows the time dependence of the current density of the device at zero bias voltage. When the light-on and light-off conditions are switched alternately, two distinct current states for the device are shown, the ‘‘low’’ current state in the dark and the ‘‘high’’ current state in the light corresponding to “OFF” and “ON” states, respectively. Both the steep rise and fall edges suggest a fast response speed. Fig. 2(d) shows the sensitivity of the a-C/Si photodetector as a function of wavelength. Here, the normalization of the sensitivity of the device is used. From the figure, obvious photoresponse can be observed in a wide wavelength range from the ultraviolet to near-infrared area (300–1100 nm) and the peak value of the sensitivity of the device is located at around 980 nm. Thus, the fabricated a-C/Si heterojunctions can be applied to develop not only near-infrared photodetectors but also sunlight-type ones due to the wide photosensing wavelength range. This is much similar with other semiconductor heterostructures.22
Fig. 3(a) shows the photovoltage of the device as the function of the light intensity of the 980 nm NIR laser. As shown in the figure, the photovoltage of the device increases rapidly from 0.01 V to 0.28 V when the light intensity changes from 0.2 to 10.0 mW cm−2. However, further increase of the light intensity leads to the saturation of the photovoltage, ∼0.33 V. The dependence of the photovoltage on the light intensity is similar with that observed in other solar cells.20 Fig. 3(b) shows the photocurrent density of the a-C/Si at zero bias as a function of light intensity. The dependency curve can be well fitted with a power law:21
| Ip ∝ Pθ | (1) |
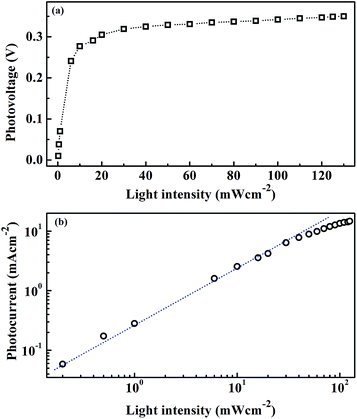 | ||
| Fig. 3 Dependence of (a) photocurrent density at zero external bias and (b) photovoltage of the device on light intensity. | ||
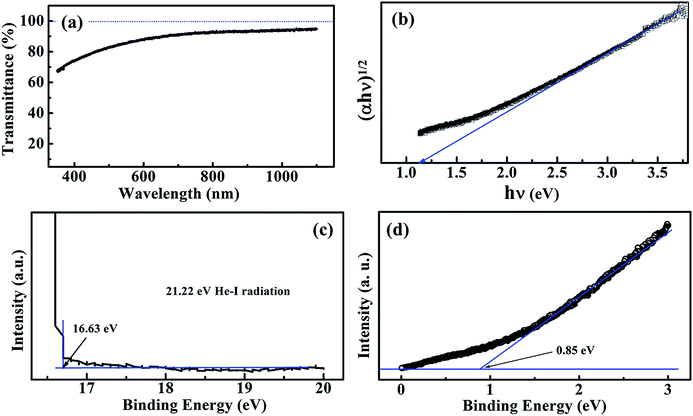
The electrical and self-powered photosensing characteristics of the a-C/Si device can be clarified by the determination of the energy band structure of the a-C thin film and the band alignment near the interface of the heterostructure. Fig. 4(a) shows the transmission spectrum of the a-C film deposited on glass (a-SiO2) substrate using the same growth condition with that on the Si substrate. As shown in the figure, the transmittance of the film decreases with decreasing the wavelength from near-infrared region to ultraviolet region (1100–300 nm). Using the data from the transmittance spectrum, (αhν)1/2 is plotted as a function of photon energy hν, wherein h is the Planck constant and ν is photon frequency. The α is the absorption coefficient, calculated by αd = ln(1/T), d and T are thickness and transmittance of the film, respectively.24 The band gap (Eg) of the film can be determined by the intercept of the line on hν axis, as shown in Fig. 4(b). According to calculated results, Eg = 1.15 eV. Fig. 4(c) and (d) show the UPS spectra of the deposited carbon film on the Si substrate. The work function (W) of the film can be calculated from the difference between the cutoff of the highest binding energy and the photon energy of the exciting radiation, as shown in Fig. 4(c). From the figure, W = 4.59 eV can be obtained. Since the Fermi level (EF) of a-C exists between the conduction band (EC) and the valence band (EV), the distance (ΔE) between EV and EF of a-C film can be extracted from the onset energy, as shown in Fig. 4(d). The ΔE for a-C is determined to be 0.85 eV. According to these energy-band parameters, the n-type behavior of the a-C film can be proved.
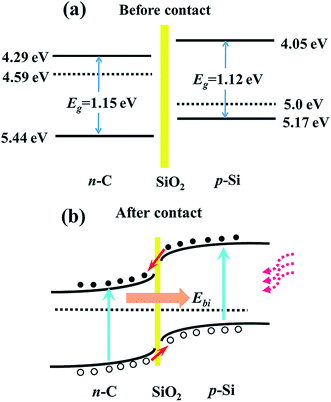
Based on the above results, the isolated energy-band diagrams of the a-C/Si are constructed, as shown in Fig. 5(a). The Fermi level of p-type Si is 5.0 eV, and its electron affinity (χ) and band gap are respectively 4.05 eV and 1.12 eV.25 In the figure, the SiO2 layer as the surface passivation layer is incorporated into the interface. When the a-C film is deposited onto the Si substrate, the electrons flow from the thin film into the substrate at the interface due to the higher Fermi energy level of the n-type a-C. The flowing process stops when Fermi levels are equal and the a-C/Si n–p junction is fabricated, as shown in Fig. 5(b). Consequently, a built-in electrical field (Ebi) is formed near the interface and its direction points from the film to the substrate. Thus, asymmetric characteristics and obvious rectifying effect can be observed from the J–V curve in Fig. 2(a). Under above-bandgap light illumination, the incident photons are absorbed by the a-C/Si heterojunction and the electron–hole (e–h) pairs in both the film and the substrate are generated. The built-in electrical field can effectively facilitate the separation of photo-generated e–h pairs, transporting separated electrons from Si to a-C and holes towards Si by passing the SiO2 thin layer through tunneling.26 The processes of photo-excitation and carrier transport in the a-C/Si n–p junction are demonstrated in the figure. Therefore, obvious photovoltaic characteristics are resulted in the heterojunction. The photovoltaic characteristics ensures that the device can operate at zero external bias voltage. As shown in Fig. 2(c), stable “ON” and “OFF” states of the photocurrent at zero bias voltage can be seen when the light-on and light-off condition is switched alternately. The steep rise and fall edges in the figure further indicate that electron–hole pairs could be effectively generated and separated in the a-C/Si heterojunction. Due to the relatively narrow band gaps of both the a-C and Si, a wide detection range can be acquired, as shown in Fig. 2(d).
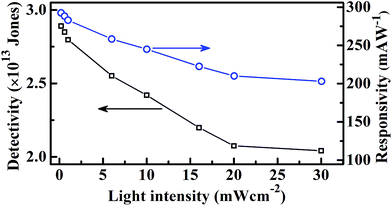
To evaluate the detection performance of the a-C/Si photodetector, the photoresponsivity (R) and the photodetectivity (D*) of the device under different light intensity are calculated, as shown in Fig. 6. The photoresponsivity can be described using the following equation:27
| R = Ip/Pin | (2) |
| D* = R/(2qJd)1/2 | (3) |
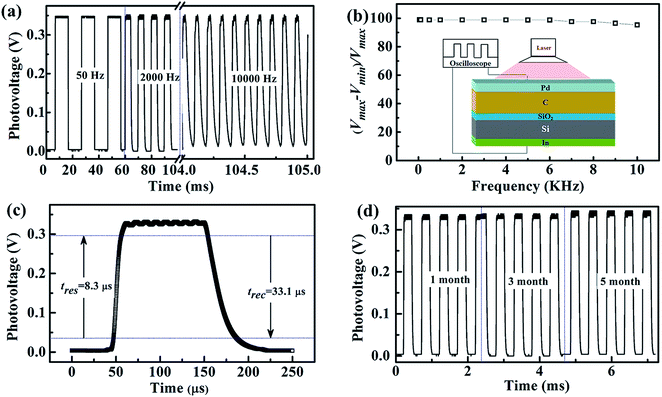
Response speed for a photodetector is also crucial in practical applications. Here, we further investigate the response and recovery speed of the a-C/Si photodetector device by using the pulsed 980 nm laser with varied frequency from 0 to 10 kHz. The variation of photovoltages is monitored by an oscilloscope to obtain the response and recovery speed. Fig. 7(a) shows the photovoltage response of the a-C/Si photodetector under light switching frequencies of 50 Hz, 2 kHz, and 10 kHz. For all switching frequencies, the response of the device shows good stability and repeatability. The relative balance of the photovoltage signals at different laser frequencies, (Vmax − Vmin)/Vmax, is calculated. Fig. 7(b) shows the plot of the relative balance versus laser frequency. The inset shows the schematic illustration of the setup for measuring the response speed of the device. As shown in the figure, the value of the relative balance shows only 4% decrease when the laser frequency increase from 50 Hz to 10 KHz. This suggests that the a-C/Si heterojunction device can work well over a wide switching frequency range, which is vitally important to monitor the fast optical signal. Fig. 7(c) shows the single normalized modulation cycle measured at 2 KHz. The response time (tres) is the time interval for the response to rise from 10% to 90% of its peak value. The recovery time (trec) is the time interval for the recovery to decay from 90% to 10% of its peak value. The device shows a fast response and recovery speeds, tres = 8.3 μs and trec = 33.1 μs. The obtained response and recovery speeds are among the best reported results for self-powered photodetectors.20,32–34 Furthermore, the air stability of the a-C/Si photodetector is investigated by placing it directly in air condition without any encapsulation, as shown in Fig. 7(d). From the figure, we can see that the device can be stable under atmospheric conditions for more than five months with no obvious degradation of the photodetection performance.
IV Conclusions
In summary, a-C thin films were deposited onto p-type Si substrates using magnetron sputtering technique and self-powered a-C/Si photodetectors were fabricated. The obtained results showed that the a-C/Si photodetector was able to operate at zero external bias voltage and exhibited a wide spectrum detection range from visible to NIR light. Under the laser illumination of 980 nm, the fabricated a-C/Si photodetector showed a high detectivity of ∼2.9 × 10¹³ Jones, as well as a high responsitivity of ∼292.5 mA W−1, and a fast response speed of ∼8.3 μs. Based on these excellent photosensing characteristics, the presented a-C/Si devices would have large potential applications in future optoelectronic devices.Acknowledgements
The authors would like to acknowledge the financial support by the National Natural Science Foundation of China (Grant No. 51502348, 51102284 and 51372030) and the Fundamental Research Funds for the Central Universities (14CX05038A and 15CX08009A).References
- R. U. R. Sagar, X. Z. Zhang, C. Y. Xiong and Y. Yu, Carbon, 2014, 76, 64 CrossRef CAS.
- N. Konofaos, C. T. Angelis, E. K. Evangelou, C. A. Dimitriadis and S. Logothetidis, Appl. Phys. Lett., 2001, 79, 2381 CrossRef CAS.
- P. Tian, X. Zhang and Q. Z. Xue, Carbon, 2007, 45, 1764 CrossRef CAS.
- X. Liu, J. Yang, J. Hao, J. Zheng, Q. Gong and W. Liu, Adv. Mater., 2012, 24, 4614 CrossRef CAS PubMed.
- L. Zhang, X. Wei, Y. Lin and F. Wang, Carbon, 2015, 94, 202 CrossRef CAS.
- S. C. Dhanabalan, J. S. Ponraj, H. Zhang and Q. L. Bao, Nanoscale, 2016, 8, 6410 RSC.
- T. Soga, T. Kondoh, N. Kishi and Y. Hayashi, Carbon, 2013, 60, 1 CrossRef CAS.
- Y. C. Jiang, J. F. Wang and J. Gao, Carbon, 2014, 72, 106 CrossRef CAS.
- M. Ma, Q. Z. Xue, J. P. Li, Y. H. Zhen and S. Wang, J. Appl. Phys., 2011, 110, 054503 CrossRef.
- Q. Z. Xue, M. Ma, Y. H. Zhen, X. Y. Zhou and S. Wang, Diamond Relat. Mater., 2012, 21, 24 CrossRef.
- S. Kawai, T. Shinagawa, M. Noda and M. Umeno, Diamond Relat. Mater., 2008, 17, 676 CrossRef CAS.
- Z. Q. Ma and B. X. Liu, Sol. Energy Mater. Sol. Cells, 2001, 69, 339 CrossRef CAS.
- H. W. Zhu, J. Q. Wei, K. L. Wang and D. H. Wu, Sol. Energy Mater. Sol. Cells, 2009, 93, 1461 CrossRef CAS.
- M. Ma, Q. Z. Xue, H. J. Chen, X. Y. Zhou, D. Xia, C. Lv and J. Xie, Appl. Phys. Lett., 2010, 97, 061902 CrossRef.
- A. M. Baranov, Y. A. Malov, D. F. Zaretsky and S. A. Tereshin, Sol. Energy Mater. Sol. Cells, 2000, 60, 11 CrossRef CAS.
- L. Peng, L. Hu and X. Fang, Adv. Funct. Mater., 2014, 24, 2591 CrossRef CAS.
- T. S. Chen, Y. C. Hsueh, S. E. Chiou and S. T. Shiue, Sol. Energy Mater. Sol. Cells, 2015, 137, 185 CrossRef CAS.
- G. Abrasonis, R. Gago, M. Vinnichenko, U. Kreissig, A. Kolitsch and W. Moller, Phys. Rev. B: Condens. Matter Mater. Phys., 2006, 73, 125427 CrossRef.
- J. Sheng, K. Fan, D. Wang, C. Han, J. Fang, P. Gao and J. Ye, ACS Appl. Mater. Interfaces, 2014, 6, 16027 CAS.
- L. Wang, J. Jie, Z. Shao, Q. Zhang, X. Zhang, Y. Wang, Z. Sun and S. T. Lee, Adv. Funct. Mater., 2015, 25, 2910 CrossRef CAS.
- L. H. Zeng, M. Z. Wang, H. Hu, B. Nie, Y. Q. Yu, C. Y. Wu, L. Wang, J. G. Hu, C. Xie, F. X. Liang and L. B. Luo, ACS Appl. Mater. Interfaces, 2013, 5, 9362 CAS.
- Z. Y. Huang, W. J. Han, H. L. Tang, L. Ren, D. S. Chander, X. Qi and H. Zhang, 2D Materials, 2015, 2, 035011 CrossRef.
- L. Li, E. Auer, M. Liao, X. Fang, T. Zhai, U. K. Gautam, A. Lugstein, Y. Koide, Y. Bando and D. Golberg, Nanoscale, 2011, 3, 1120 RSC.
- F. Gao, X. J. Liu, J. S. Zhang, M. Z. Song and N. Li, J. Appl. Phys., 2012, 111, 084507 CrossRef.
- Y. G. Du, Q. Z. Xue, Z. Y. Zhang, F. J. Xia, J. P. Li and Z. D. Han, Sens. Actuators, B, 2013, 186, 796 CrossRef CAS.
- L. Z. Hao, W. Gao, Y. J. Liu, Z. D. Han, Q. Z. Xue, W. Y. Guo, J. Zhu and Y. R. Li, Nanoscale, 2015, 7, 8304 RSC.
- W. Choi, M. Y. Cho, A. Konar, J. H. Lee, G. B. Cha, S. C. Hong, S. Kim, J. Kim, D. Jena and J. Joo, Adv. Mater., 2012, 24, 5832 CrossRef CAS PubMed.
- M. S. Choi, D. Qu, D. Lee, X. Liu, K. Watanabe, T. Taniguchi and W. J. Yoo, ACS Nano, 2014, 8, 9332 CrossRef CAS PubMed.
- L. B. Luo, H. Hu, X. H. Wang, R. Lu, Y. F. Zou, Y. Q. Yu and F. X. Liang, J. Mater. Chem. C, 2015, 3, 4723 RSC.
- M. Zhu, X. M. Li, Y. B. Guo, X. Li, P. Z. Sun, X. B. Zang, K. Wang, M. Zhong, D. Wu and H. Zhu, Nanoscale, 2014, 6, 4909 RSC.
- Q. S. Zeng, S. Wang, L. J. Yang, Z. X. Wang, T. Pei, Z. Y. Zhang, L. M. Peng, W. Zhou, J. Liu, W. Y. Zhou and S. S. Xie, Opt. Mater. Express, 2012, 2, 839 CrossRef CAS.
- Q. S. Hong, Y. Cao, J. Xu, H. M. Lu, J. H. He and J. L. Sun, ACS Appl. Mater. Interfaces, 2014, 6, 20887 CAS.
- W. F. Jin, Y. Ye, L. Gan, B. Yu, P. C. Wu, Y. Dai, H. Meng, X. F. Guo and L. Dai, J. Mater. Chem., 2012, 22, 2863 RSC.
- D. Wu, Y. Jiang, Y. G. Zhang, Y. Q. Yu, Z. F. Zhu, X. Z. Lan, F. Li, C. Wu, L. Wang and L. Luo, J. Mater. Chem., 2012, 22, 23272 RSC.
| This journal is © The Royal Society of Chemistry 2016 |

