Control of pH by acetic acid and its effect on ethanol fermentation in an integrated ethanol–methane fermentation process

Xinchao Yangab, Ke Wanga, Huijun Wanga, Jianhua Zhanga, Lei Tanga and Zhonggui Mao*a
aKey Laboratory of Industrial Biotechnology, Ministry of Education, School of Biotechnology, Jiangnan University, Wuxi 214122, China. E-mail: maozg@jiangnan.edu.cn; Fax: +86 510 85918296; Tel: +86 510 85918296
bSchool of Biological Science and Technology, University of Jinan, Jinan 250022, China

Received 15th February 2016 , Accepted 25th May 2016

First published on 26th May 2016


Abstract

The integrated ethanol-methane fermentation process employing cassava or other feedstock requires pH control to maximize yields. Sulfuric acid is currently used to adjust the pH of the recycled process water but this causes problems with sulfate-reducing bacteria. To resolve this, acetic acid was evaluated to regulate pH in the range 4.0–5.5. Significant advantages were found and acetic acid toxicity was avoided. The ethanol yield from glucose increased 4.6% on average while production of the undesired byproduct glycerol decreased 52.6%. The ethanol yield per DCW (dry cell weight) increased from 14.0 g g−1 (sulfuric acid control) to 32.0 g g−1 when 250 mM acetic acid was present at pH 5.0. At pH 5.5, ethanol yield per DCW increased from 10.5 g g−1 to 23.0 g g−1. In both cases, the ethanol yield more than doubled. Using acetic acid instead of sulfuric acid to control pH thus increased ethanol production while simultaneously reducing undesirable side effects. The results presented here could also provide a useful approach for the management of wastewater in other submerged fermentation industries.

1. Introduction

Bioethanol is the major biofuel on the global market and its production has increased considerably in recent decades. Sustainable conversion of biomass into biofuels and chemicals requires the integration of production, storage, pretreatment, and processing of the feedstock in a biorefinery, while treating and generating value from the feedstock residues.1 However, bioethanol production is facing environment-based criticism, focused mainly on the small positive net energy balance (NEB) achieved2,3 and on wastewater management. To create a more sustainable bioethanol industry, the crucial requirements are to decrease energy consumption and to improve wastewater treatment.4

In a conventional ethanol fermentation process, large volumes of freshwater are consumed and 8–15 liters distillery waste generated per liter of ethanol.5 Distillery waste is usually treated by solid–liquid separation followed by anaerobic–aerobic digestion, and the effluent is further treated using physical or chemical methods to meet the national discharge standard.6,7 However, capital investment and operating costs are high for aerobic digestion and further treatment processes. To deal with the problems mentioned above, Zhang and coworkers8,9 developed an integrated ethanol–methane fermentation process (ESI Fig. 1a) where thin stillage was treated by two-stage anaerobic digestion to produce methane as fuel while the digestate was further treated and recycled for use in subsequent ethanol fermentation. Large amounts of acid are needed to adjust pH because of the alkaline nature and high buffering capacity of the digestate and sulfuric acid has usually been employed. However, using sulfuric acid has many adverse effects. When thin stillage is treated by anaerobic digestion, sulfate is reduced by sulfate-reducing bacteria (SRB) that out-compete methane-producing bacteria for substrates (H2 and acetate).4 The reducing product, H2S, causes problems of corrosion, malodor and toxicity. Sulfide is also involved in the precipitation of non-alkali metals in the digester, thus reducing their availability for methane-producing bacteria.10 Furthermore, H2S in the biogas increases the cost of methane purification.

In order to reduce the amount of sulfuric acid, Wang and coworkers4 developed an improved process, in which a proportion of untreated thin stillage was mixed with the product from anaerobic digestion of the remaining thin stillage and the combination then used as the process water for subsequent ethanol fermentation (ESI Fig. 1b). Thus there is no waste process water requiring disposal. Moreover, as a consequence the pH of the process water decreased because of the low pH (4.2–4.6) of thin stillage. The recycling ratio for thin stillage in the fermentation broth is typically restricted to a maximum of 50% due to build-up of solids and toxicity to the yeast by lactic acid, acetic acid, and/or sodium.11,12 After considering these factors, Wang and coworkers concluded4 that 40–60 thin stillage-digestate was the optimal recycling ratio for the process water in subsequent cassava fermentation.

Unfortunately, because the digestate has strong buffering capacity, the pH of the mixed process water is not reduced to the required level. Therefore, sulfuric acid is still needed to adjust the pH of the mixed process water to approach the optimum pH of 5.5 for thermotolerant α-amylase.

As alternative, acetic acid can be employed to eliminate the problems caused by sulfuric acid but has potential adverse yeast toxicity effects. Here, the use of acetic acid was evaluated for adjusting pH and its effect on ethanol fermentation was reported in the integrated ethanol-methane fermentation process (ESI Fig. 1c).

2. Materials and methods

2.1. Microorganism

A commercial strain TG1348 of S. cerevisiae for ethanol production was obtained from Henan TianGuan Co., Ltd, (Henan, Nanyang, China).

2.2. Seed medium

The seed medium was composed of (g L−1): glucose 20, yeast extract 8.5, (NH4)2SO4 1.3, MgSO4·7H2O 0.1 and CaCl2·2H2O 0.06. One loopful of S. cerevisiae grown on slant medium was inoculated into a 500 mL Erlenmeyer flask containing 200 mL seed medium. The mixture was incubated on a shaker (200 rpm) at 30 °C for 18 h.

2.3. Fermentation medium

Fermentation medium was composed of (g L−1): glucose 100, MgSO4·7H2O 0.1, CaCl2·2H2O 0.06, and urea 0.5. The mixed process water used in the fermentation was composed of thin stillage (40%) and digestate (60%). The thin stillage and the digestate were provided by Wujiang Yongxiang Alcohol Manufacturing Co. Ltd (Wujiang, Jiangsu, China).

2.4. pH adjustment

Control experiments were carried out where the pH was adjusted to 4.0, 4.5, 5.0 or 5.5 by 30% (w/w) H2SO4 or 10% (w/v) NaOH. Otherwise 60% (v/v) acetic acid was added to produce concentrations of 50, 100, 150, 200 or 250 mM in mixed process water. The pH was then adjusted to 4.0, 4.5, 5.0 or 5.5 with 10% (w/v) NaOH. In all cases the final volume was standardized by adding deionized water. Undissociated acetic acid was calculated using the Henderson–Hasselbalch equation:
pH = pKa + log([A]/[HA])

The pKa of acetic acid is 4.75 at 25 °C.

2.5. Ethanol fermentation

Triplicate fermentations were carried out in 250 mL flasks containing 135 mL medium. A 10% (v/v) inoculum was transferred into each flask. All fermentations were carried out at 30 °C without shaking.

2.6. Analysis

The concentrations of glucose, ethanol, glycerol, acetic acid and lactic acid were determined by high-performance liquid chromatography (HPLC). Samples collected were centrifuged (10[thin space (1/6-em)]000 × g for 10 min) and the supernatant was filtered (0.20 μm filter) prior to analysis and a 20 μl portion, or a standard solution, was injected into a Bio-Rad HPX-87H Aminex ion exclusion column (Bio-Rad company, Hercules, CA USA). The column was operated at 65 °C and sulfuric acid (0.005 mol L−1) was used as mobile phase at a flow rate of 0.6 mL min−1. A refractive index detector (Shodex RI-101, Shodex, Tokyo, Japan) was used for detection. Statistical analyses were done using Excel and Origin 8.5 (Microsoft Corp., Redmond, WA, USA). Standard errors and error bars are presented in tables, and the figures are based on untransformed ANOVA data. The net production of each of glycerol, acetic acid and lactic acid was calculated by subtracting the amount present in the mixed process water before it was used.

Cell number was evaluated by hemocytometer. Conversion from cell number to dry cell weight used a factor of 2.5 × 10⁻¹¹ g dry mass per cell.13

3. Results and discussion

3.1. Fermentation performance of the mixed process water

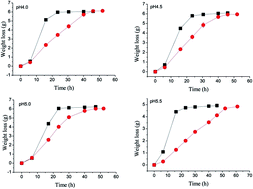
The mixed process water consisted of 40% thin stillage and 60% digestate. Table 1 shows the relevant characteristics of both the mixed process water and tap water. Before fermentation, glycerol, acetic acid and lactic acid were detectable in the mixed process water, as shown in Table 1. Fig. 1 shows the weight loss of CO2 when using either mixed process water or tap water. From Fig. 1 we can see that the fermentation time was about 29 hours for the mixed process water through the range pH 4.0–5.5. After 29 hours, the weight loss was almost constant. However, for tap water, the weight loss increased gradually over 48 hours at these pH values. Thus the fermentation time was reduced by 40% when using mixed process water.
Table 1 Comparison of different process water in terms of pH, glycerol, acetic acid and lactic acid
Parameter and unit Thin stillage Digestate Mixed process watera Tap water
a Mixture of thin stillage (40%) and digestate (60%).b ND: not detectable.
pH 4.30 7.90 6.39 7.42
Glycerol (g L−1) 5.36 NDb 2.14 ND
Acetic acid (g L−1) 0.51 0.19 0.33 ND
Lactic acid (g L−1) 5.62 ND 2.20 ND


image file: c6ra04129a-f1.tif
Fig. 1 Comparisons of the weight loss when using mixed process water or tap water for the fermentation. Data presented are the average of three independent cultivations and error bars represent standard deviations. ([thick line, graph caption][thick line, graph caption] mixed process water [thick line, graph caption][thick line, graph caption] tap water).

In the integrated ethanol–methane fermentation process, methanogenic bacteria was decomposed and released intracellular substances, which resulting in NH3–N concentration of the two-stage anaerobic digestion treatment of thin stillage remained at a high level (759 mg L−1 on average).4 Furthermore, ammonium in mixed water could promote yeast growth and fermentation rate.14 Trace amounts of amino acids were found in all stillage tested.15 These amino acids will provide rich nutrition for the growth of yeast, resulting in yeast growth rapidly. Therefore, the fermentation time was reduced when using the mixed water as process water.

3.2. Performance of ethanol fermentation when acetic acid was used to adjust pH in the mixed process water

Ethanol fermentation was monitored by measuring the mass of the flasks (Fig. 2), because the mass loss by CO2 evolution is proportional to the amount of ethanol produced.16 There was no effect of the concentration of acetic acid employed when the initial pH was held at 5.5 (Fig. 2d). As the pH decreased and/or the initial molarity of acetic acid was raised, there was an increasing inhibition of the fermentation compared to the control. Fermentation time increased by 7 h (from 23 to 30 h) when 50 mM acetic acid was present at pH 4.0; it was prolonged to 80 h when using 250 mM acetic acid at pH 5.0, but weight loss at the end of fermentation was slightly greater than for the control. Fermentation completely stopped when the concentration of acetic acid exceeded 50 mM at pH 4.0 (Fig. 2a) or 100 mM at pH 4.5 (Fig. 2b).
image file: c6ra04129a-f2.tif
Fig. 2 Effect of different concentrations of acetic acid (used to adjust pH) on weight loss at pH 4.0, 4.5, 5.0 or 5.5 ([thick line, graph caption][thick line, graph caption] control, [thick line, graph caption][thick line, graph caption] 50 mM, [thick line, graph caption][thick line, graph caption] 100 mM, [thick line, graph caption][thick line, graph caption] 150 mM, [thick line, graph caption][thick line, graph caption] 200 mM, [thick line, graph caption][thick line, graph caption] 250 mM). Data presented are the average of three independent cultivations and error bars represent standard deviations.

Table 2 shows the ethanol and glycerol yields obtained when using acetic acid to adjust the pH in the mixed process water. Ethanol yields increased 3.90–5.24% (4.57% on average) when acetic acid replaced H2SO4. It is also clear that glycerol yields significantly decreased when acetic acid was used (Table 2). Compared with the control, the yield of glycerol was reduced 37.50% (from 4.40 to 2.75 g L−1) when 50 mM acetic acid was present at pH 4.0. At pH 5.0, when 250 mM acetic acid was present glycerol decreased 52.62% (from 4.20 to 1.99 g L−1) without affecting ethanol production, but at the expense of a greatly increased fermentation time (Fig. 2c).

Table 2 Effect of acetic acid in pH adjustment on ethanol yields and glycerol yields at pH 4.0, 4.5, 5.0 or 5.5
pH Acetic acida (mM) Ethanol (g L−1) Glycerol (g L−1) pH Acetic acid (mM) Ethanol (g L−1) Glycerol (g L−1)
a The sulfuric acid control is indicated by a zero value.
4.0 0 40.91 ± 0.50 4.40 ± 0.08 5.0 0 43.41 ± 0.80 4.20 ± 0.08
50 43.05 ± 0.73 2.75 ± 0.06 50 45.18 ± 0.73 3.34 ± 0.05
100 3.89 ± 0.08 0.04 ± 0.01 100 45.47 ± 0.69 3.06 ± 0.08
150 2.54 ± 0.06 0 150 46.01 ± 0.78 2.63 ± 0.05
200 1.57 ± 0.04 0 200 45.88 ± 0.65 2.49 ± 0.04
250 0.95 ± 0.02 0 250 45.07 ± 0.92 1.99 ± 0.03
4.5 0 42.28 ± 0.86 4.35 ± 0.08 5.5 0 35.18 ± 0.63 4.25 ± 0.08
50 43.12 ± 0.80 3.16 ± 0.09 50 35.40 ± 0.55 3.58 ± 0.06
100 43.93 ± 0.85 2.44 ± 0.05 100 36.08 ± 0.60 3.38 ± 0.05
150 5.40 ± 0.09 0.24 ± 0.01 150 36.30 ± 0.55 3.08 ± 0.05
200 3.22 ± 0.08 0.05 ± 0.01 200 36.21 ± 0.70 2.94 ± 0.04
250 2.54 ± 0.05 0.17 ± 0.02 250 35.64 ± 0.64 2.72 ± 0.04


In previous studies, acetic acid stimulated ethanol production in some cases by as much as 20%,17 but this phenomenon is not always observed. The conversion of acetic acid to acetyl-CoA, spares some pyruvic acid from metabolic reactions associated with anaerobic cell growth, thus allowing increased fermentative production of ethanol.18 Under anaerobic conditions, glycerol formation by yeast reoxidizes NADH, formed in synthesis of biomass and secondary fermentation products, to NAD+.19 Acetic acid leads to a decreased glycerol yield because the biomass yield is decreased.

Fig. 3 showed the effect of acetic acid on cell number at the four pH values studied. From Fig. 3 we can see that cell number decreased as the concentration of acetic acid increased. It can be seen that acetic acid inhibits the growth of yeast to a greater or lesser extent. It is worth noting that the decrease in cell number was the same when the pH was 5.0 and 5.5, i.e. a reduction of 50% when 250 mM acetic acid was present. This is consistent with the results of Phowchinda et al.,20 who observed a 75% reduction in the maximum specific growth rate of S. cerevisiae when 100 mM acetic acid was added to the medium. The growth of yeast was effectively completely inhibited when the concentration of acetic acid exceeded 150 mM at pH 4.0 or 200 mM at pH 4.5; fermentation does not take place when the cell number is below 0.5 × 10⁸/mL.


image file: c6ra04129a-f3.tif
Fig. 3 Effect of acetic acid in pH adjustment on cell number at pH 4.0, 4.5, 5.0 and 5.5. Data presented are the average of three independent cultivations and error bars represent standard deviations.

The effect of pH adjustment by acetic acid on ethanol yield per DCW was also studied at pH 4.0, 4.5, 5.0 and 5.5. As shown in Fig. 4, at all four pH values, increasing acetic acid concentrations enhanced ethanol yield per DCW below a threshold representing acetic acid toxicity. From Fig. 4a we can see that ethanol yield per DCW increased from 14.0 g g−1 (sulfuric acid control) to 32.0 g g−1 (250 mM acetic acid) at pH 5.0. Similarly, ethanol yield per DCW increased from 10.5 g g−1 (control) to 23.0 g g−1 (250 mM acetic acid) at pH 5.5. The maximum ethanol yield more than doubled compared with the control.


image file: c6ra04129a-f4.tif
Fig. 4 Effect of pH adjustment by acetic acid on ethanol yield per DCW (dry cell weight) at pH 4.0, 4.5, 5.0 and 5.5. Data presented are the average of three independent cultivations and error bars represent standard deviations.

In every case where fermentation was not completely inhibited, acetic acid promoted the conversion of glucose to ethanol. In contrast, the glycerol yields from glucose exhibited obvious decreasing trends (Fig. 5). Taken together, these results suggest that a greater proportion of glucose was metabolized into ethanol when acetic acid was present. Thus, acetic acid helped to convert glucose to ethanol more efficiently.


image file: c6ra04129a-f5.tif
Fig. 5 Ethanol or glycerol yields from glucose when different concentrations of acetic acid were used to adjust pH to 4.0, 4.5, 5.0: ethanol/glucose ([thick line, graph caption][thick line, graph caption]), glycerol/glucose ([thick line, graph caption][thick line, graph caption]). Data presented are the average of three independent cultivations and error bars represent standard deviations.

The ethanol yield from glucose decreased at pH 5.5 compared with pH 5.0 when the concentration of acetic acid was 250 mM. Although (relative to sulfuric acid) acetic acid slowed the growth of S. cerevisiae and prolonged the fermentation time in the mixed process water, the fermentation time is still shorter than with tap water (Fig. 1), except for the combination of 250 mM acetic acid at pH 5.0 (Fig. 2c). It took more time for yeast to adapt to the culture conditions with higher concentrations of acetic acid in the mixed process water.

In this paper, glucose was used as carbon source to study the application of acetic acid to pH adjustment in the integrated process. Thus, the pH was set to be suitable for yeast growth and ethanol fermentation. However, the main purpose of adjusting the acid balance for production of ethanol from cassava is to approach pH 5.5 which is the optimum for thermotolerant α-amylase. In current industrial production, sulfuric acid or sodium hydroxide is used to achieve this. Our results show that sulfuric acid could be completely replaced with acetic acid, thus avoiding a series of adverse problems caused by sulfuric acid.

Evidence has also been gathered showing that typical S. cerevisiae cells grown on glucose cannot metabolize acetic acid due to the activation of glucose repression pathways.21 Thus, yeast is sensitive to acetic acid stress in the presence of glucose depending on the extracellular pH. Our work is in agreement with these findings. In glucose-containing media, yeast cells can activate an adaptive response to weak acids, and resume growth after a lag phase. Giannattasio and Mollapour & Piper22,23 reported that at pH 4.5 a much lower acetic acid concentration (100 mM) is needed to cause growth inhibition comparable to pH 5.5. At pH 4.5 the uncharged molecules enter cells primarily by facilitated diffusion through the Fps1p aquaglyceroporin channel,24 encounter a more neutral pH in the cytoplasm, and dissociate into acetate and protons. The protons promote cytoplasmic acidification thereby inhibiting important metabolic processes.25

3.3. pH-Dependent acetic acid toxicity

Table 3 shows, for the total acid concentrations studied, the amount of undissociated acid present at different pH values. For any given total acetic acid concentration, the quantity of undissociated acetic acid increases as pH falls (Table 3). For example, at pH 4.5 undissociated acid accounts for 64% of the total, but this falls to 36% at pH 5.0. Fermentation was inhibited at pH 4.5 when the concentration of acetic acid exceeded 100 mM, but this did not affect fermentation at pH 5.5. Therefore, acetic acid toxicity depends on pH and the concentration of undissociated acid. However, Thomas17 observed that at the same concentration of undissociated acetic acid, yeast grew to a higher cell density at pH 3.0 (104 mM total acetic acid) than at pH 4.5 (167 mM total acetic acid). This implies that both the proportion of undissociated form and the total concentration of the acid play important roles in growth inhibition.
Table 3 Concentrations of undissociated acid in medium at different pH values for various total acids
Total acid concentration/mmol L−1 Concentration of undissociated acid (mmol L−1)
pH 4.0 pH 4.5 pH 5.0 pH 5.5
0 (control) 0 0 0 0
50 42.4 32.0 18.0 7.6
100 84.8 64.0 36.0 15.1
150 127.1 96.0 54.0 22.7
200 169.5 128.0 72.0 30.2
250 211.9 160.0 90.0 37.7


Depending on their concentrations as well as on their lipophilic character, weak acids may cause microbial cell growth, cytostasis, or cell death delay.26–28 The decrease in biomass yields can be attributed to the higher rate of glucose diversion to intracellular pH homeostasis due to the diffusion of acetate or fumarate into the cell when the medium is supplemented with acetate or fumarate.29

Previous studies showed that the integrated ethanol–methane fermentation process is an efficient approach for the treatment of ethanol production wastewater.4,8,9,30 However, there are still some problems with the process. For example, employing sulfuric acid for pH regulation generates sulfate-contaminated wastewater. Hulshoff and coworkers adopted anaerobic treatment of sulphate-rich wastewaters.31 However, under anaerobic conditions, sulfate-reducing bacteria (SRB) use sulfate as electron acceptor in the oxidation of an energy substrate with the production of H2S.32 H2S is a toxic gas, and is likely to give rise to corrosion of steel and concrete due to sulfuric acid generation.33 Moreover, H2S may have a toxic effect on cellular mechanisms. In the fermentation of cassava for ethanol production the process pH was reduced, and consequently the use of sulfuric acid minimized, by recycling a mixture of 40% thin stillage and 60% of its digestate.4 However, the pH of the mixture was still too high for optimal activity of α-amylase. In this study, acetic acid was used instead of sulfuric acid to adjust pH, which not only resolved the adverse effects caused by sulfuric acid but also increased ethanol production. Moreover, by-product glycerol production was decreased in the process. These results are consistent with those of Zhao and coworkers,34 who studied the application of acetic acid buffering capacity in pH adjustment of sorghum mash. Other researchers also found that acetic acid can promote ethanol fermentation.25,35 However, further study is required to explain the mechanism of promoting ethanol production.

4. Conclusions

The integrated ethanol-methane fermentation process has been improved by employing acetic acid for pH control. This eliminates many of the problems associated with the use of sulfuric acid. At the same time, the ethanol yield from glucose was increased and the glycerol yield decreased. In addition, the new process achieved the goal of “zero wastewater” in the ethanol production process.

Conflict of interest

The authors declared that they have no conflicts of interest to this work.

Acknowledgements

This study was financially supported by the following projects: 1. Shandong Province Natural Science Foundation of University Joint Special-Project granted No. ZR2013CL007. 2. Independent Research Program of Jiangnan University Youth Fund granted No.1012050205150710. 3. Suzhou Science and Technology Support Project granted No. SS201412. 4. National Natural Science Foundation of China granted No. 21506075. 5. The Fundamental Research Funds for the Central Universities granted No. JUSRP51504.

References

  1. B. Vanholme, T. Desmet, F. Ronsse, K. Rabaey, F. Van Breusegem, M. De Mey, W. Soetaert and W. Boerjan, Front. Recent Dev. Plant Sci., 2013, 4, 174 Search PubMed.
  2. J. Hill, E. Nelson, D. Tilman, S. Polasky and D. Tiffany, Proc. Natl. Acad. Sci. U. S. A., 2006, 103, 11206–11210 CrossRef CAS PubMed.
  3. R. Leng, C. Wang, C. Zhang, D. Du and G. Pu, J. Cleaner Prod., 2008, 16, 374–384 CrossRef.
  4. K. Wang, J.-H. Zhang, P. Liu, H.-S. Cao and Z.-G. Mao, J. Cleaner Prod., 2014, 75, 57–63 CrossRef CAS.
  5. N. K. Saha, M. Balakrishnan and V. S. Batra, Resour., Conserv. Recycl., 2005, 43, 163–174 CrossRef.
  6. J. S. Kim, B. G. Kim, C. H. Lee and S. W. Kim, J. Cleaner Prod., 1997, 263–267 CrossRef.
  7. H. J. Jördening and J. Winter, Environmental Biotechnology: Concept and Application, Wiley-VCH Verlag GmbH & Co. KGaA, Weinheim, Germany, 2005 Search PubMed.
  8. C. M. Zhang, Z. G. Mao, X. Wang, J. H. Zhang, F. B. Sun, L. Tang and H. J. Zhang, Bioprocess Biosyst. Eng., 2010, 33, 1067–1075 CrossRef CAS PubMed.
  9. Q. H. Zhang, X. Lu, L. Tang, Z. G. Mao, J. H. Zhang, H. J. Zhang and F. B. Sun, J. Hazard. Mater., 2010, 179, 635–641 CrossRef CAS PubMed.
  10. S. J. W. H. Oude Elferink, A. Visser, L. W. Hulshoff Pol and A. J. M. Stams, FEMS Microbiol. Rev., 1994, 15, 119–136 CAS.
  11. S. A. Shojaosadati, H. R. Sanaei and S. M. Fatemi, J. Chem. Technol. Biotechnol., 1996, 67, 362–366 CrossRef CAS.
  12. W. M. Ingledew, The Alcohol book, ed. K. A. Jacques, T. P. Lyons and D. R. Kelsall, Nottingham University Press, Nottingham, UK, 2003, pp. 343–354 Search PubMed.
  13. R. Devantier, S. Pedersen and L. Olsson, Appl. Microbiol. Biotechnol., 2005, 68, 622–629 CrossRef CAS PubMed.
  14. K. Wang, Z. Mao, C. Zhang, J. Zhang, H. Zhang and L. Tang, Bioresour. Technol., 2012, 120, 206–211 CrossRef CAS PubMed.
  15. A. C. Wilkie, K. J. Riedesel and J. M. Owens, Biomass Bioenergy, 2000, 19, 63–102 CrossRef CAS.
  16. X. Wu, D. Wang, S. R. Bean and J. P. Wilson, Cereal Chem., 2006, 83, 127–131 CrossRef CAS.
  17. K. C. Thomas, S. H. Hynes and W. M. Ingledew, Appl. Environ. Microbiol., 2002, 68, 1616–1623 CrossRef CAS PubMed.
  18. D. A. Abbott and W. M. Ingledew, Biotechnol. Lett., 2004, 26, 1313–1316 CrossRef CAS PubMed.
  19. Z. P. Guo, L. Zhang, Z. Y. Ding, Z. X. Wang and G. Y. Shi, Appl. Microbiol. Biotechnol., 2009, 82, 287–292 CrossRef CAS PubMed.
  20. M. L. D.-D. O. Phowchinda and P. Strehaiano, Biotechnol. Lett., 1995, 17, 237–242 CrossRef.
  21. J. W. Filip Rolland and J. M. Thevelein, FEMS Yeast Res., 2002, 2, 183–201 CrossRef.
  22. S. Giannattasio, N. Guaragnella, M. Zdralevic and E. Marra, Front. Microbiol., 2013, 4, 33 CAS.
  23. M. Mollapour and P. W. Piper, FEMS Yeast Res., 2006, 6, 1274–1280 CrossRef CAS PubMed.
  24. M. Mollapour and P. W. Piper, Mol. Cell. Biol., 2007, 27, 6446–6456 CrossRef CAS PubMed.
  25. N. Arneborg, L. Jespersen and M. Jakobsen, Arch. Microbiol., 2000, 174, 125–128 CrossRef CAS PubMed.
  26. P. A. A. M. Stratford, FEMS Microbiol. Lett., 1996, 142, 53–58 CrossRef PubMed.
  27. M. S. a. P. A. Anslow, Lett. Appl. Microbiol., 1998, 27, 203–206 Search PubMed.
  28. C. O. C. Peter Piper, K. Hatzixanthis and a. M. Mollapour, Microbiology, 2001, 147, 2635–2642 CrossRef PubMed.
  29. E. Bellissimi, J. P. van Dijken, J. T. Pronk and A. J. van Maris, FEMS Yeast Res., 2009, 9, 358–364 CrossRef CAS PubMed.
  30. K. Wang, J. Zhang, L. Tang, H. Zhang, G. Zhang, X. Yang, P. Liu and Z. Mao, Bioresour. Technol., 2013, 148, 453–460 CrossRef CAS PubMed.
  31. P. N. L. L. Look, W. Hulshoff Pol, A. J. M. Stams and G. Lettinga, Biodegradation, 1998, 9, 213–224 CrossRef.
  32. G. Boshoff, J. Duncan and P. D. Rose, Water Res., 2004, 38, 2651–2658 CrossRef CAS PubMed.
  33. P. Madden, A. M. Al-Raei, A. M. Enright, F. A. Chinalia, D. de Beer, V. O'Flaherty and G. Collins, Front. Microbiol., 2014, 5, 376 Search PubMed.
  34. R. Zhao, S. R. Bean, B. A. Crozier-Dodson, D. Y. Fung and D. Wang, J. Ind. Microbiol. Biotechnol., 2009, 36, 75–85 CrossRef CAS PubMed.
  35. C. N. a. G. L. Mohammad and J. Taherzadeh, Chem. Eng. Sci., 1997, 52, 2653–2659 CrossRef.

Footnote

Electronic supplementary information (ESI) available. See DOI: 10.1039/c6ra04129a

This journal is © The Royal Society of Chemistry 2016
Click here to see how this site uses Cookies. View our privacy policy here.