S. Vivek‡
,
P. Arunkumar‡ and
K. Suresh Babu*
Centre for Nanoscience and Technology, Madanjeet School of Green Energy Technology, Pondicherry University, Puducherry, India. E-mail: sureshbabu.nst@pondiuni.edu.in; Tel: +91-413-2654976
First published on 3rd May 2016
Efficient and economic catalysts are required for the large scale degradation of hazardous pollutants. In the present work, two nickel (5 wt%) based compounds, Ni(NO3)2 and NiO, immobilized over a CeO2 surface were tested for the reduction of 4-nitrophenol. Size, structural and surface properties of the catalyst were characterized by XRD, SEM & TEM – EDX, FTIR and Raman spectroscopy. UV-visible spectroscopic results indicated the better catalytic performance of the Ni(NO3)2 support than that of NiO supported CeO2. The reduction rate of 4-nitrophenol in the presence of the Ni(NO3)2 support was found to be 12 times faster than that of NiO supported CeO2. The time-dependent Raman spectroscopic investigation demonstrated that the performance of Ni(NO3)2 supported CeO2 arises from the in situ generation of nickel in the presence of an excess of sodium borohydride in the reduction of 4-nitrophenol. Further, the reversible conversion of nickel to nickel nitrate enabled the recyclability of the Ni(NO3)2 supported CeO2. The formation of nickel was found to be important for the reduction of 4-nitrophenol as NiO supported CeO2 did not form nickel thereby exhibiting poor catalytic activity. Thus, the present work showcases the in situ generation of nickel as a novel strategy for the catalytic reduction of 4-nitrophenol.
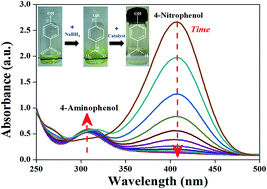
A non-noble metal catalyst such as nickel has the advantages of higher catalytic activity, low cost and ease of availability.10,11 A few reports are available on the effect of nickel on the catalytic reduction of NP, but nickel suffers from aggregation which significantly reduces the surface area leading to the closure of catalytically active sites.12 As a result, lower surface area decreases the overall catalytic activity and reduces the recyclability of the catalyst. In order to overcome this aggregation problem, the catalyst is immobilized over the support material such as carbon, zirconia, ceria, alumina, titania, etc.13–16 Nickel supported catalysts have been extensively investigated for the reduction of NP in the presence of sodium borohydride.17–20
CeO2 is reported to be one the effective support for Ni and widely used as a heterogeneous catalyst due to its strong metal support interaction nature with Ni.21,22 This property of CeO2 in turn improves the dispersion and induces the transition in the oxidation state of the support metal, which increases the active phase and performance of the catalyst.23 Conventionally Ni supported ceria have been prepared by the wet impregnation of Ni over support followed by the reduction under an inert atmosphere which adds up more cost and time for the bulk production.24 However, no reports are available in studying the catalytic performance of the in situ generated Ni for the reduction of NP which is likely to lead a simple, economic and scalable process. In the present work, we report the performance of two compounds, namely, nickel nitrate and nickel oxide on their relative ability to reduce nitrophenol with respect to catalytic activity as well as recyclability. Thus, the reported procedure likely to eliminate the post reduction process for the formation Ni and overcome the agglomeration related issues.
The Raman spectra of the support material and after nickel impregnation are shown in Fig. 2. The Raman spectra for all the samples exhibited an intense band at ∼465 cm−1, which corresponds to the F2g symmetric vibrational mode for CeO2.28 Additionally, a weak peak at 600 cm−1 was observed in all the samples that can be attributed to the oxygen vacancy induced by the Ce3+ concentration.29 In CN along with the F2g band, a symmetric peak at ∼1050 cm−1 was observed due to the vibrational mode of the nitrate group (ν1NO3−) which was absent in the CeO2 support. This confirms the presence of nickel nitrate impregnated over the support.30 Bulk NiO exhibits first order transverse optical mode (1TO) mode (∼440 cm−1) and longitudinal optical (1LO) mode (∼560 cm−1) in Raman spectra.31–33 The broad spectra for CNA around the range of 575 cm−1 can be attributed to the overlapping of 1TO and 1LO mode of NiO along with 465 and 600 cm−1 peaks of CeO2. This broad spectrum (575 cm−1) in CNA along with F2g band confirms the presence of NiO over CeO2 support. The absence of a peak at 1050 cm−1 in CNA further confirms the complete conversion of nickel nitrate into nickel oxide.
To understand the functional group modification, Fourier transform infrared spectra (FTIR) were recorded at room temperature for all the samples. FTIR spectra of CeO2 and CN shown in Fig. 3, exhibits two bands around ∼3400 and ∼1648 cm−1 which corresponds to the asymmetric stretching mode of ν (O–H) and δ (O–H) from the surface adsorbed water. All the samples exhibited a sharp absorption band around ∼1380 cm−1 corresponds to the vibrational mode of ν(Ce–O–Ce).34 FTIR spectra of the as-prepared CeO2 exhibited weak absorption around 1058 and 834 cm−1 due to the presence of residual nitrate moiety (ν(NO3−)) over CeO2 surface. In CN the observed bands at 1383 and 1058, 834 cm−1 corresponds to the asymmetric stretching mode of the nitrate group, ν(NO3−). The presence of nitrate vibrational band along with CeO2 in CN confirms the impregnation of Ni(NO3)2 over CeO2 support. Subsequent heating of CN at 400 °C for 1 hour, oxidizes the Ni(NO3)2 to NiO leading to the formation of NiO impregnated over CeO2 support (CNA). The removal of water during the heating process lead to the disappearance of peaks at 3400 and 1648 cm−1 in CNA. The broad peak around ∼430 cm−1 in CNA can be attributed to the Ni–O vibration mode, which confirms the impregnation of NiO over CeO2 surface.35 FTIR, XRD and Raman studies confirm the presence of Ni(NO3)2 and NiO over CeO2 support.
Fig. 4, shows the SEM images of the as synthesized CN and CNA along with the corresponding elemental mapping and EDX spectra. Synthesis of ceria by precipitation method resulted in a weaker agglomerated support material (CeO2) with spherical morphology for coated samples of CN and CNA as shown in Fig. 4(a and b). EDX spectra of the samples showed the presence of Ce and Ni, and the elemental analysis confirmed the presence of ∼5 wt% of nickel in both CN and CNA. Further elemental image mapping shows the uniform distribution of Ni over CeO2 in both CN and CNA. In CNA, other elements such as Al and Si were found which could have emerged from the aluminum stub and silicon glue from the carbon tape used to hold the sample.
![]() | ||
Fig. 4 SEM images of CN (a) and CNA (b) along with the corresponding elemental mapping and EDX spectra. |
The microstructure of the as-synthesized CN and CNA were characterized through TEM and HRTEM analysis (Fig. 5). The low and high magnification TEM images of CN and CNA clearly indicates the presence of CeO2 with no significant change in morphology and crystallite size (as support retains the same size). The nickel based catalysts got infiltrated between the CeO2 crystallites as represented by the TEM images. Corresponding selected area electron diffraction (SAED) pattern in Fig. 5 shows a series of rings that can be indexed to cubic fluorite structured CeO2. Though EDX data (ESI Fig. 1†) confirms the presence of nickel, no diffraction pattern corresponding to nickel compounds were observed suggesting the presence of later in the amorphous form in CN and CNA, supporting our XRD results. The in-detailed interfacial microstructure between CeO2 and nickel based material were observed from HRTEM image (Fig. 5(c) and (f)) clearly indicates the strong infiltration of catalyst over CeO2 support. Further, HRTEM images clearly indicate the presence of regular lattice fringes with an interplanar spacing of 0.313 and 0.318 nm for CN and CNA, respectively, corresponding to the (111) plane of CeO2. However, no lattice fringes were observed in nickel based material due to the existence of catalyst in amorphous nature. The corresponding EDX spectrum of low magnification TEM images (ESI Fig. 1†) demonstrates the uniform distribution of ∼5 wt% of nickel based catalyst supported over CeO2 crystallites in both CN and CNA. Thus, TEM studies exhibit the microstructural and interfacial interaction between the CeO2 and nickel based catalyst at nano level.
![]() | ||
Fig. 5 HRTEM images of as CN (a–c) and CNA (d–f); inset in (a) and (d) represents the selected area diffraction pattern of the corresponding samples. |
![]() | ||
Fig. 6 UV-visible spectroscopy for (a) addition of NaBH4 converts NP (326) to NP ions (404 nm) (b) CN (c) CNA and (d) CeO2 (e) reaction rate. |
In the presence of CN catalyst, the degradation of the yellowish colour of NP was complete (Fig. 6(b)), in contrast degradation was incomplete in the presence of CNA (Fig. 6(c)) at the equal time interval of 50 minutes. Hence, it can be observed that the CN reduces the NP faster than that of CNA. In order to check the catalytic activity of support material alone, the synthesised CeO2 alone without any supported catalyst is added to the catalytic solution is shown in the Fig. 6(d). The presence of CeO2 did not alter the absorption of NP ion indicates the inert nature of support material during the catalytic process for the reduction of NP to AP.
The changes in the absorbance with respect to time corresponds to the reaction rate during the reduction process of NP to AP. The concentration of NP, NaBH4 and supported catalyst in the solution was maintained constant in order to compare the relative catalytic performance. Due to the presence of high concentration of NaBH4, the catalytic reaction is considered as pseudo-first-order reaction, thereby the reaction rate depends only on the concentration of NP. Since the reaction is pseudo-first-order, the linear correlation between initial absorption (Co) and absorption at the different interval (Ct) with respect to time (t) apparently yields the reaction rate constant (kp).
This pseudo-first-order reaction rate (kp) was calculated from the linear slope value obtained from ln(Ct/Co) with respect to time (t) using the eqn (1) as shown in the Fig. 6(e).
ln(Ct/Co) = kpt | (1) |
The reaction rate constant values were obtained from the logarithmic slope of the absorbance yield at 404 nm obtained for NP with time for the various catalysts. The reaction rate was found to be 0.0673, 0.0056 and 0.0010 min−1 for CN, CNA and CeO2, respectively. Thus, the nickel nitrate impregnation over CeO2 (CN) shows 12 times improvement in catalytic activity over nickel oxide supported CeO2 (CNA).
To elucidate the role of nickel nitrate and nickel oxide in the absence of support, the same materials were tested separately for the catalytic activity. Fig. 7(a and b) shows the UV-visible spectra for the reduction of NP to AP in the presence of an unsupported catalyst. In the case of Ni(NO3)2, the reduction was completed within 5 minutes as shown in the UV-visible spectra (Fig. 7(a)). However, recovering back of Ni(NO3)2 after the completion of the reaction is less possible, as the unsupported Ni(NO3)2 were difficult in separating from the reaction mixture through centrifugation, which limits the practical application during the recyclability process. Thus, the presence of support is required for the effective recovery of the catalyst during the recycling process. But NiO showed negligible activity than Ni(NO3)2 as indicated by the negligible absorbance changes in UV-visible spectra at 404 nm of NP ions (Fig. 7(b)).
In order to understand the mechanism of catalytic reaction in real time, in situ Raman spectroscopic studies were carried out. The changes in CN and CNA on the addition of NaBH4 was monitored through in situ Raman Spectroscopy. The Ni–N or Ni–O stretching modes provide an important insight into the mechanism of catalytic activity over the reduction of NP to AP. Raman spectrum recorded (ESI Fig. 2†) in the presence of CN dispersed in water along with the addition of NaBH4 in the solution. The mole ratio between NaBH4 to the catalyst was maintained at a ratio of 10:
1. In the case of CN, strong bands were observed at 465 and 1050 cm−1 which arise due to stretching of mode Ce–O and NO3−, respectively. However, the weak band at 400 cm−1 corresponding to Ni–N could not be observed in CN due to the lower weight (5 wt%) percentage of catalyst loading on the support material which limits the detection level of the weak band in Raman spectroscopy. In order to understand the catalytic mechanism, pure Ni(NO3)2 in the solution along with NaBH4 was directly employed instead of CN for in situ Raman investigation as it clearly shows all the vibration mode of Ni(NO3)2 other than CeO2. Since on understanding, the weak band Ni–N stretching modification is important to elucidate the mechanism of the catalyst during the reduction process of NP to AP.
After adding NaBH4 (0.2 M) to Ni(NO3)2 solution, Raman spectra were recorded at a time interval of every 15 minutes as shown in Fig. 9. Before the addition of NaBH4, Ni(NO3)2 solution exhibited three peaks at 400, 720 and 1050 cm−1 similar to that of Fig. 8. Immediately upon adding NaBH4 to the nitrate solution (0 minutes), the peak at 400 cm−1 disappeared while the peak at 720 and 1050 cm−1 remains unaffected. Raman spectroscopic result at 0 minute shows the presence of nitrate stretching alone with the absence of Ni–N stretching mode. This modification can be attributed to the formation of metallic nickel. As pure Ni metal is Raman inactive, which support the in situ generation of Ni from Ni(NO3)2 under reducing environment at 0 minutes. The spectra (Fig. 9) taken after 15 minutes shows the minor intensity at 400 cm−1 due to the regeneration of Ni–N stretching band. With the increase in time (30 and 45 minutes), the intensity of the vibrational band at 400 cm−1 increases indicates the gradual regeneration of Ni–N from metallic Ni. Thus, the addition of reducing agent resulted in the formation of nickel and subsequent regeneration of nickel nitrate with respect to time was supported by the strong metal-nitrate stretching band present in the Raman spectra. Fig. 10, shows the optical image of color changes associated with the addition of NaBH4 in Ni (NO3)2 solution. The transparent green solution of Ni(NO3)2 converted to blackish opaque solution upon addition of NaBH4 indicates the formation of nickel. The black color Ni metal solution slowly regenerates back into green color Ni(NO3)2 as evident from the gradual change from black to green color with increase in time.
In the case of CNA dispersed in water the broad spectra between the ranges of 400 to 600 cm−1 can be attributed to the overlapping of NiO and CeO2 vibrational mode. Thus pure NiO was tested under Raman spectroscopy in order to monitor the reduction process of NiO to Ni, upon addition of NaBH4 (ESI Fig. 3†). But the addition of NaBH4 did not alter the peak positions of NiO indicates the difficulties in reduction of NiO to Ni metal, supporting the slow reduction rate of NP to AP. Thus, in situ Raman spectroscopic results indicate that the catalytic performance depends on the ease of converting a nickel compound to metal which is involved in the reduction of NP to AP and subsequent regeneration of nickel ion for potential recyclability.
In the present work the metal catalyst (nickel) was in the form of nitrate and oxide supported over CeO2. The reaction products formed during the reduction process and its available Gibbs free energy are summarized in eqn (2) and (3).43
Ni(NO3)2 + NaBH4 + 2H2O → Ni + 2NO3 + NaBO2 + 4H2, ΔG° = −377.39 kJ | (2) |
NiO + NaBH4 + H2O → Ni + NaBO2 + 3H2, ΔG° = −347.27 kJ | (3) |
The ease of formation of nickel by NaBH4 mediated reduction differs with respect to nitrate (NO3−) or oxide (O2−). In the case of CN, the nitrate molecules easily get reduced to form nickel metal over CeO2 surface as observed from Raman spectroscopy analysis (Fig. 9).44 Thus, the catalytic performance in CN arises due to the in situ conversion of Ni(NO3)2 to Ni supported over CeO2 in the presence of NaBH4.4 The reduction process of Ni(NO3)2 to Ni is more favourable in the presence of NaBH4, as the bonding between nickel to nitrate is weak van der Walls force which resulted in higher negative value of Gibbs free energy (ΔG°, eqn (1)). The formation of metallic nickel supported CeO2 surface act as an adsorption site for nitrophenolate ions and hydrogen, thereby efficiently reducing NP to AP. However in the open atmosphere the reducing agent of NaBH4 is not strong enough to retain the reduced Ni metal without an external stabilizing agent, hence with the time the reduced nickel converts back to its original form by reacting with the nitrate molecule present in the solution (eqn (4)) is evident from the in situ Raman spectroscopy.45
Ni + 2(NO3) → Ni(NO3)2 | (4) |
However, in the solution due to the absence of any stabilizing agent nickel converts back to Ni(NO3)2 over CeO2 once the evolution of hydrogen from the BH4− completes.41 The high concentration of NaBH4 extends the duration of stability in the form of metallic nickel was extended up to ∼100 minutes was sufficient enough to complete the reduction of 0.01 mM of NP to AP as evident from the rate constant value calculated from the UV-visible spectrum (Fig. 5). The reduction of NP to AP got completed within 45 minutes over 5 mg of CN.
In CNA, the reduction process of NiO to Ni in the presence of NaBH4 requires higher activation energy due to the presence of strong Ni–O bond which makes the generation of metallic nickel difficult for the catalysis as denoted by lower negative value of ΔG° value. Hence, the probability of reduction process of NiO into Ni over CeO2 support is low in the presence of NaBH4, which in turn slows down the reduction process of NP to AP as evident from the reaction rate constant calculated from the UV-visible spectrum (Fig. 6). The catalytic activity of 5 mg of CNA during the reduction process was incomplete even after 120 minutes which denotes the insufficient active sites of metal for catalytic reduction of NP to AP.
Cycle number | Rate constant (min−1) | Time take for complete conversion (∼minutes) |
---|---|---|
1 | 0.0633 | 55 |
2 | 0.0597 | 63 |
3 | 0.0415 | 70 |
4 | 0.0384 | 81 |
Footnotes |
† Electronic supplementary information (ESI) available. See DOI: 10.1039/c6ra04120e |
‡ Equally contributed to the work. |
This journal is © The Royal Society of Chemistry 2016 |