Optically transparent electrodes for spectroelectrochemistry fabricated with graphene nanoplatelets and single-walled carbon nanotubes

Jesus Garoz-Ruiza, David Ibañeza, Edna C. Romeroa, Virginia Ruizb, Aranzazu Heras*a and Alvaro Colina*a
aDepartment of Chemistry, Universidad de Burgos, Pza. Misael Bañuelos s/n, E-09001 Burgos, Spain. E-mail: maheras@ubu.es; acolina@ubu.es; Fax: +34 947258831; Tel: +34 947258817
bIK4-CIDETEC, Materials Division, P° Miramón 196, E-20009 San Sebastián, Spain

Received 15th February 2016 , Accepted 18th March 2016

First published on 21st March 2016


Abstract

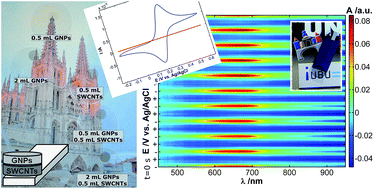
Optically transparent electrodes (OTEs) are needed for a wide range of applications such as solar cells, printable electronics, touch screens, light emitting diodes or flexible displays. Furthermore, OTEs are required for normal transmission spectroelectrochemistry measurements to obtain simultaneously electrochemical and spectroscopic responses. The search for new materials with a good transparency and conductivity, the basic requirements for an OTE, is outstanding. For this reason, carbon allotropes, such as graphene nanoplatelets (GNPs) and single-walled carbon nanotubes (SWCNTs), have been used in the present work in order to fabricate GNPs/SWCNTs-OTEs. The methodology used to fabricate these hybrid electrodes, based on vacuum filtration techniques, has several advantages such as the use of commercial nanomaterials, an easy cleaning of the final electrode and the availability of the process to almost any laboratory. The optimization of transparency and conductivity of these new electrodes has been achieved by design of experiments, showing that a percolation threshold of SWCNTs needs to be reached to ensure a minimum conductivity. The suitable performance of the GNPs/SWCNTs-OTEs has been validated by studying a film of poly(3,4-ethylenedioxythiophene):poly(styrenesulfonate) (PEDOT:PSS) by spectroelectrochemistry.


1. Introduction

Carbon nanomaterials are becoming more and more important in different fields such as electronic devices,1 catalysis,2 reinforcing materials3 and energy conversion4 and storage.5 These new materials will conquer areas that need optically transparent electrodes (OTEs) due to their prospective advantages,6 leading to the replacement of the indium tin oxide (ITO),7 because of its well-known limitations and the limited availability of indium sources.8 Furthermore, the applications of carbon nanomaterials in analytical chemistry,9 specifically in electrochemistry,10,11 have been growing significantly in recent years.12

Single-walled carbon nanotubes (SWCNTs) are a carbon allotrope with special electronic,13 optical14 and electrochemical15 properties. Due to their extraordinary conductivity, electrocatalytic effect and inertness, SWCNTs have a great importance in the field of electroanalysis,16 for example, in the detection of biomolecules by spectroelectrochemistry17 and in electrochemical microfluidic sensing.18,19 Networks of carbon nanotubes are considered as a new transparent and flexible electrode that can be seen as an alternative to ITO electrodes.20 Our group has previously developed a methodology, based on filtering a dispersion of SWCNTs and press-transferring the homogeneous film formed, to fabricate SWCNTs-OTEs easily and reproducibly.21 Moreover, the good conductivity and optical transparency of low-pressure transferred SWCNTs films have also given very satisfactory results in spectroelectrochemistry applications.22

Graphene, a hexagonal bidimensional network of carbon atoms, is another carbon allotrope with remarkable hardness, strength, flexibility, thermal behaviour, electrical conductivity and transparency.23 These properties allow graphene to be used as one of the best transparent electrodes,24 for example in organic electronics, improving the behaviour under bending of ITO electrodes that show irreversible failures.25 Graphene has also been widely employed for electrochemical sensing,26 among many other applications.27 Carbon nanotubes and graphene are being increasingly used together for different applications,28 being filtration a methodology that is achieving promising results even for transparent electrodes.29,30

Graphene nanoplatelets (GNPs) are layers of stacked graphene sheets with high surface area that are easier to obtain and handle than graphene. Their electrochemical properties have been deeply studied, for example, in order to determine endocrine-disrupting chemicals.31 GNPs have been used as a solid phase extraction sorbent for the quantitative analysis of phthalate esters in aqueous solutions.32 They have also been used for other applications such as electrochemical detection of biomarkers and DNA bases,33 adsorption and removal of pharmaceutical pollutants in order to solve environmental problems34 and development of biosensors35 and temperature sensors.36

OTEs play important roles in information and energy technologies and their importance today is unquestionable. According to the advantages previously mentioned, carbon nanomaterials are being included in the development of OTEs devices,37 for example, SWCNTs in screens that detect touch force and location38 and GNPs in solar cells.39

Meanwhile, spectroelectrochemistry is a hybrid multi-response technique that involves recording the spectra evolution of an electrochemical process. Transmission spectroelectrochemistry in normal configuration requires the use of OTEs to allow the light beam to pass directly through the electrode surface. Therefore, materials with a good electrical conductivity and optical transparency are needed. Benefits associated with carbon based OTEs, such as the wide working potential window, the good electrochemical activity, the chemical stability under different pH conditions and the simplicity of surface modification, are already known for spectroelectrochemistry40 and are expected to be improved with the use of GNPs and SWCNTs together.

Therefore, in this work we transfer these commercial nanomaterials on various substrates in a homogeneous, versatile, quick and inexpensive way. Polymer composites filled with GNPs and carbon nanotubes show an improved electrical performance.41,42 In addition, several methodologies including microwave irradiation43 or filtration44 have allowed GNPs and carbon nanotubes to be jointly used. Screen-printed pressure sensors,45 free-standing papers prepared by filtration for lithium ion batteries,46 filtered sheets with piezoresistive behaviour for multi-directional strain sensing,47 temperature stable supercapacitors48 and hydrogen gas sensors,49 are some applications in which carbon nanotubes and GNPs are currently being used together.

Our group has previously demonstrated the good behaviour of SWCNTs-OTEs.21,22,50,51 Therefore, the key point of the present work is the fabrication of homogeneous GNPs/SWCNTs-OTEs in a simple, clean and reproducible way. We have overcome the disadvantages related to other methods (some of them cited above) such as the large number of steps, long fabrication time, the need of curing processes, high temperatures, functionalization of the carbon nanomaterials or lack of homogeneity, as well as the use of strong etching agents, solvent mixtures, dispersing agents, surfactants and high cost techniques or instruments.

The new methodology is based on the use of well-dispersed commercial GNPs and SWCNTs in an organic solvent. No surfactant or dispersing agent was used to prepare these dispersions and no chemicals were used to dissolve the filter, reducing the risk of contamination with these species and improving the homogeneity of the films. GNPs and SWCNTs quantities used to fabricate GNPs/SWCNTs-OTEs have been optimized to get the best transparency and conductivity. The suitability of these GNPs/SWCNTs-OTEs has been demonstrated with the spectroelectrochemical characterization of poly(3,4-ethylenedioxythiophene) (PEDOT).52

2. Experimental

2.1. Reagents and materials

GNPs (average thickness of 8–12 nm, particle diameters less than 2 μm and a surface area of 600–750 m2 g−1, grade three, CheapTubes), SWCNTs (0.7–1.1 nm in diameter, (7,6) chirality, Sigma-Aldrich), 1,2-dichloroethane (DCE, Acros Organics), hydrophilic polytetrafluoroethylene (PTFE) membrane (filter pore size 0.1 μm, JVWP01300, Millipore Omnipore), poly(ethylene terephthalate) (PET, 175 μm thick, HiFi Industrial Film), silver conductive paint (Electrolube) and epoxy protective overcoat (242-SB, ESL Europe) were used to fabricate the GNPs/SWCNTs-OTEs. Ferrocenemethanol (FcMeOH, 97%, Sigma-Aldrich) and KCl (Acros Organics) were used to prepare the solutions.

Poly(3,4-ethylenedioxythiophene):poly(styrenesulfonate) (PEDOT:PSS, Sigma-Aldrich) and LiClO4 (Acros Organics) were used to test the spectroelectrochemical performance of the GNPs/SWCNTs-OTEs.

All the reagents were used as received without further purification. All chemicals were of analytical grade. Aqueous solutions were prepared using high purity water (resistivity of 18.2 MΩ cm, Milli-Q gradient A10 system, Millipore) and they were freshly prepared or stored at 4 °C, when necessary.

For safety considerations, all handling and processing were performed carefully, particularly when DCE was used.

2.2. Instrumentation

Transmittance was measured using a halogen light source (HL-2000, Avantes) and a spectrometer (S2000, Ocean Optics). The light beam, supplied by the halogen light source, was conducted to and collected from the spectroscopic cell (qpod2e, Quantum Northwest) by 200 μm optical fibers (Ocean Optics).

All electrochemical experiments were performed using a potentiostat/galvanostat (CHI900, CH Instruments or PGSTAT302N, Metrohm Autolab) and a standard three-electrode cell with a GNPs/SWCNTs-OTE as working electrode, a gold wire as counter electrode and a homemade Ag/AgCl/KCl 3 M as reference electrode.

Spectroelectrochemistry setup included a potentiostat/galvanostat (PGSTAT302N, Metrohm Autolab), a halogen light source (DH-2000, Ocean Optics), two collimating lenses, a cuvette, two optical fibers (Ocean Optics) and a spectrometer (QE65000 198–1006 nm, Ocean Optics).

A tip-sonicator (CY-500, Optic ivymen System) and a laboratory hydraulic press (Spectropress, Chemplex Industries, Inc.) were also used to fabricate the electrodes. Raman characterization was carried out with a Confocal Raman Voyage (BWTEK). A laser wavelength of 532 nm with a power of 5 mW was employed to obtain the spectra using a 20× objective. The spectral resolution was 3.8 cm−1.

Field emission scanning electron microscopy (FE-SEM) images were recorded on a Philips XL 30 S FEG microscope.

2.3. Electrode fabrication

Electrodes have been fabricated according to a methodology based on one of our previous works for SWCNTs-OTEs.21 Several modifications have been carried out to allow us to fabricate OTEs with GNPs and SWCNTs together. The whole process is illustrated in Fig. 1 and it consists of seven simple and consecutive steps.
image file: c6ra04116g-f1.tif
Fig. 1 Fabrication process of GNPs/SWCNTs-OTEs: (a) preparation of the GNPs and SWCNTs dispersions, (b) filtration of the GNPs dispersion, (c) filtration of the SWCNTs dispersion, (d) press-transference of the bilayer film, (e) removing of the PTFE filter, (f) silver electrical contacts and (g) isolation of the silver electrical contacts.

Firstly, 5 mg L−1 GNPs and 5 mg L−1 SWCNTs dispersions in DCE were prepared (Fig. 1a). GNPs and SWCNTs dispersions were separately ultrasonicated using a tip-sonicator without adding surfactants. The procedure was slightly different according to each carbon nanomaterial. On the one hand, 80 mL of DCE were added to 0.5 mg of GNPs. This dispersion was sonicated applying a power of 130 W for 30 minutes. Then, DCE was added to obtain a dispersion volume of ca. 90 mL which was sonicated once more at the same power for 5 minutes. Finally, the volume was adjusted to 100 mL. On the other hand, 10 mL of DCE were added to 0.5 mg of SWCNTs. This dispersion was sonicated applying a power of 250 W for 15 min. Then, DCE was added to obtain a dispersion volume of ca. 90 mL which was sonicated again at 100 W for 20 minutes. This SWCNTs dispersion was sonicated more vigorously at 250 W for 20 min. Finally, the volume was adjusted to 100 mL. Before using both dispersions the following days to prepare the GNPs/SWCNTs-OTEs, 10 mL of each dispersion were sonicated for 15 minutes at 100 W to ensure a proper homogeneity without nanomaterial agglomeration. The fact that no surfactant was needed to prepare these two dispersions avoids the contamination of the electrode with this kind of species.

The second step was the vacuum filtration of the desired volume of the GNPs dispersion to form a film on the PTFE filter (Fig. 1b).

Two minutes later, the desired volume of the SWCNTs dispersion was filtered through the GNPs/PTFE filter obtaining a second homogeneous film on the GNPs one (Fig. 1c). This vacuum filtration technique provides highly homogeneous hybrid GNPs/SWCNTs films. The filter with both films was dried at room temperature for five minutes to achieve a proper transference during the next step.

Next, PET sheets were washed with deionised water and dried. Afterwards, the press-transference of the GNPs/SWCNTs film to the PET sheets was performed by applying 28 ± 1 tons for about ten minutes using a hydraulic press (Fig. 1d).

Then, the filter was carefully separated using tweezers (Fig. 1e) obtaining a good adhesion of the SWCNTs side of the hybrid film to the PET support and being the GNPs film on its upper side. The use of pressure in the transference step, avoiding the use of chemicals to remove the filter, reduces the contamination sources of the final electrode.

The homogeneity and optical transparency of the 0.785 cm2 films are easily observed in Fig. 2, where films with different composition are shown.


image file: c6ra04116g-f2.tif
Fig. 2 A Burgos Cathedral photograph is observed through different GNPs/SWCNTs films transferred on PET.

Electrical contacts were made with a line of silver conductive paint from the film to the end of PET that was dried in an oven at 75 °C for 45 minutes (Fig. 1f).

Finally, silver conductive paint was electrically isolated by an insulating epoxy protective overcoat which was dried in the oven at the same temperature for 2 hours (Fig. 1g).

For comparative purposes, electrodes with only GNPs or with only SWCNTs were also prepared.

In conclusion, our proposed methodology has been used to prepare press-transfer commercial GNPs, SWCNTs and hybrid GNPs/SWCNTs films on a flexible, polymeric, non-conductive and optically transparent support in a reproducible, simple and clean way, available for all laboratories.

2.4. Electrode characterization

A FE-SEM image of a hybrid GNPs/SWCNTs-OTE fabricated by filtration of 0.3 mL of the GNPs and 0.58 mL of the SWCNTs dispersions is shown in Fig. 3. As can be observed, GNPs are deposited on the SWCNTs film. It is noteworthy that GNPs are interconnected by the SWCNTs film but not between them.
image file: c6ra04116g-f3.tif
Fig. 3 FE-SEM image of a hybrid GNPs/SWCNTs-OTE fabricated by filtration of 0.3 mL of the GNPs and 0.58 mL of the SWCNTs dispersions.

Raman spectroscopy represents one of the most useful characterization techniques for carbon nanomaterials. Fig. 4 shows the spectra of three electrodes fabricated by filtering different volumes of the corresponding nanomaterial dispersions. PET spectrum has been subtracted.


image file: c6ra04116g-f4.tif
Fig. 4 Raman spectra of three electrodes fabricated, according to the proposed methodology, filtering the following dispersion volumes: 2 mL of GNPs (blue line), 0.5 mL of SWCNTs (green line) and, both consecutively, 2 mL of GNPs and 0.5 mL of SWCNTs (orange line).

The GNPs/PET film shows three main bands at 1336 cm−1, 1577 cm−1 and 2622 cm−1 attributed to the characteristic GNPs D, G and 2D bands, respectively.53 The G band at 1577 cm−1 and the 2D band centered at 2622 cm−1 indicate that our GNPs are not a high quality graphene. Furthermore, the small band at 2435 cm−1 reveals the presence of graphite.

Meanwhile, SWCNTs have also been widely studied by Raman spectroscopy54 and Raman spectroelectrochemistry.55,56 In agreement with these works, the characteristic Raman bands of SWCNTs are observed on the SWCNTs/PET film. The band at 1592 cm−1, so-called G band, corresponds to the tangential displacement modes of SWCNTs, while the band at 1337 cm−1, so-called D band, is related to the disorder induced mode. The band peaking at 2631 cm−1, the so-called G′ band, is referred to the high frequency two phonon mode.

As might be expected, the GNPs/SWCNTs/PET electrodes show Raman bands related to the two carbon nanomaterials. Therefore, Raman spectra shown in Fig. 4 demonstrate that both materials can be successfully press-transferred to PET substrates, and that GNPs are attached to the SWCNTs layer.

Consequently, the method proposed opens up new avenues in the fabrication of homogeneous hybrid films useful in electrochemistry and spectroelectrochemistry in an easy, reproducible and cost effective way.

3. Results and discussion

In order to assess the performance of the OTEs, their electrochemical responses were studied in the boundary conditions, fabricating the electrodes only with GNPs or SWCNTs. Cyclic voltammetry of 6 × 10⁻⁴ M FcMeOH in 0.1 M KCl between −0.20 V and +0.60 V at 0.01 V s−1 was carried out, Fig. 5. The cyclic voltammogram obtained with the SWCNTs electrode shows a good electrochemical behaviour where the reversible oxidation of FcMeOH is observed, as can be inferred from the value of 0.081 V for the difference between the anodic and the cathodic peak potential (ΔEp), close to the expected value of 0.059 V. Actually, ΔEp depends on the concentration of FcMeOH for the same electrode, as will be shown below. However, the conductivity of the GNPs electrode was too low as can be inferred from the absence of any redox process. GNPs alone are not able to form an interconnected and conducting network (percolation threshold) with a proper transparency using this methodology. This shows that SWCNTs form interconnected networks (see a FE-SEM image in Fig. S1 of the ESI) more easily than GNPs which may be due to the different structure of each carbon nanomaterial. Therefore, one-dimensional tubes (SWCNTs) are better than two-dimensional platelets (GNPs) to fabricate OTEs on inert surfaces with this methodology. In view of the results depicted in Fig. 5, we can conclude that the fabrication of OTEs made only of these commercial low cost GNPs is not possible. It should be mentioned that when high-quality exfoliated graphene is used, the methodology based on press-transferring graphene films obtained by filtration is capable of fabricating graphene-OTEs with good electrochemical responses.57 Nevertheless, GNPs/SWCNTs-OTEs show better electrochemical performance than high-quality exfoliated graphene-OTEs reported for similar electrodes in literature57 for the same level of transparency.
image file: c6ra04116g-f5.tif
Fig. 5 Cyclic voltammograms obtained with two OTEs made of only GNPs or only SWCNTs. Experimental conditions in text.

However, with the methodology proposed in this work it is possible to fabricate good performing OTEs with an external layer of GNPs supported on a conductive SWCNTs film, GNPs/SWCNTs-OTEs. A first methodology was used, filtering the GNPs and SWCNTs dispersions separately in two different filters. Initially, the SWCNTs film was press-transferred on the PET support. Afterwards, the GNPs film was press-transferred on top of the SWCNTs film. This methodology was discarded because it did not show the expected results in terms of homogeneity of the GNPs film on the SWCNTs one. For these reasons, a second methodology based on the filtration of the two nanomaterial dispersions through the same filter sequentially was developed. From this point onwards, this will be the methodology used in this work to fabricate these carbon OTEs, which has been widely explained in the electrode fabrication section. The new methodology provides homogeneous bilayer electrodes of these two carbon nanomaterials (GNPs/SWCNTs-OTEs).

A design of experiments was performed in order to evaluate the influence of the volume of the GNPs (VGNPs) and SWCNTs (VSWCNTs) dispersions used in the filtration step, on the spectroscopic and electrochemical behaviour of the GNPs/SWCNTs-OTEs, analysed in terms of transparency and conductivity, respectively. Transparency was evaluated by measuring the transmittance at 550 nm (T550) and taking the PET sheet as reference spectrum. Meanwhile, conductivity was evaluated by measuring the voltammetric reversibility, expressed as the peak potential difference between the anodic and the cathodic peak (ΔEp). Cyclic voltammetry experiments of 6 × 10⁻⁴ M FcMeOH in 0.1 M KCl between −0.20 V and +0.60 V at 0.01 V s−1 were carried out to measure the voltammetric reversibility. T550 and ΔEp were measured five times for each sample. With the aim of minimizing experimental costs, a response surface with only eleven runs in a rotatable central composite design 22 with star and three center points was performed. VGNPs and VSWCNTs were the two experimental factors used to study the response variables (T550 and ΔEp). The order of the experiments was fully randomized. Preliminary studies were carried out to delimitate the range of variability of the two experimental factors, finding that the best range was between 0.55 and 3.2 mL for VGNPs (concentration of 5 mg L−1) and between 0.28 and 1.6 mL for VSWCNTs (concentration of 5 mg L−1).

Fig. 6 shows the response surfaces for T550 and ΔEp with respect to the values of VGNPs and VSWCNTs.


image file: c6ra04116g-f6.tif
Fig. 6 Response surfaces of the design of experiments for (a) transmittance of the GNPs/SWCNTs-OTEs at 550 nm, T550, and (b) peak potential difference, ΔEp, obtained in the cyclic voltammetry of FcMeOH, with respect to VGNPs and VSWCNTs. Experimental conditions in text.

As can be seen in Fig. 6a, T550 is affected by both VGNPs and VSWCNTs because the two experimental factors are significant for the response. The optimal transparency is the maximum value of T550, being logically achieved at the lowest values of these two factors, VGNPs and VSWCNTs. T550 decreases with increasing VGNPs and VSWCNTs, but not exactly in the same scale. The increase of VSWCNTs contributes more than the increase of VGNPs to decrease the T550. Meanwhile, as it is shown in Fig. 6b, conductivity follows a different trend. VSWCNTs is the only significant factor. The response surface consists of vertical regions, indicating that the increase of VSWCNTs is responsible for the decrease of ΔEp which is related to a better conductivity of the electrode. If VSWCNTs is not high enough, there is not an interconnected network of SWCNTs and ΔEp increases indicating a poor conductivity of the electrode. Besides, the influence of these GNPs to create a conducting interconnected network is really low, being always necessary the presence of SWCNTs. Therefore, the need to reach a percolation threshold of SWCNTs is undoubtedly required to allow the GNPs/SWCNTs bilayer to have a minimum conductivity to be used as OTEs. Indeed, the fact that carbon nanotubes act as an efficient supporting and catalytic material to enhance the electrochemical properties of graphene has been previously reported.58 Therefore, in terms of ΔEp, conductivity is almost independent of the amount of GNPs for each amount of SWCNTs. Thus, it is possible to fabricate SWCNTs electrodes modified with GNPs just making sure that there is an interconnected SWCNTs network as substrate.

It is noteworthy that high amounts of GNPs and SWCNTs provide voltammograms where the ratio between the intensity of the anodic and cathodic peaks is greater than one in reversible one-electron systems. This result has been previously reported for SWCNTs,21 indicating that the excess of the carbon nanomaterial can lead to unexpected electrochemical behaviours. Moreover, the transparency decreases considerably, leading to worse OTEs. Therefore, experiments performed in this design of experiments indicate that the amount of these carbon nanomaterials should be higher than a lower limit of SWCNTs to achieve a good conductivity of the film, and lower than an upper limit of both, GNPs and SWCNTs, to obtain a good transparency, avoiding unexpected electrochemical behaviours.

The main goal of this work is the fabrication of electrodes for spectroelectrochemistry with different GNPs/SWCNTs ratios, always with a good transparency and conductivity. The design of experiments has allowed us to prove a large number of possibilities to fabricate electrodes changing the amounts of GNPs and SWCNTs. However, T550 is lower than 35% in approximately half of the design shown in Fig. 6a, suitable for many applications but too low to be considered good for OTEs. For this reason, a smaller experimental domain is needed in order to study highly transparent GNPs/SWCNTs-OTEs.

Following the same strategy, a new design of experiments was performed changing both VGNPs and VSWCNTs between 0.1 and 0.5 mL (concentration of 5 mg L−1). Again, cyclic voltammetry of 6 × 10⁻⁴ M FcMeOH in 0.1 M KCl between −0.20 V and +0.60 V at 0.01 V s−1 was performed. Results obtained with this second design of experiments were coherent with those of the previous one, but now they supplied more information. By reducing the experimental domain, T550 increased to values between 48% and 95%, clearly higher than those obtained in the first design of experiments where T550 varied between 4% and 69%. Fig. 7 shows the cyclic voltammograms registered with several GNPs/SWCNTs-OTEs with different conducting and optical properties obtained in this second design of experiments.


image file: c6ra04116g-f7.tif
Fig. 7 Cyclic voltammograms of different GNPs/SWCNTs-OTEs (a) below percolation threshold of SWCNTs network, and (b) above percolation threshold of SWCNTs network. Experimental conditions in text.

Analysing the results related to the conductivity, two different behaviours were clearly observed depending on the amount of SWCNTs. As can be seen in Fig. 7a, when VSWCNTs was lower than 0.3 mL ill-defined cyclic voltammograms were registered, indicating that the percolation threshold of the SWCNTs network was not achieved and yielding films with poor conductivity. In this case, increasing the amount of GNPs helps to improve the conductivity as can be observed in Fig. 7a where better responses are obtained at higher VGNPs values for electrodes fabricated with 0.1 mL of the SWCNTs dispersion. The typical shape of the reversible voltammogram of FcMeOH is not observed (Fig. 7a), but the higher the VGNPs, the better the peak definition and the higher the current intensity.

Significantly better electrochemical responses were obtained when VSWCNTs was high enough to establish a good SWCNTs interconnected network that guarantees a proper conductivity to the electrode (Fig. 7b). Percolation threshold was achieved by filtering at least 0.3 mL of the SWCNTs dispersion, corresponding to ca. 0.002 mg of SWCNTs per cm2 of electrode area. In this case, all GNPs/SWCNTs-OTEs show a really good electrochemical performance and a high transparency. The presence of a higher VGNPs did not show any significant difference in terms of electrochemical behaviour when a good interconnected SWCNTs network made by filtering 0.5 mL of the SWCNTs dispersion is established. This fact can be explained in terms of achieving a reversible electrochemical behaviour. On the contrary, transparency is highly influenced by VGNPs.

Thus, depending on the specific application of the GNPs/SWCNTs-OTEs, different GNPs/SWCNTs ratios can be selected with, a priori, excellent results. As it is shown in Fig. 7b, the strategy of design of experiments has allowed us to fabricate a collection of GNPs/SWCNTs-OTEs easily, with different GNPs/SWCNTs ratios, using our press-transfer methodology and offering suitable transparency and good electrochemical properties.

A set of cyclic voltammetries of 6 × 10⁻⁴ M FcMeOH in 0.1 M KCl between −0.20 V and +0.60 V at different scan rates, between 0.002 V s−1 and 0.250 V s−1, were performed to study the electrochemical behaviour of GNPs/SWCNTs-OTEs (Fig. 8). Here, a GNPs/SWCNTs-OTE obtained using VGNPs = 0.1 mL and VSWCNTs = 0.5 mL was used. A linear relationship between the anodic peak current (ip) and the square root of the potential scan rate (v1/2) was obtained. Therefore, the oxidation of FcMeOH is a diffusion-controlled electrochemical process, and according to Randles-Sevcik equation, eqn (1), the diffusion coefficient of FcMeOH can be estimated:

 
image file: c6ra04116g-t1.tif(1)
where F is the Faraday's constant (96[thin space (1/6-em)]485 C mol−1), R the ideal gas constant (8.314 J mol−1 K−1), T the temperature (293 K), n the number of electrons transferred in the redox reaction (1), A the electrode area (0.3925 cm2), D the diffusion coefficient and C the bulk concentration (6 × 10⁻⁷ M cm−3). From the slope of the calibration curve of ip vs. v1/2 (inset of Fig. 8), an experimental value of 5.7 × 10⁻⁶ cm2 s−1 is obtained, very similar to those in literature (6.1 × 10⁻⁶ cm2 s−1).59


image file: c6ra04116g-f8.tif
Fig. 8 Cyclic voltammograms of FcMeOH at different potential scan rates between 0.002 V s−1 and 0.250 V s−1. Inset: Randles–Sevcik behaviour. Experimental conditions in text.

Two different applications of this type of OTEs are shown in Fig. 9. First, a GNPs/SWCNTs-OTE, fabricated with VGNPs = 0.3 mL and VSWCNTs = 0.58 mL (FE-SEM image in Fig. 3), was used in order to demonstrate the usefulness of GNPs/SWCNTs-OTEs for electroanalytical purposes. A set of different calibration samples of FcMeOH in 0.1 M KCl were prepared and cyclic voltammetry experiments between −0.20 V and +0.60 V at 0.01 V s−1 were performed (Fig. 9a). As can be seen in the calibration curve shown in the inset of Fig. 9a, the anodic peak current intensity follows a highly linear relationship with FcMeOH concentration in the 5–216 μM range (R2 = 0.9999, Syx = 3.4 × 10⁻⁸).


image file: c6ra04116g-f9.tif
Fig. 9 (a) Cyclic voltammograms carried out with a GNPs/SWCNTs-OTE using FcMeOH concentrations ranged between 5 and 216 μM. Inset: calibration curve of FcMeOH. (b) 3D spectroelectrochemistry contour during ten consecutive doping/dedoping scans of PEDOT in a GNPs/SWCNTs-OTE. In the y axis, “−” is referred to a potential applied of −0.70 V and “+” to a potential applied of +0.70 V. Inset: the GNPs/SWCNTs-OTE modified with PEDOT by drop casting. Experimental conditions in text.

GNPs/SWCNTs films have a resistance that contributes to the measured ΔEp. A plot of ΔEp vs. FcMeOH concentration, Fig. S2, shows a linear behaviour indicating the existence of an uncompensated resistance, according to Ohm's law, because the higher the concentration, the higher the current, Fig. 9a. At concentrations lower than 10 μM, there is not influence of this uncompensated resistance of the film because the current is very low and ΔEp takes the expected value of 0.059 mV.

In addition, GNPs/SWCNTs-OTEs were also tested with a conducting polymer such as PEDOT which shows colour changes associated with its oxidation state. Here, a GNPs/SWCNTs-OTE was fabricated with VGNPs = 0.3 mL and VSWCNTs = 0.4 mL. A 100 μL drop of PEDOT:PSS diluted 1[thin space (1/6-em)]:[thin space (1/6-em)]100 in water was placed on the electrode surface covering it entirely. The electrode was dried at room temperature for two days whereupon a homogeneous and highly transparent GNPs/SWCNTs-OTE modified with PEDOT:PSS was obtained (inset of Fig. 9b). Ten cyclic voltammetry scans in 0.2 M LiClO4 between −0.70 V and +0.70 V at 0.1 V s−1 were carried out using a Pt wire as counter electrode, a homemade Ag/AgCl/KCl 3 M as reference electrode and the GNPs/SWCNTs-OTE modified with PEDOT:PSS as working electrode. One spectrum in normal transmission configuration between 450 and 950 nm was taken every 100 ms along the experiment. A suitable performance of the GNPs/SWCNTs-OTE modified with PEDOT during the normal transmission spectroelectrochemistry experiment is observed in the three-dimensional contour shown in Fig. 9b. PEDOT is uncoloured in its oxidized and blue in its reduced state.60 The spectra evolution with time/potential demonstrates the excellent spectroelectrochemistry behaviour of PEDOT in these GNPs/SWCNTs-OTEs, where a great adhesion of the polymer to the GNPs is achieved.

Finally, several GNPs/SWCNTs-OTEs have been easily fabricated using the proposed methodology, allowing us to design OTEs with different transparency and conductivity depending on the application in a reproducible way. In order to demonstrate the excellent reproducibility of the GNPs/SWCNTs-OTEs fabrication method, five cyclic voltammograms performed with five different electrodes are plotted in Fig. S3 of the ESI, and their corresponding parameters are displayed in Table S1 of the ESI. The electrode area was limited to 0.3925 cm2. As can be observed, very reproducible values are obtained, 0.100 ± 0.005 V for ΔEp and 15.54 ± 0.15 μA for the anodic peak current. These GNPs/SWCNTs-OTEs were fabricated with the same experimental conditions (VGNPs = 0.4 mL and VSWCNTs = 0.5 mL). A FE-SEM image of one of these electrodes can be found in Fig. S4 of the ESI.

4. Conclusions and future perspectives

In this work we have fabricated a new type of hybrid OTEs based on SWCNTs and GNPs. In addition to this, we propose a new methodology that can be widely used by the scientific community to modify SWCNTs electrodes with, for example, GNPs. Nevertheless, other carbon nanomaterials could also be used. GNPs/SWCNTs-OTEs have been fabricated by filtration of GNPs and SWCNTs dispersions and press-transferring the bilayer film on a polymeric insulating support, not requesting an underlying conductive substrate. We show the need to create a conducting layer of SWCNTs to allow the GNPs/SWCNTs-OTEs to have a suitable conductivity with a good transparency. The proposed methodology is fast, simple, reproducible and inexpensive, affording preparation of homogeneous and clean GNPs/SWCNTs-OTEs in any laboratory, while circumventing some disadvantages of previous wet processing methods. In addition, transparency and conductivity have been optimized with a strategy based on design of experiments. On the one hand, transparency is affected by both carbon nanomaterials but more intensively by SWCNTs because they contribute more than GNPs to decreasing transmittance. On the other hand, a minimum amount of SWCNTs is needed to establish a well-interconnected SWCNTs network (percolation threshold) which is undoubtedly required to ensure a good conductivity for these hybrid GNPs/SWCNTs-OTEs. Several GNPs/SWCNTs-OTEs with different ratios of both commercial carbon nanomaterials and excellent transparency and conductivity have been easily fabricated. In order to demonstrate their good performance for different applications, they have been checked by electrochemical quantification procedures and normal transmission spectroelectrochemistry. This methodology can be easily used to prepare different types of bilayer films. Our work lays the groundwork for fabricating a conducting SWCNTs layer that can be homogeneously and easily modified with other carbon nanomaterials (that are able to form a conducting film or not, such as the particular case of this work). Currently, we are optimizing electrodes with different types of graphene in order to improve the sensitivity of the OTEs for neurotransmitters detection.

Acknowledgements

Financial support made available by the Ministerio de Economía y Competitividad (CTQ2014-55583-R, CTQ2014-61914-EXP) is gratefully acknowledged. Jesus Garoz-Ruiz also acknowledges Ministerio de Educación, Cultura y Deporte for his FPU fellowship and Caja de Burgos for his grant in the “Excellent Youth” social program. David Ibañez thanks Ministerio de Economía y Competitividad for his post-doctoral fellowship (CTQ2014-61914-EXP). SIdI of Universidad Autónoma de Madrid and Isidoro Poveda are acknowledged for FE-SEM images.

References

  1. C. Biswas and Y. H. Lee, Adv. Funct. Mater., 2011, 21, 3806–3826 CrossRef CAS.
  2. J. Zhu, A. Holmen and D. Chen, ChemCatChem, 2013, 5, 378–401 CrossRef CAS.
  3. E. Alishahi, S. Shadlou, S. Doagou-R and M. R. Ayatollahi, Macromol. Mater. Eng., 2013, 298, 670–678 CrossRef CAS.
  4. P. Trogadas, T. F. Fuller and P. Strasser, Carbon, 2014, 75, 5–42 CrossRef CAS.
  5. L. Dai, D. W. Chang, J.-B. Baek and W. Lu, Small, 2012, 8, 1130–1166 CrossRef CAS PubMed.
  6. K. Ellmer, Nat. Photonics, 2012, 6, 809–817 CrossRef CAS.
  7. M. Layani, A. Kamyshny and S. Magdassi, Nanoscale, 2014, 6, 5581–5591 RSC.
  8. A. Kumar and C. Zhou, ACS Nano, 2010, 4, 11–14 CrossRef CAS PubMed.
  9. B. Pérez-López and A. Merkoçi, Microchim. Acta, 2012, 179, 1–16 CrossRef.
  10. R. L. McCreery, Chem. Rev., 2008, 108, 2646–2687 CrossRef CAS PubMed.
  11. A. Walcarius, S. D. Minteer, J. Wang, Y. Lin and A. Merkoçi, J. Mater. Chem. B, 2013, 1, 4878–4908 RSC.
  12. K. Scida, P. W. Stege, G. Haby, G. A. Messina and C. D. García, Anal. Chim. Acta, 2011, 691, 6–17 CrossRef CAS PubMed.
  13. E. Bekyarova, M. E. Itkis, N. Cabrera, B. Zhao, A. Yu, J. Gao and R. C. Haddon, J. Am. Chem. Soc., 2005, 127, 5990–5995 CrossRef CAS PubMed.
  14. H. Kataura, Y. Kumazawa, Y. Maniwa, I. Umezu, S. Suzuki, Y. Ohtsuka and Y. Achiba, Synth. Met., 1999, 103, 2555–2558 CrossRef CAS.
  15. I. Dumitrescu, P. R. Unwin and J. V. Macpherson, Chem. Commun., 2009, 6886–6901 RSC.
  16. L. Agüí, P. Yáñez-Sedeño and J. M. Pingarrón, Anal. Chim. Acta, 2008, 622, 11–47 CrossRef PubMed.
  17. J. Garoz-Ruiz, D. Izquierdo, A. Colina, S. Palmero and A. Heras, Anal. Bioanal. Chem., 2013, 405, 3593–3602 CrossRef CAS PubMed.
  18. D. Vilela, J. Garoz, Á. Colina, M. C. González and A. Escarpa, Anal. Chem., 2012, 84, 10838–10844 CrossRef CAS PubMed.
  19. D. Vilela, A. Martín, M. C. González and A. Escarpa, Analyst, 2014, 139, 2342–2347 RSC.
  20. D. Choi, M.-Y. Choi, H.-J. Shin, S.-M. Yoon, J.-S. Seo, J.-Y. Choi, S. Y. Lee, J. M. Kim and S.-W. Kim, J. Phys. Chem. C, 2010, 114, 1379–1384 CAS.
  21. J. Garoz-Ruiz, S. Palmero, D. Ibañez, A. Heras and A. Colina, Electrochem. Commun., 2012, 25, 1–4 CrossRef CAS.
  22. J. Garoz-Ruiz, A. Heras, S. Palmero and A. Colina, Anal. Chem., 2015, 87, 6233–6239 CrossRef CAS PubMed.
  23. R. R. Nair, P. Blake, A. N. Grigorenko, K. S. Novoselov, T. J. Booth, T. Stauber, N. M. R. Peres and A. K. Geim, Science, 2008, 320, 1308 CrossRef CAS PubMed.
  24. J. K. Wassei and R. B. Kaner, Mater. Today, 2010, 13, 52–59 CrossRef CAS.
  25. S. Pang, Y. Hernandez, X. Feng and K. Müllen, Adv. Mater., 2011, 23, 2779–2795 CrossRef CAS PubMed.
  26. S. Kochmann, T. Hirsch and O. S. Wolfbeis, TrAC, Trends Anal. Chem., 2012, 39, 87–113 CrossRef CAS.
  27. X. Zhang, B. R. S. Rajaraman, H. Liu and S. Ramakrishna, RSC Adv., 2014, 4, 28987–29011 RSC.
  28. Z. Fan, J. Yan, L. Zhi, Q. Zhang, T. Wei, J. Feng, M. Zhang, W. Qian and F. Wei, Adv. Mater., 2010, 22, 3723–3728 CrossRef CAS PubMed.
  29. L. Peng, Y. Feng, P. Lv, D. Lei, Y. Shen, Y. Li and W. Feng, J. Phys. Chem. C, 2012, 116, 4970–4978 CAS.
  30. G. Xin, W. Hwang, N. Kim, S. M. Cho and H. Chae, Nanotechnology, 2010, 21, 405201 CrossRef PubMed.
  31. Q. Wan, H. Cai, Y. Liu, H. Song, H. Liao, S. Liu and N. Yang, Chem.–Eur. J., 2013, 19, 3483–3489 CrossRef CAS PubMed.
  32. X. Luo, F. Zhang, S. Ji, B. Yang and X. Liang, Talanta, 2014, 120, 71–75 CrossRef CAS PubMed.
  33. C. S. Lim, C. K. Chua and M. Pumera, Analyst, 2014, 139, 1072–1080 RSC.
  34. L. A. Al-Khateeb, S. Almotiry and M. A. Salam, Chem. Eng. J., 2014, 248, 191–199 CrossRef CAS.
  35. S. S. J. Aravind, T. T. Baby, T. Arockiadoss, R. B. Rakhi and S. Ramaprabhu, Thin Solid Films, 2011, 519, 5667–5672 CrossRef CAS.
  36. M. Tian, Y. Huang, W. Wang, R. Li, P. Liu, C. Liu and Y. Zhang, J. Mater. Res., 2014, 29, 1288–1294 CrossRef CAS.
  37. D. S. Hecht, L. Hu and G. Irvin, Adv. Mater., 2011, 23, 1482–1513 CrossRef CAS PubMed.
  38. K. Kim, K. Shin, J.-H. Han, K.-R. Lee, W.-H. Kim, K.-B. Park, B.-K. Ju and J. Pak, Electron. Lett., 2011, 47, 118–120 CrossRef CAS.
  39. L. Kavan, J. H. Yum and M. Grätzel, ACS Nano, 2011, 5, 165–172 CrossRef CAS PubMed.
  40. Y. Dai, G. M. Swain, M. D. Porter and J. Zak, Anal. Chem., 2008, 80, 14–22 CrossRef CAS PubMed.
  41. L. Yue, G. Pircheraghi, S. A. Monemian and I. Manas-Zloczower, Carbon, 2014, 78, 268–278 CrossRef CAS.
  42. S. Araby, N. Saber, X. Ma, N. Kawashima, H. Kang, H. Shen, L. Zhang, J. Xu, P. Majewski and J. Ma, Mater. Des., 2015, 65, 690–699 CrossRef CAS.
  43. V. Sridhar, H.-J. Kim, J.-H. Jung, C. Lee, S. Park and I.-K. Oh, ACS Nano, 2012, 6, 10562–10570 CAS.
  44. S. Park, J. An, J. W. Suk and R. S. Ruoff, Small, 2010, 6, 210–212 CrossRef CAS PubMed.
  45. D. Janczak, M. Słoma, G. Wróblewski, A. Młożniak and M. Jakubowska, Sensors, 2014, 14, 17304–17312 CrossRef PubMed.
  46. Y. Hu, X. Li, J. Wang, R. Li and X. Sun, J. Power Sources, 2013, 237, 41–46 CrossRef CAS.
  47. S.-H. Hwang, H. W. Park and Y.-B. Park, Smart Mater. Struct., 2013, 22, 015013 CrossRef.
  48. R. S. Borges, H. Ribeiro, R. L. Lavall and G. G. Silva, J. Solid State Electrochem., 2012, 16, 3573–3580 CrossRef CAS.
  49. A. Kaniyoor and S. Ramaprabhu, Carbon, 2011, 49, 227–236 CrossRef CAS.
  50. A. Heras, A. Colina, J. López-Palacios, A. Kaskela, A. G. Nasibulin, V. Ruiz and E. I. Kauppinen, Electrochem. Commun., 2009, 11, 442–445 CrossRef CAS.
  51. A. Heras, A. Colina, J. López-Palacios, P. Ayala, J. Sainio, V. Ruiz and E. I. Kauppinen, Electrochem. Commun., 2009, 11, 1535–1538 CrossRef CAS.
  52. G. Kaur, R. Adhikari, P. Cass, M. Bown and P. Gunatillake, RSC Adv., 2015, 5, 37553–37567 RSC.
  53. A. C. Ferrari, J. C. Meyer, V. Scardaci, C. Casiraghi, M. Lazzeri, F. Mauri, S. Piscanec, D. Jiang, K. S. Novoselov, S. Roth and A. K. Geim, Phys. Rev. Lett., 2006, 97, 187401 CrossRef CAS PubMed.
  54. M. S. Dresselhaus, A. Jorio, M. Hofmann, G. Dresselhaus and R. Saito, Nano Lett., 2010, 10, 751–758 CrossRef CAS PubMed.
  55. L. Kavan and L. Dunsch, ChemPhysChem, 2007, 8, 974–998 CrossRef CAS PubMed.
  56. D. Ibañez, E. C. Romero, A. Heras and A. Colina, Electrochim. Acta, 2014, 129, 171–176 CrossRef.
  57. T. Campos Hernández, A. C. Fernández Blanco, A. T. Williams, M. Velický, H. V. Patten, A. Colina and R. A. W. Dryfe, Electroanalysis, 2015, 27, 1026–1034 CrossRef.
  58. K.-S. Kim, K.-Y. Rhee and S.-J. Park, Mater. Res. Bull., 2011, 46, 1301–1306 CrossRef CAS.
  59. P. Liljeroth, C. Johans, C. J. Slevin, B. M. Quinn and K. Kontturi, Electrochem. Commun., 2002, 4, 67–71 CrossRef CAS.
  60. B. Zanfrognini, A. Colina, A. Heras, C. Zanardi, R. Seeber and J. López-Palacios, Polym. Degrad. Stab., 2011, 96, 2112–2119 CrossRef CAS.

Footnote

Electronic supplementary information (ESI) available. See DOI: 10.1039/c6ra04116g

This journal is © The Royal Society of Chemistry 2016
Click here to see how this site uses Cookies. View our privacy policy here.