DOI:
10.1039/C6RA04058F
(Paper)
RSC Adv., 2016,
6, 35267-35279
Fabrication and characterization of ferritin–chitosan–lutein shell–core nanocomposites and lutein stability and release evaluation in vitro†
Received
14th February 2016
, Accepted 26th March 2016
First published on 4th April 2016
Abstract
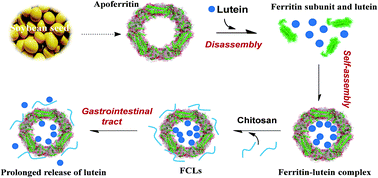
The application of bioactive lutein in the food industry is limited because of its poor water-solubility, instability, and low bioavailability. Nano-sized ferritin and chitosan provide a platform for fabricating shell–core system to encapsulate lutein. Herein, soybean seed ferritin (Glycine max) and chitosan stabilized lutein composites (FCLs) were fabricated by a unique reversible disassembly-reassembly character of apoferritin and ferritin–chitosan interaction. Results showed that lutein molecules were successfully encapsulated within the apoferritin with a molar ratio of 25.2 to 1 (lutein/ferritin), and the encapsulation efficiency and loading capacity were 16.8% and 2.50% (w/w), respectively. It was calculated that approximately 10 chitosan molecules were bound to a ferritin with a binding constant of 6.3 × 10⁵ M−1, suggesting electrostatic interaction played an important role in ferritin–chitosan interaction. Results also indicated as much as 74.1% (w/w) of lutein was retained in FCLs after storage at 20 °C for 7 days. In addition, the photo- and heat-stability of lutein in FCLs were greatly improved as compared to free lutein. Furthermore, FCLs exhibited prolonged release of lutein in simulated gastrointestinal tract (GI) digestion as a result of ferritin coating and chitosan binding. Interestingly, food components exerted different effects in lutein release, EGCG, grape seed proanthocyanidin, and milk could inhibit while pectin could facilitate the release of lutein from FCLs. This work demonstrates an innovative strategy to solubilize, stabilize and control release of functional food nutrients.
1 Introduction
Lutein (chemically designated as β,ε-carotene-3-3′-diol) (Fig. 1A), is a yellow pigment which mainly exists in egg yolk, higher plants, and other photoautotrophic organisms such as algae, and it is a member of the carotenoid family and functions as an effective nutrient to benefit human health.1–3 In recent years, lutein has also been extensively used not only as a feed additive to enhance colours of poultry feathers and to deepen the yellow of egg yolk, but also as a food additive to add flavor and colour to foods.2 Some studies have indicated that lutein also played a potential role in preventing retinal degeneration, some types of cancer, and cardiovascular diseases.4–6 Nevertheless, the application of lutein in food industry is limited mainly because it contains eight conjugated double bonds which contributes to oxygen, light and temperature instability, insolubility in water, as well as the low bioavailability in the gastrointestinal tract.7,8 Novel approaches that can improve the stability, solubility, and bioavailability of lutein will contribute to the use of lutein in functional foods.
 |
| Fig. 1 (A) Chemical structure of lutein. (B) Graphic representation of the ferritin structure. | |
Encapsulation technology has been widely used in the food and pharmaceutical industries to provide ingredients with an effective barrier which enhances their stability against environmental and chemical interactions.9 There are a number of encapsulation techniques which can be applied to lutein to improve its solubility and stability, such as PVP emulsion,10 supercritical antisolvent techniques,11 nano-encapsulation with hydroxypropylmethyl cellulose phthalate,12 and lipid based nanoparticle systems.13 However, these methods may affect sensory properties, storage, and bioactivity of the encapsulated lutein molecules, or also result in sample contamination and environmental pollution due to the presence of residual traces of surfactants or organic solvents.
Soybean seed ferritin (SSF) is a kind of multimeric iron storage and detoxification protein,14 the presence of a nanocavity and reversible assembly characteristic provide novel properties which may endow ferritin a novel vehicle for lutein encapsulation. Generally, ferritin is characterized by a spherical architecture with inner and outer diameters of 8 and 12 nm (Fig. 1B), respectively; up to 4500 atoms of iron can be stored within the protein shell in a bio-available and nontoxic form.14–16 It is composed of 24 copies of identical or similar subunits, which can be related by two, three and fourfold symmetry axes.17 An important and unique characteristic of ferritin is its reversible assembly which is reflected by disassociation of the ferritin cage at pH 2.0/11.0 or through the effect of denaturants and prompt reconstitution when pH is adjusted to pH 7.0 or the denaturant is removed.18,19 During this process, small hydrophobic molecules may be added to lipid and maintained within the ferritin shell, resulting in ferritin-small molecule (shell–core) nano-composites. Therefore, ferritin can provide a natural vehicle for encapsulation of bioactive small molecules by reducing its insolubility and nonuniformity. This reversible assembly characteristic is particularly suited to the fabrication of core–shell systems based on ferritin cage.
However, the simple use of one type of wall material may not be optimum for efficient encapsulation of bioactive molecules. Altering the composition of the shell–core exterior may improve both the protective effect and the release properties of the bioactive core, e.g., prolonging core release kinetics and increasing the likelihood of absorption.20,21 Incorporating polysaccharide materials to the exterior of the ferritin nano-cage provides a platform for fabricating core–shell delivery systems which may be capable of encapsulating hydrophobic lutein molecules. Chitosan (CS) is a linear cationic polysaccharide that exhibits good biocompatibility, non-toxicity, and biodegradability, and has been made as a favorable candidate for wall material in food encapsulation.20,22 The cationic –NH3+ group on CS in aqueous acidic media is prone to electrostatic interactions with anionic groups, such as –COO–, allowing the formation of soluble or insoluble composite agglutination.23 Ferritin as a spherical protein is rich in acidic residues such as Glu and Asp which are mainly distributed on its inner or outer surfaces, which results in a relatively low isoelectric point (pI) ranging from 5.0–6.0.14 Thus, cationic CS may interact with acidic amino acids on the ferritin cage in specific pH conditions to form the composite agglutination. During this process, if small hydrophobic molecules, such as lutein, are previously encapsulated into the ferritin cage, we hypothesize that the resulting ferritin–lutein complex would interact with CS and contribute to novel functional characteristics of the ferritin–lutein–CS dispersions.
Therefore, the objective of this study was to fabricate soluble ferritin and CS stabilized lutein dispersions (FCLs) by the reversible assembly of soybean seed ferritin and the formation of ferritin–CS electrostatic interactions, and to study the characteristics of these FCLs including lutein encapsulation efficiency, morphology, stoichiometry of ferritin and CS, leakage kinetics, thermal- and photo-degradation, and in vitro release behavior of lutein from FCLs in simulated gastrointestinal tract. The effects of different food components on the sustained release of lutein were also investigated.
2 Material and methods
2.1 Chemicals and reagents
Soybean (Glycine max) seeds were purchased from a local market, Tianjin, China. Lutein was purchased from Sigma-Aldrich, USA. Chitosan was obtained form Shandong AKbiotech Ltd., Shandong, China, its purity is about 86.03% given by the manufacturer with deacetylation of 85%, and molecular weight is an average value of 21 kDa. EGCG, ascorbic acid, tocopherol, pectin, glucose, and cellulose were obtained from Shanghai Yuanye Bio-Technology Co., Ltd., Shanghai, China. Grape seed proanthocyanidin were purchased from Jianfeng Natural Product R&D Co., Ltd. Tianjin, China. Acetonitrile, methyl alcohol, and dichloromethane were of HPLC grade (Sino-pharm Chemical Reagent Co., Ltd., Beijing, China). All other reagents were obtained from Sino-pharm Chemical Reagent Co., Ltd. (Beijing, China) and of analytical grade.
2.2 Soybean seed ferritin (SSF) isolation and purification
SSF was prepared as previously described.24 Apo soybean seed ferritin (apoSSF) was prepared as follows, ferritin (2 μM) in 0.1 M Tris–HCl buffer (pH 8.0) was dialysis against with 1% (m/v) sodium dithionite (0.1 M Tris–HCl, pH 8.0) for 8 times (12 h per time) under anaerobic conditions. Then, 2,2-bipyridyl (0.1 M MOPS buffer, pH 8.0) was used to chelate iron ions on the ferritin shell, followed by further dialysis by 0.1 M MOPS buffer (pH 8.0) to get the apoferritin.25 SDS-PAGE was performed to examine the purity of the protein under reducing conditions using 15% gels.26 The molecular weights of apoSSF were estimated by native PAGE using an 8% polyacrylamide gradient gel employing Tris–HCl (25 mM, pH 8.3) as running buffer, and the electrophoresis was run at 5 mA for 15 h, at 4 °C. Gels were then stained with Coomassie Brilliant Blue R-250. Ferritin concentration was determined according to the Lowry method using bovine serum albumin as a standard.27
2.3 Preparation of FCLs
Lutein (20.0 mg) was dissolved in ethyl alcohol to make a stock solution with a final concentration of 1.0 mM and was stored in the dark in an amber bottle at 4 °C. Two steps were involved in the preparation of the FCLs. Firstly, taking the advantage of the reversible assembly of the soybean seed ferritin,28 the pH value of the apoSSF solution (2.0 μM, 5.0 mL) was adjusted to 11.4 with NaOH (1 M) and incubated for 30 min to disassemble ferritin into subunits; subsequently, 1.5 mL of lutein stock solution was added to above solution with an apoSSF/lutein molar ratio of 1 to 150, followed by stirring for 30 min (4 °C) in the dark to produce a homogeneous solution. The pH of the resulting mixture was then adjusted to 6.0 with HCl (1.0 M), followed by incubation at 4 °C for 3 h to induce reassembly of the ferritin and to encapsulate the lutein molecules within the ferritin cage. This step produced ∼17% ethanol concentration in the lipid, thus the resulting solution was dialyzed (MW 10 kDa cutoff) against MOPS buffer (20 mM, pH 6.0) with two buffer changes (every 8.0 h intervals) to remove the ethanol and the unbound lutein by bag dialysis. Finally, the suspension was further filtered through 0.45 μm hydrophilic cellulose membrane filters to clarify the ferritin–lutein complexes; the resulting solution was centrifuged to remove the aggregates (10
000 g, 10 min, 4 °C) and was then stored at 4 °C. The encapsulation efficiency (%) and the loading capacity (%) of lutein are calculated according to eqn (1) and (2), as follows. |
Encapsulation efficiency (%) = encapsulated lutein (g)/lutein used (g) × 100%
| (1) |
|
Loading capacity (%) = encapsulated lutein (g)/FCLs (g) × 100%
| (2) |
CS was dissolved in acid buffer (pH 6.0) ready for use. The FCLs were prepared by mixing the ferritin–lutein complex (1.0 μM, 2.0 mL, pH 6.0) with different amount of CS (0, 2, 4, 6, 8, 10, 12, 15, and 20 CS/ferritin, molar ratio), stirring for 15 min, followed by standing at 20 °C for 2 h. The binding number of the CS to the complex was determined by following fluorescence titration experiment. Then, the resulting composite mixtures were dialyzed (MW 25 kDa cutoff) against MOPS buffer (20 mM pH 6.0) with four buffer changes (every 8.0 h intervals) to remove the unbound CS, resulting in the ferritin and CS stabilized lutein dispersions (FCLs). Ferritin–lutein mixture was prepared as control samples by simply mixing of lutein and apoSSF in a 150
:
1 (molar ratio) without disassembly of the protein cage, followed by the same dialysis step to that for FCLs. The lutein may associate with outer surface of protein shell and was used as control sample for further experiment.
2.4 Transmission electron microscopy analysis
Ferritin, ferritin–lutein mixtures (simply mixing of lutein and ferritin without disassembly of the ferritin cage), ferritin–lutein complex, and FCLs liquid samples were diluted in 20 mM MOPS buffer (pH 6.0) prior to placing on carbon-coated copper grids and excess solution was removed with filter paper. The four samples were then stained with 2% uranyl acetate for 5 min before being analysed by TEM.24 Experiment involved in the different ethanol concentrations (0, 17, 30%, v/v) on the ferritin morphology was also conducted by TEM.
2.5 HPLC analysis of lutein
HPLC was performed by a SSI/LabAlliance HPLC system (Scientific Systems, Inc., PA, USA) consisting of an UV detector (446 nm) and a Waters Xterra RP18 column (4.6 × 250 mm, 5 μm) (Waters Corporation, MA, USA). Samples were eluted by the use of a mobile phase consisting of acetonitrile/methyl alcohol/dichloromethane (60
:
20
:
20, v/v/v). The injection volume was 20 μL, and the flow rate of the mobile phase was 0.7 mL min−1. To assay the lutein concentration encapsulated in the ferritin cage, samples were adjusted to pH 11.4 by addition of NaOH (1 M) to disassemble the spherical structure into subunits, resulting in the release of the lutein. Released lutein was extracted with cyclohexane (2.0 mL) by blending the mixtures up and down in a 5 mL tube for several times followed by centrifugation to get the clear supernatant, and HPLC was then applied to determine lutein concentration using lutein standards.
2.6 Turbidity measurement
The absorbance of FCLs influence by different pH (4.0, 4.5, 5.0, 5.5, 6.0, 6.5, and 7.0) of the solution was determined by an Agilent 8453 UV-visible spectrophotometer (Agilent, USA) at a fixed wavelength of 570 nm according to a previous method,20 and CS and ferritin–lutein complex were used as control samples. All samples were placed in a 1 cm path length optical cell for different pH (4.0, 4.5, 5.0, 5.5, 6.0, 6.5, and 7.0) affected absorption detection. All measurements were carried out in triplicate, and the reported results are the means of the readings.
2.7 Zeta-potential analysis
The zeta-potential of the samples was analyzed by a zeta-potential analyser (Delsa™ Nano C; Beckman Coulter Inc., Fullerton, CA). Each FCLs (0.5 μM), ferritin–lutein complex (0.5 μM), and CS (5.0 μM) sample were dissolved in distilled water with different pH (4.0, 4.5, 5.0, 5.5, 6.0, 6.5, and 7.0) and continuously scanned 6 times by the zeta-potential analyser at 25 °C. All measurements were carried out in triplicate, and the reported results are the means of the readings.
2.8 Dynamic light scattering (DLS) analyses
DLS experiments were performed using a dynamic light scattering instrument (Malvern, UK), at 25 °C. OmniSIZE 2.0 software was used to calculate the size distribution of samples. The samples with a final ferritin concentration of 0.5 μM were allowed to stand for 2 h prior to DLS measurement to ensure that the reactions were complete. Experiment involved in the different ethanol concentrations (0, 17, 30%, v/v) on the ferritin morphology was also conducted by DLS.
2.9 Fluorescence titration
Fluorescence titration experiments were performed using the RF-5301PC Spectrofluorophotometer (Shimadzu, Japan). Measurements were carried out by addition of 0.0–10.0 μL of CS (500 μM) to 500 μL of the protein (0.5 μM) in 50 mM MOPS, pH 6.0, followed by a reaction time of 10 min at 25 °C. The excitation and emission wavelengths were set at 290 and 330 nm, respectively. A slit width of 5 nm and 10 nm was set for excitation and emission, respectively. To obtain the stoichiometry and binding constant, the data were fitted to eqn (3) according to a previous method29 for the binding of chitosan to n independent binding sites on the protein and the apparent binding constant, K. |
 | (3) |
here n is the binding site number and K is the apparent binding constant, [P]0 and [CS]0 are the ferritin and chitosan concentrations, and I0 and I∞ are the relative fluorescence intensities in the absence and presence of chitosan when the binding sites are fully saturated, respectively. The purity of chitosan used here is about 86.03%, and the obtained binding constant and stoichiometry value has been converted by this purity value.
2.10 Lutein release from FCLs in vitro
The FCLs sample used in release experiment is obtained by the CS and ferritin–lutein complex in a 10
:
1 molar ratio. Lutein release from FCLs in vitro was detected according to a dialysis based method.30 Three FCLs samples (6 mL) with an equivalent lutein concentration of 25.2 μM were incubated in three separate dialysis tubes (MWCO 3500) in the dark and dialyzed against 5 L of MOPS buffer (50 mM, pH 6.0) for 7 d at 4 °C, 20 °C, and 37 °C, respectively. Samples were taken every 12 hours to calculate lutein release ratio. The experiment was performed in triplicate, and the release ratio (%) was calculated according to eqn (4) as following, |
Release ratio (%) = released lutein (g)/encapsulated lutein (g) × 100%
| (4) |
2.11 Photo- and thermal-stability of lutein in FCLs
The effect of the UV radiation and ambient light on the stability of lutein encapsulated in FCLs was evaluated. Specifically, 6.0 mL of FCLs solution (1 μM ferritin, with an equivalent of 25.2 μM lutein) was exposed at a distance of 30 cm under an UV lamp (SW-CJ-1FD Series 20 W UV Lamps, Suzhou, China) with a wavelength of 254 nm or exposed to ambient light (indoor lighting) for 24 h. Free lutein (25 μM) and ferritin–lutein complex (1 μM ferritin, an equivalent of 25.2 μM lutein) solution were used as control samples, and 0.2 mL of the solution was sampled once every four hours for HPLC to quantify the remaining lutein.
To assess the thermal stability of lutein in FCLs, 6.0 mL of FCL solution (1 μM ferritin, an equivalent of 25 μM lutein) was placed in a water bath (model DK-8D, Tianjin Honour Instrument Co., Tianjin, China) which was incubated in the dark mantled by aluminium foil paper at 37 or 60 °C, respectively, for 24 h. The heated samples were assayed every three hours for residual lutein content detection by HPLC. Degradation ratio after treatment was calculated according to eqn (5) as following,
|
Degradation ratio (%) = (encapsulated lutein − residual lutein)/encapsulated lutein × 100%
| (5) |
The data obtained from UV/ambient light treatment and thermal processing experiments were fitted to first-order kinetics in eqn (6) and (7) to quantify the kinetics of lutein degradation, as follows.
|
C = Cf + (C0 − Cf)exp(−kt)
| (6) |
where
C represents the lutein content at different time points,
Cf is the lutein content in equilibrium state,
C0 represents the initial lutein content,
k is the degradation rate constant (h
−1), and
t represents the reaction time (h) in
eqn (6). The half-life (
t1/2) in
eqn (7) was calculated as the time required for lutein to decay to 50% of its initial concentration.
2.12 Lutein release in simulated stomach and small intestine conditions
The in vitro simulated gastric fluid and intestinal fluids test was performed according to the reported methods.31,32 Briefly, pepsin-free simulated gastric fluid (1 g NaCl and 3.5 mL 32% HCl were added to 0.5 L distilled water) was placed in a heated water bath (37 °C), FCLs (0.5 μM) and pepsin (3.2 g L−1) were added in the simulated gastric fluid solution (10 mL) and pH was adjusted to 2.0 with 1.0 M HCl. This gastric incubation was continuously stirred for 2.0 h, and lipid (0.2 mL) were collected at 0, 5, 10, 15, 20, 40, 60, 80, and 120 min for released lutein quantification by HPLC. Then, the pH of the resulting lipid was increased to 7.5 with 1 M NaOH and subsequently added enzyme buffer containing potassium dihydrogen phosphate (8.00 g L−1), pancreatin (4.76 g L−1), and bile salts (5.16 g L−1) to form simulated intestine fluid. The intestinal mixture was incubated for another 2.0 h at 37 °C with continuous stirring and constant pH, lipid (0.2 mL) were collected at 0, 5, 10, 15, 20, 40, 60, 80, and 120 min for released lutein quantification as measured by HPLC. Free lutein and ferritin–lutein complex were used as control samples for above procedures. Released lutein was extracted by cyclohexane (0.3 mL) for four times for lutein concentration by HPLC. All of the tested samples were absence of light. The release ratio of lutein was calculated according to eqn (5) as following, |
Release ratio (%) = released lutein (g)/encapsulated lutein (g) × 100%
| (8) |
Food components, including epigallocatechin gallate (EGCG), grape seed proanthocyanidin, ascorbic acid, tocopherol, milk, soy protein, glucose, cellulose, and pectin were separately used as control digestion additives to explore the release behavior of the lutein from FCLs. Different final concentrations of above samples, shown in Table 2, were added to the lipid before digestion. Then, the mixture solution was incubated for the continuous simulated stomach and small intestine digestion follow the same procedures described above, and the lipid (0.2 mL) were collected at fixed point of 0, 5, 10, 15, 20, 40, 60, 80, and 120 min for released lutein quantification.
Table 1 Degradation rate constant (k), half-life (t1/2), and R2 when fitting the degradation data of lutein in different samples at different conditionsb
Treatment |
Samples |
k (h−1) |
t1/2 (h) |
R2 |
FL represents the abbreviation of “Ferritin–lutein complex”. Values in the same treatment group with different letters (A–C) are significantly different (P < 0.05). |
UV radiation (254 nm) |
FCLs |
0.34 ± 0.03A |
34.70 ± 1.20A |
0.946 |
FLa |
0.38 ± 0.04B |
29.89 ± 0.44B |
0.977 |
Free lutein |
0.66 ± 0.03C |
14.19 ± 0.27C |
0.985 |
Ambien light treatment |
FCLs |
0.26 ± 0.01A |
41.22 ± 1.30A |
0.981 |
FL |
0.29 ± 0.03A |
38.21 ± 0.32A |
0.982 |
Free lutein |
0.54 ± 0.08B |
22.53 ± 0.46B |
0.953 |
Thermal processing (20 °C) |
FCLs |
0.24 ± 0.04A |
48.51 ± 1.03A |
0.966 |
FL |
0.29 ± 0.01B |
40.72 ± 0.24B |
0.928 |
Free lutein |
0.49 ± 0.05C |
25.86 ± 0.99C |
0.943 |
Thermal processing (37 °C) |
FCLs |
0.29 ± 0.06A |
39.23 ± 0.90A |
0.955 |
FL |
0.34 ± 0.01B |
32.36 ± 0.22B |
0.976 |
Free lutein |
0.62 ± 0.03C |
15.15 ± 0.48C |
0.994 |
Table 2 In vitro release of lutein from FCLs in simulated stomach and intestine digestion influenced by food components over 2 h of incubationa
Additives |
Concentrations |
Stomach digestion (%) |
Small intestine digestion (%) |
Values are means ± SD (n = 3). Values in the same treatment group with different letters (A–C) are significantly different (P < 0.05). |
None |
— |
43.60 ± 0.01A |
48.80 ± 0.23A |
EGCG |
0.50 mmol L−1 |
39.24 ± 0.04B |
43.31 ± 1.03B |
1.00 mmol L−1 |
35.29 ± 2.01B |
42.72 ± 0.24B |
1.50 mmol L−1 |
30.59 ± 0.49C |
36.86 ± 0.99C |
Grape seed proanthocyanidin |
0.02 mg mL−1 |
36.12 ± 0.63B |
38.51 ± 2.23B |
0.04 mg mL−1 |
32.27 ± 1.33C |
34.33 ± 1.56C |
0.06 mg mL−1 |
21.99 ± 0.59C |
32.26 ± 1.11C |
Ascorbic acid |
0.01 mg mL−1 |
46.20 ± 0.03A |
46.22 ± 0.01A |
0.05 mg mL−1 |
46.20 ± 1.34A |
49.89 ± 1.64A |
0.10 mg mL−1 |
45.66 ± 0.93A |
53.19 ± 2.10B |
Tocopherol |
0.01 mg mL−1 |
41.89 ± 0.04A |
46.22 ± 1.30A |
0.05 mg mL−1 |
44.26 ± 0.84A |
46.22 ± 1.30A |
0.10 mg mL−1 |
43.33 ± 1.14A |
49.22 ± 1.76A |
Glucose |
3.00 mmol L−1 |
41.67 ± 0.22A |
48.23 ± 0.19A |
4.00 mmol L−1 |
45.30 ± 1.23A |
46.36 ± 1.68A |
5.00 mmol L−1 |
44.18 ± 1.49A |
48.36 ± 2.88A |
Cellulose |
0.60%, w/v |
43.24 ± 1.27A |
49.51 ± 2.09A |
1.20%, w/v |
44.29 ± 1.01A |
47.32 ± 1.92A |
2.40%, w/v |
42.29 ± 1.53A |
47.86 ± 0.29A |
Pectin |
0.20%, w/v |
47.24 ± 1.46A |
52.51 ± 1.03B |
0.40%, w/v |
54.29 ± 2.60B |
57.72 ± 0.24B |
0.80%, w/v |
57.59 ± 1.19C |
62.86 ± 0.29C |
Milk |
0.10 mL mL−1 |
35.24 ± 0.04B |
42.51 ± 1.90B |
0.20 mL mL−1 |
32.29 ± 2.01C |
40.72 ± 0.24B |
0.40 mL mL−1 |
28.59 ± 0.49C |
34.86 ± 0.99C |
Soy protein |
0.05 mg mL−1 |
41.24 ± 0.22A |
42.51 ± 1.10B |
0.10 mg mL−1 |
36.29 ± 1.33B |
39.72 ± 0.89B |
0.20 mg mL−1 |
31.36 ± 0.49C |
38.16 ± 0.69B |
2.13 Statistical analysis
All analyses were performed in triplicate and all data were presented as mean ± standard deviation (SD). Statistical significance between treatments was determined using SPSS13.0 software. A value of P < 0.05 was considered as statistically significant.
3 Results and discussion
3.1 Preparation and characterization of apoSSF
As shown in Fig. 2A, Native PAGE showed that the purified apoSSF was resolved as a single complex with a molecular weight about 560 kDa, which was in accordance with the typical value of soybean seed ferritin.33 SDS-PAGE also indicated that the subunits of apoSSF were separated as two peptides, H-2 (28.0 kDa) versus H-1 (26.5 kDa) (Fig. 2B), which was consistent with our previous observations,18,24 indicating a successful preparation.
 |
| Fig. 2 (A) Native PAGE and (B) SDS–PAGE analyses of apoSSF. Lane 1 represents apoSSF and the corresponding molecular mass is labeled. | |
3.2 FCLs preparation and characterization
Fig. 3 illustrates the approach for FCLs preparation by the reversible assembly characteristics of apoferritin at different pH values. Specifically, the ferritin cages are first dissociated into individual subunits at pH ∼11.4, then, the subunits reassemble into a cage-like structure at pH 6.0. During this process, lutein molecules are encapsulated and retained within the cavity of the ferritin cage, resulting in the ferritin–lutein complex. The reason why lutein can be retained in the ferritin cage is mainly because of the size differences of the ferritin channel and the lutein molecules. It was calculated that the lutein size is about 12.4 Å in length and 5.6 Å in width (a minimum energy state calculated by Chembiodraw Ultra 12.0) which is obvious larger than the pore size of the ferritin protein channels (3–4 Å). Thus, the encapsulated lutein would be restricted in the cavity of the ferritin due to the steric hindrance of the ferritin channel. Subsequently, the cationic CS was probably bound with the out layer of the ferritin by functional groups interaction, such as–NH3+ in CS and –COO− in anionic groups to form ferritin and chitosan stabilized lutein composites (FCLs).
 |
| Fig. 3 Illustration of the preparation process of FCLs. Firstly, the apoSSF nanocage is disassembled into individual subunits at pH 11.4, and then the subunits reassemble into a cage-like structure at pH 6.0. During this process, lutein molecules are encapsulated and retained inside the ferritin cage, CS then electrostatically interacts with the ferritin outer surfaces to form polyelectrolyte complexes of FCLs. | |
Characterization of the FCLs including the dissolution state, TEM, and the determination of size distribution. Firstly, the dissolution state, and thus the naked eye observation of the FCLs were conducted (Fig. 4A). Meanwhile, the apoSSF, ferritin–lutein complex, and the free lutein dissolved in water were also obtained. Results showed that, compared to the obvious precipitation of the lutein in water (Fig. 4A, a), the water solubility of ferritin–lutein complex and FCLs was greatly improved (Fig. 4A, c and d). Typically, the distribution of the ferritin–lutein complex and FCLs was similar, and both of them showed transparency and a typical yellow color. Thus, the water solubility of the lutein in ferritin–lutein complex and FCLs was significantly improved as compared with free lutein. The ferritin and CS encapsulated lutein nanoparticle could be potentially developed as water soluble ingredient in food and pharmaceutical industries.
 |
| Fig. 4 (A) Pictures of different samples including (a) lutein simply mixed with deionized water, (b) apoSSF, (c) ferritin–lutein complex, (d) FCLs. (B–D) TEM of apoSSF, ferritin–lutein complex, and FCLs. The arrow highlighted the uranium cores in the ferritin cavity. Samples were stained using 2% uranyl acetate. (E) Dynamic light scattering intensity of apoSSF, ferritin–lutein complex, and FCLs. (F) Fluorescence spectrum of apoSSF at 330 nm, pH 6.0 following treatment with different amounts of CS (0–10.0 CS/ferritin, molar/ratio), path lengths for excitation and emission were 1.0 and 0.2 cm at wavelengths of 290 and 330 nm, respectively. (G) A polynomial fitting curve of the fluorescence intensity from (F) at 330 nm. | |
TEM can be used to observe the microstructure of the samples, and it was applied to characterize the morphology of the ferritin, ferritin–lutein mixture, ferritin–lutein complex, and FCLs in a nanoscale, and to investigate whether the lutein molecules were successfully encapsulated within apoSSF cage in FCLs and ferritin–lutein complex. It was observed that, the same as the typical size of apoSSF (Fig. 4B), the ferritin–lutein complex was in a homogeneous state with a diameter about 12 nm (Fig. 4C). In addition, the size and the morphology of the FCLs were similar to that of ferritin–lutein complex, a regular spherical structure maintained as shown in Fig. 4D. Notably, there was black uranium cores within most of the apoSSF cages (Fig. 4B, arrow pointed) and ferritin–lutein mixture (Fig. S1A, ESI†). This phenomenon may result from the uranium flowing into ferritin cavity via channels after negatively stained with uranyl acetate. However, most of the ferritin–lutein complex and FCLs exhibited absolutely different patterns compared with the apoSSF and ferritin–lutein mixture; black uranium cores were absence within the ferritin cavity (Fig. 4C and D) in FCLs and ferritin–lutein complex. Meldrum et al. reported that if the small molecules were encapsulated in the protein cage, there would be no or small proportion of uranium-containing cores forming within the cavity, because molecules may occupy the inner cavity and prevent the entrance of uranyl acetate.34 In addition, TEM differences of ferritin–lutein mixture (with black uranium cores) and ferritin–lutein complex (without black uranium cores) could eliminated the possibility that the lutein only bound to the surface of the ferritin cage after disassembly and reassembly. Thus, it can be confirmed that the lutein molecules were successfully encapsulated within the ferritin cage of ferritin–lutein complex and FCLs and to prevent or reduce the entrance of uranyl acetate into the ferritin cage in the current conditions.
Dynamic light scattering (DLS) was performed to detect the hydrodynamic radius (RH) of the scattering particles of the samples. The changes of relative intensity peak area on size distribution can approximately reflect the changes in the relative amounts of different scattering objects.18 Results indicated that only one population (7.6 nm) was evident in the scattered light intensity distribution curve of apo SSF (Fig. 4E), which was consistent with previous research.18 The ferritin–lutein complex also exhibited a similar RH of 8.1 nm (Fig. 4E). By contrast, upon treatment with the CS to ferritin–lutein complex, the size distribution of the resulting FCLs was about 8.9 nm with a small portion of complexes at 21.6 nm (Fig. 4E), which may have resulted from slight aggregation of FCLs. These results were in accordance with the above TEM observations (Fig. 4B–D). We proposed that the aggregations may result from the CS attaching onto the ferritin–lutein complexes; the electrostatic interaction, H-bonds, or van der Waals interactions are supposed to be the main forces. The possible interaction mechanism between CS and ferritin–lutein complex including the binding number and constant of CS will be discussed in Section 3.4.
The molecular size between ferritin and FCLs were further compared by size exclusion chromatography, results indicated they exhibited a similar size distribution at pH 6.0 (Fig. S1B, ESI†), indicating that the CS binding did not significantly change the ferritin size. However, the FCLs showed a wider distribution than that of ferritin, this might result from the slight aggregation of the FCLs, which was consistent with the DLS results (Fig. 4E).
On the other hand, when preparing of the FCLs, ethanol was unavoidable to be added to the solution in the current conditions, the influence of ethanol concentration on protein conformation or assembly of the ferritin cage was evaluated by the TEM and DLS. Results indicated before dialysis the existed ∼17% ethanol (v/v) did not change the morphology of the ferritin which was confirmed by the spherical structure of ferritin in Fig. S2A, ESI.† In addition, after the disassembly and reassembly of the ferritin in the presence of 17% ethanol, the size of ferritin–lutein complex was unchanged with hydrodynamic radius of about 8.2 nm (Fig. S2B, ESI†). However, when adding the ethanol concentration to 30% (v/v), we observed the aggregation and turbidity of the ferritin–lutein complex solution (Fig. S2C, ESI†). DLS was also applied for size distribution analysis of FCLs which was greatly increased to a RH of 70.2 (Fig. S2D, ESI†), in accordance with the amount of aggregations observed in TEM (Fig. S2C, ESI†). Thus, lower ethanol concentration about 17% has insignificant influence on ferritin conformation or assembly. Using ethanol to dissolve the lutein and involved in the prepare system is feasible. Furthermore, after dialysis, the ethanol is removed and the solution is suitable for food usage.
3.3 Calculation of lutein encapsulation efficiency
The lutein encapsulation efficiency per ferritin cage is an important factor in potential food and nutritional application. HPLC was applied to determine the lutein encapsulation and loading capacity, and 446 nm was used as the detection wavelength. It was calculated that an average ratio of 25.2
:
1 (lutein/ferritin, molar ratio) was encapsulated within a ferritin cage after membrane filtration when a ratio of 150
:
1 lutein/ferritin (molar ratio) was added under the current condition. Thus, about 25 lutein molecules can be embedded in a ferritin cage through the reversible assembly of the apoSSF. Additionally, according to the eqn (1) and (2), the encapsulation efficiency and the loading capacity were calculated as 16.8% and 2.50%, respectively.
It was noteworthy that an absence of membrane filtration of ferritin–lutein complex through 0.45 μm would result in a loading capacity of 2.66%, which is a little higher than that after filtration, indicating that the filtration of the FCLs suspension through 0.45 μm membrane did induce the bias on calculation of loading capacity. However, this filtration step is necessary to get a clear solution of ferritin–lutein complex. On the other hand, CS binding process produced 16.0% and 2.39% of the lutein encapsulation efficiency and loading capacity in FCLs, respectively, indicating that the interaction between CS and ferritin–lutein complex did not significantly influence the lutein encapsulation in the ferritin cage.
3.4 The binding of chitosan to ferritin
The presence of a single Trp residue has been extensively reported in each E-helix of ferritin subunits,18,24,35 and it has been widely used as fluorescence probe for biological applications. If one molecule could interact or bind with the ferritin on the E-helix, one would expect fluorescence quenching of the ferritin as a result of specific binding between the ferritin and the molecule (quencher). Taking advantage of this unique character, the interaction of ferritin–lutein complex with CS was studied by fluorescence titration. Interestingly, different concentrations of CS (CS/ferritin ≤ 10, molar ratio) remarkably quenched the fluorescence of ferritin–lutein complex with a maximum occurring at ∼330 nm at pH 6.0 (Fig. 4F). This result remind us of our reports that cationic polylysine could interact with the recombinant soybean seed ferritin, resulting in the quenching of the Trp-fluorescence on the 4-fould channel.18,24 In addition, with an increase of CS concentration, the fluorescence intensity of ferritin–lutein complex decreased gradually. Thus, it can be conclude that the cationic CS could interact with the ferritin–lutein complex and change the hydrophobic microenvironment around the Trp residue.35
The stoichiometry and binding constant is the basic experimental parameter in a variety of studies, which is of great relevance in many biochemical and pharmacological drug responses. They are usually be used to describe the interaction between different molecules, and are specifically used to predict the binding stoichiometry, and also, it might help to localize the binding sites.36 To obtain the binding number and binding constant, the data were fitted to eqn (3) for the binding of chitosan to n independent binding sites on the protein (Fig. 4G). Average and standard deviation for three titrations were n = 10.2 ± 0.32 and K = (6.3 ± 0.03) × 105 M−1. A stoichiometry of n ∼ 10 indicated that about 10 CS molecules were bound to a single ferritin. This binding constant is comparable with that of cationic pentapeptides binding to negatively charged lipid membranes (K, 2.8 × 10⁵ M−1)37 and the binding behavior between polylysines and reconstructed SSF with K of 1.32 × 10⁵ M−1,18 suggesting that the electrostatic interaction plays an important role in the CS and ferritin binding. It can be deduced that the CS is positively charged at low pH values (pH 6.0, below its pKa value), followed by interacting with the negatively charged ferritin cages to form polyelectrolytes in solution.38 However, the H-bonds and van der Waals interaction may also be involved in the ferritin–CS in interaction, especially when the CS is excess in the system which may lead to the aggregation of the FCLs. The following experiment involved FCLs was obtained by the CS and ferritin–lutein complex interaction in a 20
:
1 molar ratio followed by dialysis, resulting in a 10
:
1 molar ratio (CS/ferritin–lutein complex).
3.5 Turbidity and zeta-potential of FCLs
The turbidity of FCLs at different pH values was measured to investigate the interaction of CS and ferritin. As shown in Fig. 5A, the turbidity of ferritin–lutein complex and CS was relatively dependent on the pH of solution. It was observed that the ferritin–lutein complex (0.5 μM) was transparent similar to ferritin, with a nearly zero turbidity below pH 5.0. However, the turbidity of the ferritin–lutein complex increased as the forming of ferritin aggregation at pH 5.0–6.0 which is close to isoelectric point of ferritin.14 Similarly, the turbidity of CS was fairly constant below pH 6.0, but increased above pH 6.0 due to the deprotonation of amine groups occurring at its pKa value, at pH between 6 and 6.5 (Fig. 5A).20 As with FCLs, the turbidity of them is slowly increased (pH < 6.0) but they are still soluble and transparent. However, their turbidity experienced a dramatic increase with increasing pH (>6.0), and a maximum turbidity of FCLs was observed at pH 7.0 (insoluble FCLs aggregates were formed), exhibiting different characteristics compared with those of the CS and ferritin–lutein complex. These results indicate that the pH plays an important role in the binding of CS to ferritin, and associated with such binding is an obvious change of the solution turbidity. The reason why to adjust the pH of CS and nanocomplex to acid condition (pH 6.0) is just to insure the binding of chitosan to ferritin–lutein nanocomplex (with negative charges at pH 6.0), because chitosan at pH 6.0 can be protonated with positive charges. Potentially the soluble and transparent FCLs obtained at pH 6.0 could have an advantage over insoluble agglutination, which would be applied to food industry, such as food beverages.
 |
| Fig. 5 (A) Effects of pH on the turbidity of CS, ferritin–lutein complex, and FCLs (10 CS/ferritin, molar ratio). (B) Effects of pH on the zeta-potential of CS, ferritin–lutein complex, and FCLs (10 CS/ferritin, molar ratio). (C) Kinetics of lutein release from FCLs at different storage temperatures. Each point represented as the mean of triplicate readings. | |
Further evidence came from the zeta-potential evidences at different pH to study the suitable condition for ferritin–lutein complex and CS interaction. Results indicated a synergistic effect on the FCLs formation (Fig. 5B). Specifically, the zeta-potential for FCLs was higher than single ferritin–lutein complex and CS between pH 4.0 and pH 5.0. However, in this condition, the CS and ferritin–lutein complex would not be electrostatic attracted as the both positive charges of them. Then, the zeta-potential of FCLs had sustained fallen above pH 5.0 and showed a middle value between CS and ferritin–lutein complex, which is also not suitable for the CS and ferritin–lutein complex interaction because of the isoelectric point of the ferritin near here. This is evidenced by the zero mV of zeta-potential and the obviously increased turbidity of the ferritin–lutein complex at about pH 5.5 (Fig. 5A). Subsequently, there was a dramatic decrease zeta-potential of FCLs tending to near zero mV as the pH increased in the range from 6.0 to 7.0. In this condition, whether the CS detached from the ferritin cage was not clear, but the interaction between CS and ferritin may be changed, and the turbidity of the solution increased accordingly (Fig. 5A), some FCLs aggregates even were formed (data not shown), which is bad for clear beverages in food. Therefore, we selected pH 6.0 as the optimum reaction condition to prepare the FCLs. In this condition, CS with positive charge would electrostatic interact with the negative charged ferritin–lutein complex to form FCLs. Importantly, a soluble form of FCLs was obtained in this condition which is convenient for usage. Thus, we think that the charged ingredients commonly present in complex food systems (e.g. emulsifiers, proteins, and minerals—especially iron) might significantly affect the stability. The factor of changing pH should be considered in potential food usage.
3.6 Lutein release from FCLs in vitro
The influence of dialysis process (4 °C, 32 h) on the lutein release from ferritin–lutein complex was performed, and results indicated only a trace amount (5.0 ± 0.4%) of lutein was released in 32 h during dialysis (Fig. S3, ESI†). To investigate the closure effect of the double wall materials (ferritin and CS) on the preservation of the lutein during storage, the permeability or leakage kinetics of encapsulated lutein out of the FCLs was evaluated under simulated conditions in vitro (50 mM Tris–HCl, pH 6.0 at 4, 20, and 37 °C) for 7 days. Results showed that the FCLs at 4 °C exhibited a trace amount of lutein release (Fig. 5C), indicating that it is a promising strategy of encapsulating and retaining the lutein molecules at a low temperature. However, a rapid burst release of greater than 69 ± 6.2% was observed within 7 d when FCLs were stored at 37 °C. As with the lutein release at 20 °C, 27.9 ± 3.8% of the lutein was released within 7 days, which was an intermediate value between 37 °C and 4 °C. These results showed that the nanoparticle FCLs were efficient in retaining the lutein molecules in the ferritin cage at lower temperatures, and exhibited temperature-dependent characteristics. We propose that a storage temperature below 20 °C is an appropriate condition for FCLs preservation with as high as 72.1% of lutein retention. Higher temperatures may result in the degradation of the lutein and the loss of bioactivity.
Ferritin forms a spherical structure with an approximately 8 nm interior cavity, and one ferritin molecule has eight 3-fold and six 4-fold channels with pore sizes between 0.3 and 0.5 nm,39,40 which connect the inner cavity to the solution. Large molecules, however, cannot enter into the cavity because of steric hindrance.40,41 Fortunately, apo-ferritin exhibits a subtle reversible disassembly-reassembly property.19 In this process, ferritin can potentially capture molecules by using its reversible assembly properties, resulting in the encapsulation of the molecules inside the cavity. In this current study, FCLs retained the majority of lutein in the ferritin nano-cage and the chitosan decorated nanoparticle, and was significantly larger than that of ferritin–lutein complex. Chitosan here may function as a second shell material attached to the ferritin cage, exhibiting an improved effect on lutein preservation. Temperature is also an important factor influencing lutein release, as the pore structure of ferritin channels has been shown to be sensitive to the changes in temperature,24,42 and thus, the heat dependent channel opening property of ferritin may result in the enhancement of lutein release.
We speculated that the ferritin channels may be the media where the lutein molecules can exit from the cavity of the ferritin. In this study, the majority of lutein was successfully embedded in the cage at lower temperature (4 °C), suggesting that in this condition conformational change associated with leakage is limited. Differently, at 20 and 37 °C, the lutein release increases as temperature increased. Previous reports revealed that ferritin channels have been shown to be sensitive to the temperature changes.24,42,43 They found that the iron can be in a higher release ratio when applying to higher temperatures. Thus, higher temperature may be a factor influencing or enlarging the ferritin pore structures, resulting in the increased lutein release.
3.7 Stability of lutein in ferritin cage after UV radiation and thermal processing
The application of lutein in the food industry is limited due to its eight unstable conjugated double bonds structure, which may result in the degradation of lutein.7,44 The effects of UV radiation, ambient light, and heat treatment (20 and 37 °C) on lutein stability were investigated to evaluate the protective function of the ferritin cage and chitosan (Fig. 6). Results obtained from UV irradiation treatment of FCLs (wavelength of 254 nm) showed that the degradation ratio of lutein in FCLs was markedly reduced as compared with free lutein and that in the ferritin–lutein complex in the same time range (0–24 h) (Fig. 6A). As with the ambient light treatment of lutein, FCLs also exhibited an obvious increased stability compared to the control (Fig. 6B). These data were fitted to the first-order reaction model as shown in eqn (6) and (7) to obtain the degradation rate constant (k) and the half-time of degradation (t1/2) in Table 1. Generally, the higher k (h−1) for a sample, the higher degradation rate is for relevant treatment; whereas the higher half-life (t1/2) for a sample, the lower the degradation rate is for its treatment. It was calculated that all the regression coefficients (R2) for FCLs, FL (ferritin–lutein complex) and free lutein, were above 0.9, indicating a good correlation between lutein degradation and treatment time. The k and t1/2 for the FCLs after UV treatment was 0.34 h−1 and 34.70, indicating the lowest k and the highest t1/2 than that for ferritin–lutein complex and free lutein, respectively (Table 1). Similar results were obtained upon treatment with ambient light (Table 1), whereas the FL and FCLs exhibited insignificant differences of the k and t1/2 (P > 0.05), both of which were higher than that for lutein. Thus, the photo-stability of lutein in FCLs was significantly improved against UV radiation and ambient light treatment as compared with that of free lutein as a result of the ferritin embedding and CS binding.
 |
| Fig. 6 Decay curves of free lutein, lutein in ferritin–lutein complex (FL), and lutein in FCLs in different conditions. (A) Lutein degradation due to UV radiation, (B) lutein degradation due to ambient light treatment, (C) lutein degradation due to heat treatment at 20 °C. (D) Lutein degradation due to heat treatment at 37 °C. Values are means ± SD (n = 3). | |
The stability of lutein in FCLs after thermal processing was assessed at 20 and 37 °C, respectively. It was revealed that lutein degradation in the FCLs was significantly lower than that in ferritin–lutein complex after incubation at 20 °C for 24 h (P < 0.05) (Fig. 6C and Table 1), which was indicated by the lower k value (0.24 h−1) and higher t1/2 value (48.51 h) of FCLs. Similarly, FCLs obvious weaken the degradation of lutein as compared with ferritin–lutein complex and free lutein at 37 °C in the same time range (Fig. 6D and Table 1). Thus, the FCLs exhibited an improved thermal stability of lutein, however, higher temperature may result in increased degradation of lutein. Previous reports have revealed that the hollow spherical architecture of the apoferritin shell can be kept intact upon heating at 80 °C for 10 min, indicative of a high thermal stability,45 the apoSSF may function as an external crust to protect the lutein contained within the protein cage. Additionally, the second shell material of CS attached to the ferritin cage contributed an improved protective effect on lutein. A low temperature below 20 °C is recommended to attain quality of lutein in FCLs in potential use in food industry.
3.8 Lutein release from FCLs in gastrointestinal tract
Lutein release behavior in FCLs in the GI was investigated, free lutein and ferritin–lutein complex were used as two control samples. As shown in Fig. 7A, free lutein displayed a burst release within 20 min in simulated gastric fluid and the release ratio reached to 67.8% after 2 h of incubation. However, lutein release from ferritin–lutein complex and FCLs showed a different pattern. Specifically, the release ratio of lutein in ferritin–lutein complex was lower after encapsulation by ferritin with release rate of 54.2% after 2 h, and the lutein in FCLs underwent a lowest release rate of 43.6%. Thus, the ferritin coating and the CS decorating all significantly inhibited the lutein release in simulated gastric fluid. On the other hand, independent of the ferritin embedding, free lutein also exhibited a rapid release process with 55.1% of release ratio under simulated intestine conditions (Fig. 7B) within 20 min, followed by continuous liberation up to 76.3% after 2 h. In contrast, lutein encapsulated in ferritin–lutein complex and FCLs exhibited a relative slower and sustained release process, and the release ratios reach to around 61.5% and 48.8% after 2 h, respectively. Therefore, the ferritin coating and CS decorating exhibited more pronounced effect to prolong the release of the lutein. We can infer that this sustained release of lutein from FCLs may lead to the minimization of its degradation in the gut conditions with greater bioavailability in human digestive system.
 |
| Fig. 7 In vitro release of free lutein, lutein from ferritin–lutein complex, and lutein from FCLs in (A) simulated stomach conditions and (B) simulated small intestine conditions over 2 h of incubation. Values are means ± SD (n = 3). | |
There are several reasons that may restrict the lutein release. As we know, ferritin is a kind of globular protein which is more unstable and could be degradation by trypsin at around pH 7.5,33 only using ferritin as wall material may not be a good choice. Previous studies have revealed some chitosan binding to protein can diminish the digestion of proteins with the enzymes of the gastrointestinal tract.46,47 Lee et al. and coworkers recently reported the chitosan-β-lactoglobulin double-wall coating can significantly restrict the release of brilliant blue (BB) in GI, and CS has the potential to prolong residence time in the delivery of core materials.48 In this work, FCLs exhibited more pronounced effect to prolong the release of the lutein in gastrointestinal tract, and chitosan decorating is a requisite step to achieve this effect. Another probable reason was that the chitosan coating on the ferritin may influence the ferritin folding, change the ferritin structure and digestibility.49
3.9 Lutein release from FCLs influenced by food components
To evaluate the potential bioaccessibility of lutein after the stomach and the small intestine digestion, lutein release values influenced by food components were detected and the data was shown in Table 2. It was observed that consumption of FCLs with food components, such as vitamin, polyphenol, protein, and carbohydrate, exhibited different effects. Specifically, significant decreases were evident for lutein release (P < 0.05) as for polyphenols intervention. The release ratio of lutein decreased about 29.8% and 24.4% in terms of stomach and intestine digestion when EGCG added, respectively. Grape seed proanthocyanidin addition even exerted 2-fold decreases in stomach digestion. Previous studies have revealed some polyphenols binding to protein can diminish the digestion of proteins with the enzymes of the gastrointestinal tract,50,51 Wang et al. also reported the EGCG induced the association of ferritin can significantly inhibit ferritin degradation by proteases.52 Thus, it can be speculated that the polyphenol molecules may bind to the ferritin surface and cover the binding sites of enzyme on ferritin, and thus leading to a low degree of hydrolysis, resulting in the sustained release of lutein.
The effects of vitamin including ascorbic acid and tocopherol were evaluated, and results indicated that both of the vitamins in lower doses had insignificant effect on the lutein release in the stomach and intestine digestion. However, when FCLs was ingested with a larger dose of ascorbic acid (0.10 mg mL−1), a promoting effect on lutein release was observed in small intestine digestion.
The effect of carbohydrates including glucose, pectin, and cellulose on the lutein release was evaluated, and different results were obtained. Both glucose and cellulose had insignificant result on the lutein release in current usage dose in the stomach digestion and intestine digestion. However, pectin facilitated the release of lutein in FCLs in a dose of 0.4% and 0.8%, w/v. This increased release of lutein was bad for the retention in the gastrointestinal tract.
Milk and soy protein were applied for the effects of foods rich in protein on the lutein release. Significant decreases were evident for lutein release (P < 0.05) in stomach and intestine digestion when it was consumed with milk, and the minimum lutein release reached to 28.59% and 34.86%, respectively, for stomach and intestine digestion in a milk dose of 0.40 mL mL−1. Similarly, the soy protein also significantly decreased the lutein release from FCLs in a dose of 0.10 to 0.20 mg mL−1 (P < 0.05). This result could be explained as that protein-rich food could inhibit the lutein release form FCLs and prolonged the retention time in the in gastrointestinal tract. It was reported that the whole milk component and soybean may interact with the polyphenol and reduce its bioavailability by the formation of complexes between proteins and phenolics during digestion.53,54 The obtained decrease of lutein release value here may be due to the forming of released lutein–protein complexes; on the other hand, the fat, ions, and oligopeptides originated form milk might interact with the chitosan and ferritin cage, influencing the shell degradation, leading to the decrease release of lutein.
4 Conclusions
In summary, this study provides a novel strategy for the design and fabrication of a functional protein-polysaccharide based nano-carrier for lutein protection and stabilization. The ferritin cage functions as a spherical structure with a physical barrier to heat and light, and protection from pro-oxidants in the aqueous phase. Ferritin and bioactive compounds may form complexes through hydrophobic interactions or van der Waals interactions which may provide a protective effect inside ferritin from degradation.55 We also demonstrate that chitosan functions as a second shell material attached to the ferritin cage, revealing an improved protective effect of lutein against thermal and UV treatment. In addition, the obtained shell–core composites exhibited a prolonged release of lutein in the gastrointestinal tract in vitro. It should be noteworthy that the food components, such as polyphenols, proteins, carbohydrates, and vitamins, presented different release behaviors of lutein in the simulated digestion systems. These findings proved that the digestibility and bioavailability can be modified by dietary nutrients that are present in the food matrix. The unique characteristic provided by the ferritin nanocage and chitosan outer layer suggests a promising strategy to encapsulate and deliver food nutritional factors.
Acknowledgements
This work was financially supported by the Nature Science Foundation of China (No. 31501489), and Tianjin Research Program of Application Foundation and Advanced Technology (15JCZDJC34300).
References
- M. S. Pasaporte, F. J. Rabaya, M. M. Toleco and D. M. Flores, Food Chem., 2014, 158, 35–40 CrossRef CAS PubMed.
- J. H. Lin, D. J. Lee and J. S. Chang, Bioresour. Technol., 2015, 184, 421–428 CrossRef CAS PubMed.
- P. Astorg, Trends Food Sci. Technol., 1997, 8, 406–413 CrossRef CAS.
- X. Gong and L. P. Rubin, Arch. Biochem. Biophys., 2015, 572, 40–48 CrossRef CAS PubMed.
- B. Demmig-Adams and W. W. Adams, Science, 2002, 298, 2149–2153 CrossRef CAS PubMed.
- J. H. Dwyer, M. Navab, K. M. Dwyer, K. Hassan, P. Sun, A. Shircore, S. Hama-Levy, G. Hough, X. Wang, T. Drake, C. N. Merz and A. M. Fogelman, Circulation, 2001, 103, 2922–2927 CrossRef CAS PubMed.
- X. Y. Qv, Z. P. Zeng and J. G. Jiang, Food Hydrocolloids, 2011, 25, 1596–1603 CrossRef CAS.
- E. Luengo, J. M. Martínez, A. Bordetas, I. Álvarez and J. Raso, Innovative Food Sci. Emerging Technol., 2015, 29, 15–22 CrossRef CAS.
- C. P. Coronel-Aguilera and M. F. San Martín-González, Food Sci. Technol., 2014, 62, 187–193 Search PubMed.
- C. Zhao, H. Cheng, P. Jiang, Y. Yao and J. Han, Food Chem., 2014, 156, 123–128 CrossRef CAS PubMed.
- F. Xia, D. Hu, H. Jin, Y. Zhao and J. Liang, Food Hydrocolloids, 2012, 26, 456–463 CrossRef CAS.
- H. Jin, F. Xia, C. Jiang, Y. Zhao and H. E. Lin, Chin. J. Chem. Eng., 2009, 17, 672–677 CrossRef CAS.
- I. Lacatusu, E. Mitrea, N. Badea, R. Stan, O. Oprea and A. Meghea, J. Funct. Foods, 2013, 5, 1260–1269 CrossRef CAS.
- G. Zhao, Biochim. Biophys. Acta, 2010, 1800, 815–823 CrossRef CAS PubMed.
- T. Masuda, F. Goto, T. Yoshihara and B. Mikami, Biochem. Biophys. Res. Commun., 2010, 400, 94–99 CrossRef CAS PubMed.
- T. Masuda, B. Mikami, F. Goto, T. Yoshihara and S. Utsumi, Biochim. Biophys. Acta, 2003, 1645, 113–115 CrossRef CAS.
- T. Masuda, F. Goto and T. Yoshihara, J. Biol. Chem., 2001, 276, 19575–19579 CrossRef CAS PubMed.
- R. Yang, L. Chen, T. Zhang, S. Yang, X. Leng and G. Zhao, Chem. Commun., 2014, 50, 481–483 RSC.
- L. Chen, G. Bai, S. Yang, R. Yang, G. Zhao, C. Xu and W. Leung, Food Res. Int., 2014, 62, 1147–1153 CrossRef CAS.
- P. S. Lee, S. G. Yim, Y. Choi, T. Van Anh Ha and S. Ko, Food Chem., 2012, 134, 992–998 CrossRef CAS PubMed.
- T. Zou, Z. Li, S. S. Percival, S. Bonard and L. Gu, Food Hydrocolloids, 2012, 27, 293–300 CrossRef CAS.
- C. K. S. Pillai, W. Paul and C. P. Sharma, Prog. Polym. Sci., 2009, 34, 641–678 CrossRef CAS.
- M. Rinaudo, Prog. Polym. Sci., 2009, 31, 601–632 Search PubMed.
- R. Yang, L. Chen, S. Yang, C. Lv, X. Leng and G. Zhao, Chem. Commun., 2014, 50, 2879–2882 RSC.
- E. R. Bauminger, P. M. Harrison, D. Hechel, I. Nowik and A. Treffry, Biochim. Biophys. Acta, Protein Struct. Mol. Enzymol., 1991, 1118, 48–58 CrossRef CAS.
- U. K. Laemmli, Nature, 1970, 227, 680–685 CrossRef CAS PubMed.
- O. H. Lowry, N. J. Rosebrough, A. L. Farr and R. J. Randall, J. Biol. Chem., 1951, 193, 265–275 CAS.
- M. Kim, Y. Rho, K. S. Jin, B. Ahn, S. Jung, H. Kim and M. Ree, Biomacromolecules, 2011, 12, 1629–1640 CrossRef CAS PubMed.
- F. Bou-Abdallah, G. Zhao, G. Biasiotto, M. Poli, P. Arosio and N. D. Chasteen, J. Am. Chem. Soc., 2008, 130, 17801–17811 CrossRef CAS PubMed.
- Q. Zeng, H. Wen, Q. Wen, X. Chen, Y. Wang, W. Xuan, J. Liang and S. Wan, Biomaterials, 2013, 34, 4632–4642 CrossRef CAS PubMed.
- L. Zhao, H. Xiong, H. Peng, Q. Wang, D. Han, C. Bai, Y. Liu, S. Shi and B. Deng, Eur. Food Res. Technol., 2011, 232, 647–654 CrossRef CAS.
- N. Işık, B. Alteheld, S. Kühn, N. Schulze-Kaysers, B. Kunz and H. R. Wollseifen, Food Res. Int., 2014, 65, 109–114 CrossRef.
- J. Deng, M. Li, T. Zhang, B. Chen, X. Leng and G. Zhao, Food Res. Int., 2011, 44, 33–38 CrossRef CAS.
- F. C. Meldrum, V. J. Wade, D. L. Nimmo, B. R. Heywood and S. Mann, Nature, 1991, 349, 684–687 CrossRef CAS.
- C. Lv, Y. Bai, S. Yang, G. Zhao and B. Chen, Food Chem., 2013, 141, 3851–3858 CrossRef CAS PubMed.
- S. Lin, A. S. Y. Lee, C. C. Lin and C. K. Lee, Curr. Proteomics, 2006, 3, 271–282 CrossRef CAS.
- M. Hoernke, C. Schwieger, A. Kerth and A. Blume, Biochim. Biophys. Acta, 2012, 1818, 1663–1672 CrossRef CAS PubMed.
- J. H. Hamman, Mar. Drugs, 2010, 8, 1305–1322 CrossRef CAS PubMed.
- M. Li, C. Viravaidya and S. Mann, Small, 2007, 3, 1477–1481 CrossRef CAS PubMed.
- P. M. Harrison and P. Arosio, Biochim. Biophys. Acta, Gen. Subj., 1996, 1275, 161–203 CrossRef.
- N. D. Chasteen and P. M. Harrison, J. Struct. Biol., 1999, 126, 182–194 CrossRef CAS PubMed.
- X. Liu, W. Jin and E. C. Theil, Proc. Natl. Acad. Sci. U. S. A., 2003, 100, 3653–3658 CrossRef CAS PubMed.
- E. C. Theil, X. S. Liu and T. Tosha, Inorg. Chim. Acta, 2008, 361, 868–874 CrossRef CAS PubMed.
- C. Dhuique-Mayer, M. Tbatou, M. Carail, C. Caris-Veyrat, M. Dornier and M. J. Amiot, J. Agric. Food Chem., 2007, 55, 4209–4216 CrossRef CAS PubMed.
- S. Stefanini, S. Cavallo, C. Q. Wang, P. Tataseo, P. Vecchini, A. Giartosio and E. Chiancone, Arch. Biochem. Biophys., 1996, 325, 58–64 CrossRef CAS PubMed.
- Z. Teng, Y. Luo and Q. Wang, Food Chem., 2013, 141, 524–532 CrossRef CAS PubMed.
- S. A. Agnihotri, N. N. Mallikarjuna and T. M. Aminabhavi, J. Controlled Release, 2004, 100, 5–28 CrossRef CAS PubMed.
- P. S. Lee, S. G. Yim, Y. Choi, T. Van Anh Ha and S. Ko, Food Chem., 2102, 134, 992–998 CrossRef PubMed.
- L. Bekale, D. Agudelo and H. A. Tajmir-Riahi, Colloids Surf., B, 2015, 125, 309–317 CrossRef CAS PubMed.
- K. J. Petzke, S. Schuppe, S. Rohn, H. M. Rawel and J. Kroll, Food Chem., 2005, 53, 3714–3720 CrossRef CAS PubMed.
- V. Aguié-Béghin, P. Sausse, E. Meudec, V. Cheynier and R. Douillard, J. Agric. Food Chem., 2008, 56, 9600–9611 CrossRef PubMed.
- A. Wang, Z. Kai, Q. Xin and G. Zhao, Plant Foods Hum. Nutr., 2014, 69, 386–391 CrossRef CAS PubMed.
- W. Mullen, C. A. Edwards, M. Serafini and A. Crozier, J. Agric. Food Chem., 2008, 56, 713–719 CrossRef CAS PubMed.
- H. Zhang, J. Zheng, X. Liu, Q. Ding, L. Jiang, H. Guo and F. Ren, Mol. Nutr. Food Res., 2012, 56, 1511–1519 CAS.
- C. Qian, E. A. Decker, H. Xiao and D. J. McClements, Food Chem., 2012, 132, 1221–1229 CrossRef CAS.
Footnote |
† Electronic supplementary information (ESI) available. See DOI: 10.1039/c6ra04058f |
|
This journal is © The Royal Society of Chemistry 2016 |
Click here to see how this site uses Cookies. View our privacy policy here.