 Open Access Article
Creative Commons Attribution 3.0 Unported Licence
Sol gel and ceramic synthesis of Sr2FeMo1−xWxO6 (0 ≤ x ≤ 1) double perovskites series
M.
Iranmanesh
,
M.
Lingg
,
M.
Stir
and
J.
Hulliger
*
Department of Chemistry & Biochemistry, University of Berne, Freiestrasse 3, CH-3012 Bern, Switzerland. E-mail: juerg.hulliger@dcb.unibe.ch
First published on 20th April 2016
Abstract
Preparation methods (ceramic and sol–gel methods) using reducing conditions were optimized for the formation of phase pure double perovskites of Sr2FeMo(1−x)WxO6 (0 ≤ x ≤ 1) showing enhanced homogeneity and cation ordering for investigating magnetic properties. X-ray diffraction (XRD) revealed a structural transition from tetragonal to monoclinic as W replaces Mo (x = 0.5–0.6). The SQUID magnetometry confirmed a ferrimagnetic ground state for Sr2FeMoO6 whereas Sr2FeWO6 shows an antiferromagnetic state. Current results demonstrate that improved preparation methods can enhance the saturation magnetization.
1. Introduction
Members of the A2B′B′′O6 type compositions adopt the double-perovskite (DP) structure, in which the A sites are twelve-fold coordinated with oxygen, while the B′B′′ sites show octahedral coordination. Typically, A is an alkaline (Sr, Ba, Ca) or a rare-earth element, while the octahedral sites B′B′′ are occupied by transition metals with B′ and B′′ species alternating along the c-axis. In particular, the solid–state reaction series Sr2FeMo1−xWxO6 (SFMWO) with B′ = Fe and B′′ = Mo, W received considerable attention.1–9The Sr2FeMoO6 (SFMO) shows a different behavior versus Sr2FeWO6 (SFWO) with respect to magnetic, electron transport and structural properties. The SFMO is a half-metallic ferromagnetic (FM) or ferrimagnetic (fM) material featuring a high Curie temperature above 400 K![[thin space (1/6-em)]](https://www.rsc.org/images/entities/char_2009.gif) 9–12 for high degree ordering of Fe3+ and Mo5+. Spintronics and high tunneling magneto resistance (TMR) at room temperature are the main applications of these materials.13
9–12 for high degree ordering of Fe3+ and Mo5+. Spintronics and high tunneling magneto resistance (TMR) at room temperature are the main applications of these materials.13
On the contrary, SFWO is an antiferromagnetic (AFM) and insulator material showing a Neel temperature around 37 K.1,14,15 Therefore, a metal-insulator transition (MIT) as well as a fM to AFM change order must occur if W-doping approaches a certain critical composition (xc).
Because both the MIT and the magnetic transition are related to subtle structural changes, a transition may also be expected in this series at increasing W concentrations. Indeed, MIT in SFMWO has been reported by different groups1,4 for composition in the range of 0.7 ≤ xc ≤ 0.8 as the number of itinerant electrons considerably changes from SFMO (one electron per formula unit) to SFWO (no itinerant electrons).
Kobayashi et al.1 found out the existence of a valence transition from Fe3+ (3d5, S = 5/2) ions that are antiferromagnetically coupled with six Mo5+ (4d1, S = 1/2) in SFMO to W6+ (5d0) and Fe2+ (3d6, S = 2) species in SFWO and explain the MIT and the magnetic transition at high concentrations (0.7 ≤ x ≤ 0.8). Indeed, gradual substitution of Mo5+ by W6+, leads to the formation of an inhomogeneous state of FM clusters that are embedded within the AFM isolating matrix as percolation model.1,7
There is less agreement in the literature on the structural properties of SFMWO. For example, Kobayashi et al.1 reported that SFMWO has a tetragonal (I4/m) structure across the entire composition range (0 ≤ x ≤ 1). At very high W contents, e.g. x ≥ 0.9, a nearly cubic structure is inferred from the lattice parameter values. The lattice parameters a and c increase with x and show almost perfect ordering of Fe, Mo and W are present for x > 0.4.
For x = 1 (SFWO), Azad et al.12 reported a monoclinic structure (space group P21/n, a = 5.6480 Å, b = 5.6088 Å, c = 7.9362 Å and β = 89.99°). Following this report, Sanchez et al.7 re-examined the structure of SFMWO perovskites at different compositions. It was found that for x = 0, 0.2 and 0.5 the room-temperature structure is tetragonal (I4/m), while for x = 0.8 and x = 1 the structure is monoclinic (P21/n) in agreement with ref. 15. Therefore, the observed structural evolution for the solid–state reaction series supports the concept of a progressive valence transition manifested as a continuous localization of electrons from SFMO (x = 0) to SFWO (x = 1),1,3,6i.e. no critical concentrations exist for the valence transition. With increasing W doping, there is also a gradual distortion of the oxygen octahedral around Fe, Mo and W, but the corresponding bond strain is suddenly relaxed to the Sr–O bonds. This triggers a tetragonal to monoclinic phase transition at compositions near xc ∼0.6.7
In general, the structure and magnetic properties of the compound are very sensitive to preparation methods, e.g., heat treatment conditions, time and atmosphere.13 Kinetic processes primarily control the degree of ordering.9 There have been several studies16–18 to obtain pure phases to improve cation ordering. It has also been reported10 that synthesis of pure phase compounds without formation of impurities such as SrMoO4 is unlikely.
In this work we investigate a series of SFMWO prepared by sol–gel (SG) and ceramic reactions (CR). Compositions were chosen to cover the entire series in steps of 0.1. Additional information is provided for intermediate compositions of 0.5 ≤ x ≤ 0.8 that were not covered by other studies.5,7 Property analysis using different routes of preparation inspired us to perform new syntheses including a single calcination step at 1100 °C by ceramic reaction and at 1000 °C by the sol–gel methods.
2. Experimental
The entire series of Sr2FeMo(1−x)WxO6 (0 ≤ x ≤ 1) was prepared by ceramic reactions. Stoichiometric amounts of SrCO3, FeO, MoO3 and WO3 (Sr![[thin space (1/6-em)]](https://www.rsc.org/images/entities/char_2009.gif) :
:![[thin space (1/6-em)]](https://www.rsc.org/images/entities/char_2009.gif) Fe
Fe![[thin space (1/6-em)]](https://www.rsc.org/images/entities/char_2009.gif) :
:![[thin space (1/6-em)]](https://www.rsc.org/images/entities/char_2009.gif) Mo
Mo![[thin space (1/6-em)]](https://www.rsc.org/images/entities/char_2009.gif) :
:![[thin space (1/6-em)]](https://www.rsc.org/images/entities/char_2009.gif) W = 2
W = 2![[thin space (1/6-em)]](https://www.rsc.org/images/entities/char_2009.gif) :
:![[thin space (1/6-em)]](https://www.rsc.org/images/entities/char_2009.gif) 1
1![[thin space (1/6-em)]](https://www.rsc.org/images/entities/char_2009.gif) :
:![[thin space (1/6-em)]](https://www.rsc.org/images/entities/char_2009.gif) (1 − x)
(1 − x)![[thin space (1/6-em)]](https://www.rsc.org/images/entities/char_2009.gif) :
:![[thin space (1/6-em)]](https://www.rsc.org/images/entities/char_2009.gif) x) were processed in ball-mill for three hours at 400 rpm using isooctane to provide a slurry during grinding. The dried powder was pressed into pellets (∅ = 13 mm, 3 mm; 8 tons) and sintered at 1100 °C for 6 hours in quartz glass tubes under reducing atmosphere of H2/N2 (8/92%) and flow of 30–50 ml min−1. Heating and cooling rates were 6 and 3 °C min−1, respectively.
x) were processed in ball-mill for three hours at 400 rpm using isooctane to provide a slurry during grinding. The dried powder was pressed into pellets (∅ = 13 mm, 3 mm; 8 tons) and sintered at 1100 °C for 6 hours in quartz glass tubes under reducing atmosphere of H2/N2 (8/92%) and flow of 30–50 ml min−1. Heating and cooling rates were 6 and 3 °C min−1, respectively.
The sol–gel procedure was performed as described in ref. 13 under a variety of conditions by mixing stoichiometric amounts of analytical grade (NH4)6Mo7O24·4H2O, SrCO3, Fe(NO3)3·9H2O and H2WO4.
The metal salts and ethylenediaminetetraacetate (EDTA) were dissolved separately in a diluted nitric and citric acid mixture while heating slowly to 70 °C in an ultrasonic bath. All the dissolved metal salts were mixed in a flask containing ethylene glycol. The mixtures were heated to remove the citrate and nitrate solutions and to begin the aging. The amount of the additives as well as the order of mixing of the chemicals were varied to achieve best homogeneity. Citric acid and ethylene glycol were used at the same quantity as metal salts. The amount of nitric acid and EDTA were 2- and 1.5- fold the amount of metal salts, respectively. The pH of the solution was held near 3 by adding ammonia.19
The mixtures were heated for several hours at 80 °C to form a highly viscous yellowish or brownish residual gel and finally dried at 110 °C. The gel turned into brown dry foam that was crushed and pressed into pellets. Calcination took place in air to decompose the precursor at 600 °C for 6 h with intermediate grinding and pelletizing followed by subsequent treatment at 900 °C for 5 h. The pellets were then annealed in the same way as ceramic reaction in different temperature (1100–900) and time (2–6) range. However, lower temperature and shorter duration of sintering (1000 °C, 4 h) was sufficient to form intended compounds.
The grain size and density were analyzed by scanning electron microscopy (SEM). Energy dispersive X-ray analysis (EDX) was used to quantitate elemental distribution.
For Sr2FeMo1−xWxO6 the diffraction patterns were collected at ambient temperature using a STOE StadiP diffractometer and monochromatic CuKα1 radiation (1.5406 Å). The data were acquired with a step-scan interval of 0.01 and a step time of 30 s.
The DC magnetic characterizations were performed on a SQUID magnetometer (Quantum Design) in the range 2–300 K. The magnetizations were measured with zero field cooling (ZFC) and field cooled (FC) at 100 Oe.
3. Results and discussion
3.1 X-ray diffraction and structure analysis
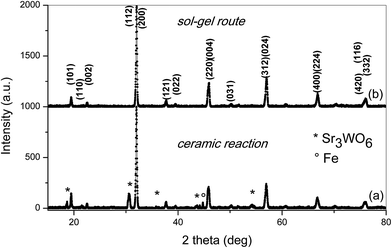
The X-ray diffraction pattern for Sr2FeMo0.5W0.5O6 specimens prepared by the ceramic reaction and the sol–gel route are shown in Fig. 1. The dominant phase is tetragonal (I4/m, a = 5.5849(4) Å, c = 7.9362(8) Å). For the series prepared by ceramic synthesis, traces of the Sr3WO6 impurity phase20 and even pure Fe could be detected (Fig. 1(a)). These phases most probably formed by segregation. Located in the intergranular regions, it is known that these other phases can affect the magnetic and magnetoresistance properties of SFMWO.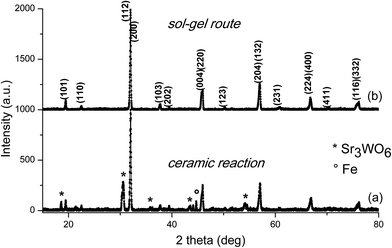 | ||
| Fig. 1 X-ray diffraction pattern of Sr2FeMo0.5W0.5O6 prepared by (a) the ceramic reaction method, (b) the sol–gel route. | ||
In contrast (Fig. 1(b)), no impurity phases were found for specimens prepared by the sol–gel route showing a single-phase behaviour following X-ray analysis across the entire compositional range. No impurity phases were detected. This demonstrates a complete solubility of Mo and W and preservation of the double perovskite structure.
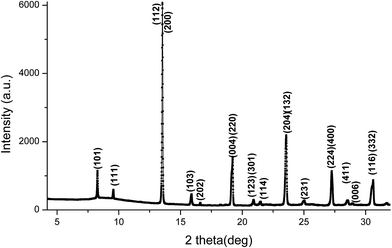
Therefore, more accurate measurements have been done at the synchrotron on the sol–gel sample to control for impurities. The results support phase pure compounds (Fig. 2).
The Sr2FeMoO6 XRD analysis showed no trace of SrMoO4 impurities in samples prepared by sol–gel after calcination followed by sintering (Fig. 3). However, samples prepared for ceramic reaction contained traces of SrMoO3. It is known10 that the SrMoO4 impurity found in solid solutions are associated with SFMO oxygenation. This might be because of the increasing valence states from Mo5+ to Mo6+, which reduces the solubility of Mo in SFMO.
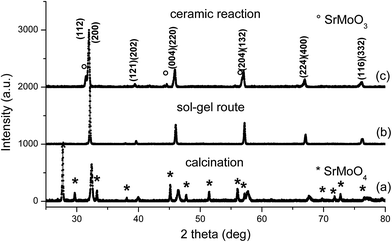 | ||
| Fig. 3 X-ray diffraction pattern of Sr2FeMoO6 prepared by the sol–gel route (a) precursor after calcination, (b) further sintering and (c) Sr2FeMoO6 prepared by ceramic reaction. | ||
The XRD patterns of the SFMWO series were analyzed by the Rietveld method using MAUD.21 The data indicated, both a tetragonal (I4/m) and monoclinic (P21/n) crystal structures (see Table 1). These data show the Sr2FeMo1−xWxO6 specimens with 0 ≤ x ≤ 0.5 exhibit a tetragonal structure, while for x ≥ 0.6 they are monoclinic (Fig. 4). In the ceramic syntheses, we found a mixture of Sr3WO6, Fe and main phase Sr2FeMo0.6W0.4O6; the sol–gel compound only contains the main phase.
| x | Space group | a (Å) | b (Å) | c (Å) | β (deg) |
|---|---|---|---|---|---|
| 0 | I4/m | 5.5809(2) | 5.5809(2) | 7.9075(5) | α = β = γ = 90 |
| 0.1 | I4/m | 5.5795(2) | 5.5795(2) | 7.9091(4) | α = β = γ = 90 |
| 0.2 | I4/m | 5.5788(1) | 5.5788(1) | 7.9135(2) | α = β = γ = 90 |
| 0.3 | I4/m | 5.5778(5) | 5.5778(5) | 7.9043(14) | α = β = γ = 90 |
| 0.4 | I4/m | 5.5938(3) | 5.5938(3) | 7.8923(6) | α = β = γ = 90 |
| 0.5 | I4/m | 5.5927(3) | 5.5927(3) | 7.9475(6) | α = β = γ = 90 |
| 0.6 | P21/n | 5.6232(5) | 5.5990(5) | 7.9059(6) | 90.052(2) |
| 0.7 | P21/n | 5.6277(6) | 5.6016(7) | 7.9061(8) | 89.862(2) |
| 0.8 | P21/n | 5.6331(6) | 5.6076(5) | 7.9255(8) | 89.974(3) |
| 0.9 | P21/n | 5.6460(2) | 5.6124(2) | 7.9382(3) | 89.997(11) |
| 1 | P21/n | 5.6467(11) | 5.6138(9) | 7.9512(14) | 90.081(3) |
 | ||
| Fig. 4 X-ray diffraction pattern of Sr2FeMo0.4W0.6O6 (monoclinic) prepared by the (a) ceramic reaction and (b) sol–gel procedure. | ||
The lattice parameters of the Sr2FeMo0.4W0.6O6 specimens (Table 1) are plotted in Fig. 5. An expansion of the cell parameters upon W substitution is observed in agreement with previous studies.7 The expansion of the unit cell volume is attributed to a gradual replacement of Fe3+Mo5+ by Fe2+W6+ states during W doping in view of the larger ionic radius of Fe2+ (0.78 Å) versus Fe3+ (0.645 Å).3,15 Here, a monoclinic phase forms already at x = 0.6. More pronounced fluctuations in the lattice parameter values along the c-axis in the intermediate compositional range are related to an octahedral distortion and a bond-strain accumulation (for x < 0.6) and relaxation (for x ≥ 0.6).
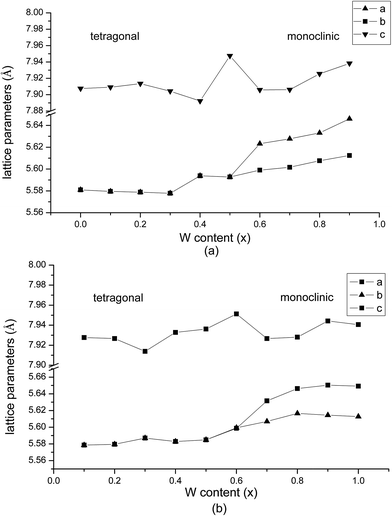 | ||
| Fig. 5 Lattice parameter data for the (a) sol–gel Sr2FeMo0.4W0.6O6 and (b) ceramic reaction specimens. Errors are less than the size of the symbols. | ||
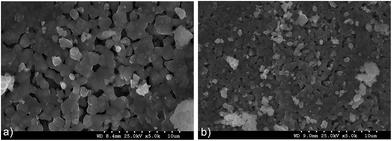
The scanning electron microscopy study reveals a higher and more compact, homogenous grain distribution of the sintered pellet prepared by sol–gel syntheses as compared to the ceramic reaction methods. In the sol–gel protocol, citric acid and EDTA additives are essential to promote interactions with metal ions such as Sr2+, Fe3+ and Mo6+.
The gel powder sintered at 1000 °C has an average grain size of about 0.5–1 μm with homogeneous, fine morphology and more dense structure versus powders obtained by the ceramic reaction method (Fig. 6). The macroscopic properties and structure of SFMWO compounds may be affected by the sintering process. EDX analysis of the series approved the stoichiometric composition and presence of essential elements.
3.2 Magnetization measurements (SQUID)
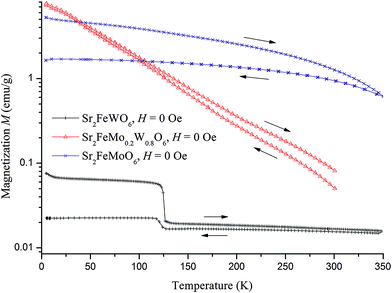
The magnetic behaviour of x = 0 during zero field cooling in 100 Oe magnetic field was analysed in (Fig. 7). This compound showed an increase in magnetization upon field cooling (FC). This effect may be due to the decrease in thermal fluctuations of magnetic moments. The magnetization increased at zero field as well, but not as strongly as in a field. This is similar to the behaviour of a ferrimagnet, where the influence of the negative magnetic sub-lattice leads to a decrease in the overall magnetization. For a ferromagnetic behaviour, the magnetization curve at zero field would be the same as in an applied field. Both the cooled field and the cooled zero field samples start with a non-zero magnetization. This is a sign of residual magnetisation because the measurement was started at a temperature below the Curie temperature.The behaviour of the remanent magnetization seen during heating and cooling in a zero field was also analysed (Fig. 8). SFMO shows a decrease in magnetization as the temperature is increased, which is a typical ferro-/ferrimagnetic compound. As the sample is cooled, the magnetic ordering is restored. In ferromagnetic materials, the remanent magnetization would return almost to baseline. In a ferrimagnetic sample, however, the negative sub-lattice decreases remanent magnetization. The SFMO clearly shows ferrimagnetic behaviour, which disappears at Tc = 420–450 K.
In Sr2FeMo0.2W0.8O6, the magnetization decreases rapidly when it is heated (Fig. 8). This behaviour is quite interesting because it does not appear to be a ferro-, ferri-, or antiferromagnetic. A possible explanation is the presence of a spin-glass state.22,23
The magnetization of SFWO stays at a constant level until it decreases suddenly at about 125 K. When the sample is cooled again, it shows a small increase in the magnetization at the same temperature. This suggests the presence of some ferro- or ferrimagnetism in x = 1; the sudden change in magnetization could indicate its Curie temperature Tc. At temperatures over 125 K, the magnetization is still not zero, which indicates the presence of another ferro-/ferrimagnetic phase with a Tc higher than 350 K. It is possible that this is the same ferrimagnetic ordering as measured at x = 0 with a Tc = 420–450 K as mentioned in the literature.10,23,24
The hystereses were measured for both series and magnetization curves (M vs. H) are shown in Fig. 9. In order to avoid thermal activation, the measurements were performed at low temperature (4.2 K).
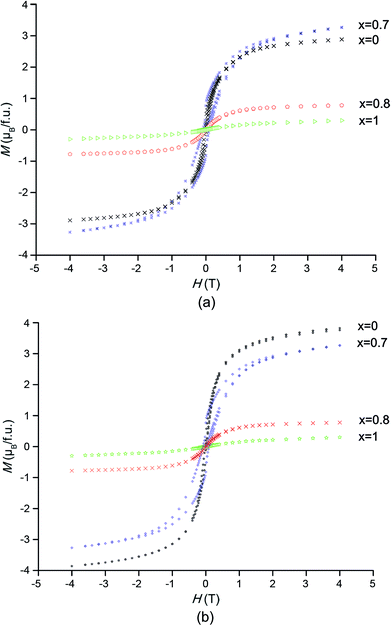 | ||
| Fig. 9 Hysteresis curves of SFMO, Sr2FeMo0.2W0.8O6, and SFWO. (a) ceramic reaction (b) sol–gel route. | ||
In both series, the hysteresis loop for x = 0 is quite narrow and the saturation field is very low at about 1 T, which indicates that this compound is a soft ferrimagnet. The entirely well-ordered sample with ferromagnetic coupling between the Fe3+ (3d5) and Mo5+ (4d1) states was estimated to have a magnetic moment of 4 μB per f.u.7 The saturation magnetization in the ceramic reaction and sol–gel compounds are 3.14 and 3.6 μB per f.u. respectively, which is in agreement with the finding of previous studies.4 This deviation might be occurred with limited disorder, which can happen given the chemical inhomogeneity in samples prepared via different methods. After complete replacement of Mo by W, the magnetization dropped which is attributed to a slight decrease in the ordering factor on the B-sites. This indicates the loss of long-tern ferromagnetic ordering and gives evidence for metal insulator transition (MIT) in this complex compound.
Even after 70% substitution of Mo by W in the Sr2FeMo0.3W0.7O6 compound, the magnetization is still very high. This compound possesses a broad hysteresis loop and saturation magnetization could not be attained even at 5 T. The magnetization reached up to 3.5 μB per f.u. in the sample prepared using a ceramic reaction method; it differed marginally in the sol–gel compound. Ref. 3 noted that W doping would improve the ordering among Fe3+ and (W, Mo)5+ states that result in improved magnetization.
A consequence of the higher incidence of grain boundaries in the sol–gel compound is, that the magnetization deviates from an increasing trend. This decrease agrees well with the result from SEM Fig. 6 which shows a fine structure with higher grain boundaries in the sol–gel compare to ceramic reaction. Another scenario proposed by Kobayashi et al.1 is the Sr2FeMoO6-like phase with the Mo5+ (4d1) configuration with a admixture of Sr2FeWO6 which remains in the ferrimagnetic state, therefore the magnetization remains quite large.
Ref. 4 suggests that other feasible causes of such a high Ms for the x = 0.7 compound would be that Sr2FeMoO6-like clusters have a tendency to polarize the neighbouring Sr2FeWO6 regions and improve magnetization.
At an 80% replacement of Mo by W, there is a sudden drop indicating a transition from ferromagnetic to antiferromagnetic state.
The M vs. T curves for both series are presented in Fig. 10. Through increasing the amount of W over x > 0.7, an antiferromagnetic ordering appeared near a Neel temperature of TN = 40 K. In these samples, ferrimagnetism and antiferromagnetism exist simultaneously.1,25 A long range of AFM ordering and a clear Neel peak are observed in SFWO (Fig. 11). By doping the W, the valence transition from ferrimagnetic to antiferromagnetic occurs in the range of 0.7 < xc < 0.8.
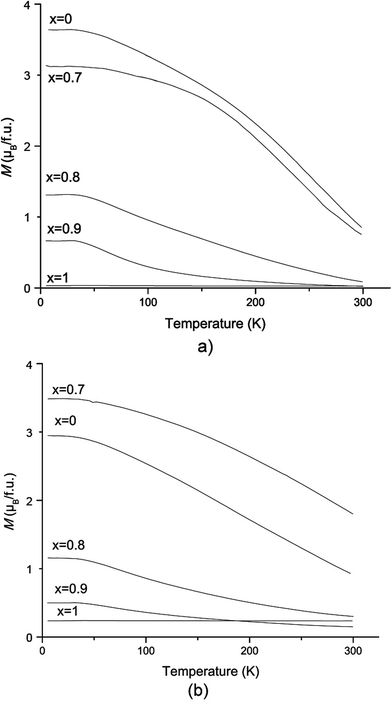 | ||
| Fig. 10 Zero field cooling magnetization dependence on temperature at 1 tesla for (a) sol–gel route (b) ceramic reaction. | ||
The magnetization declined by doping the W after x > 0.7. This might be because of a decrease in the antisite defects of Fe and (Mo, W) on the B sites. Alternatively, the specific spin arrangement of Fe and (Mo, W) sub-lattices will disappear by increasing disorder or might be the result of chemical composition diversity in different parts of the sample.
In general, the sol–gel compound is expected to have more order in the Fe/Mo sites that would cause higher magnetic properties. Iron can cause metal cluster formation that generates ferromagnetic coupling, whereas the ceramic reaction compound Fe/Mo will result in antiferromagnetic coupling.10
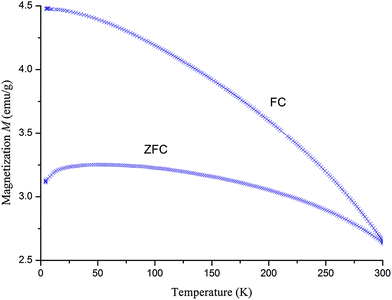
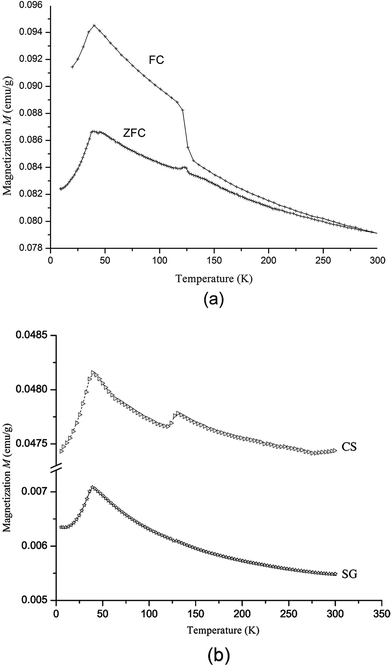
The SFWO sample prepared by ceramic reaction was measured in the FC and ZFC mode and shows two transitions (Fig. 11). Near 125 K, a transition occurs that is best visible in the FC curve. It is the same transition from a ferrimagnetic to a ferrimagnetic state below 125 K that was observed in the remanent magnetization curves (Fig. 9). The FC and ZFC curves below this temperature indicate the presence of a ferrimagnetic phase. Below 40 K, the magnetization decreases with temperature. This is likely an antiferromagnetic system. The transition temperature (the so-called Néel temperature TN) is in the same range as the literature value of TN = 37–40 K.1,7,14 Combined with the results from the remanent magnetization experiment, this suggests the occurrence of three different magnetic states in SFWO: an antiferromagnetic state below 40 K, a ferrimagnetic state below 125 K, and a ferrimagnetic state up to 350 or 450 K.
Zero field cooling measurements at 100 Oe for SFWO prepared by sol–gel method (Fig. 11b) did not show such a transition at 125 K. We conclude that the sample prepared by the sol–gel route represent a purer phase with respect to these two states. The ceramic synthesis sample showed three states of different phases.
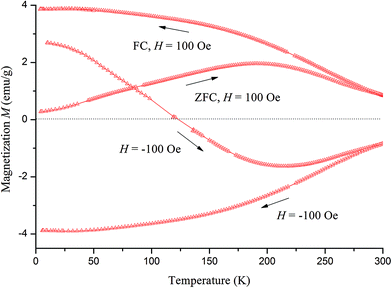
For Sr2FeMo0.3W0.7O6, the FC and ZFC curves show ferrimagnetic behaviour (Fig. 12). A further measurement was made after, cooling to 4.2 K in a 100 Oe field that was inversed to −100 Oe. This lead to a decrease in magnetization, because the negative sublattice of the ferrimagnetic state was excited. The magnetization decreased as the temperature increased. The magnetization was zero at 120 K. This was the compensation temperature θComp26 and at this point the positive and negative sublattices cancel each other. Afterwards, the sample was cooled again by inversing the field to −100 Oe. This curve is the reflection of the FC curve in positive field. The SQUID measurements confirmed that SFMO and Sr2FeMo0.3W0.7O6 have ferrimagnetic ground states.
4. Conclusions and outlook
We report on a sol–gel procedure to prepare homogeneous polycrystalline samples of a double perovskite showing minimum antisite disorder, promoting a high saturation magnetization and a low field magnetization. The physical properties of this series are influenced by the order parameter of the structure that is affected by the method of synthesis and conditions. The reactant concentrations and reducing conditions must be chosen carefully to prepare pure double perovskite samples with small anti-site defects.The results indicate that the magnetic properties change from ferrimagnetic to antiferromagnetic at a critical composition of 0.7 < xc < 0.8 by W doping. The magnetic measurements indicated that the sol–gel sample saturation magnetization is slightly greater than those prepared by the ceramic reaction method.
Acknowledgements
We thank Prof. S. Decurtins and Dr K. Krämer for cooperation and providing a SQUID. Thanks Ms Beatrice Frey for X-ray diffraction and electron microscopy measurements. Marc Luginbühl, Manuel Gnägi for sample preparation. We acknowledge the support of the team at the materials science beamline MS X04SA at the Swiss Light Source.References
- K. I. Kobayashi, T. Okuda, Y. Tomioka and T. Kimura, J. Magn. Magn. Mater., 2000, 218, 17–24 CrossRef CAS.
- J. Linden, T. Yamamoto, M. Karppinen, H. Yamauchi and T. Pietari, Appl. Phys. Lett., 2000, 76, 2925 CrossRef CAS.
- R. I. Dass and J. B. Goodenough, Phys. Rev. B: Condens. Matter Mater. Phys., 2001, 63, 064417 CrossRef.
- S. Ray, A. Kumar, S. Majumdar, E. V. Sampathkumaran and D. D. Sarma, J. Phys.: Condens. Matter, 2001, 13, 607–616 CrossRef CAS.
- A. P. Douvalis, M. Venkatesan, J. M. D. Coey, M. Grafoute, J.-M. Greneche and R. Suryanarayanan, J. Phys.: Condens. Matter, 2002, 14, 12611–12627 CrossRef CAS.
- J. Linden, T. Yamamoto, J. Nakamura, H. Yamauchi and M. Karppinen, Phys. Rev. B: Condens. Matter Mater. Phys., 2002, 66, 184408 CrossRef.
- D. Sanchez, J. A. Alonso, M. Garcia-Hernandez, M. J. Martinez-Lope, M. T. Casais and J. Phys, J. Phys.: Condens. Matter, 2005, 17, 3673–3688 CrossRef CAS.
- K. I. Kobayashi, T. Kimura, H. Sawada, K. Terakura and Y. Tokura, Nature, 1998, 395, 677–680 CrossRef CAS.
- E. Burzo, I. Balasz, M. Valeanu and I. G. Pop, J. Alloys Compd., 2011, 509, 105–113 CrossRef CAS.
- M. Cernea, F. Vasiliu, C. Bartha, C. Plapcianu and I. Mercioniu, Ceram. Int., 2014, 40, 11601–11609 CrossRef CAS.
- D. D. Sarma, P. Mahadevan, T. Saha-Dasgupta, S. Ray and A. Kumar, Phys. Rev. Lett., 2000, 85, 2549 CrossRef CAS PubMed.
- M. Retuerto, J. A. Alonso, M. J. Martínez-Lope, J. L. Martínez and M. García-Hernández, Appl. Phys. Lett., 2004, 85, 266 CrossRef CAS.
- W. Zhong, W. Liu, C. T. Au and Y. W. Du, Nanotechnology, 2006, 17, 250 CrossRef CAS.
- H. Kawanaka, I. Hase, S. Toyama and Y. Nishihara, Phys. B, 2000, 281–282, 518–520 CrossRef.
- A. K. Azad, S.-G. Eriksson, A. Mellergard, S. A. Ivanov, J. Eriksen and H. Rundlof, Mater. Res. Bull., 2002, 37, 1797–1813 CrossRef CAS.
- C. W. Yang and T. T. Fang, J. Electrochem. Soc., 2012, 159, 35–39 CrossRef.
- P. Zhao, R. C. Yu, F. Y. Li, Z. X. Liu, M. Z. Jin and C. Q. Jin, J. Appl. Phys., 2002, 92, 1942–1944 CrossRef CAS.
- A. Calleja, X. Capdevila, M. Segarra and C. Frontera, J. Eur. Ceram. Soc., 2011, 31, 121–127 CrossRef CAS.
- M. Lingg, Synthesis of Sr2FeMo1−xWxO6 (0 ≤ x ≤ 1) double perovskites, Bachelor thesis, University of Bern, 2013.
- G. King, A. M. Abakumov, J. Hadermann, A. M. Alekseeva, M. G. Rozova, T. Perkisas, P. M. Woodward, G. van Tendeloo and E. V. Antipov, Inorg. Chem., 2010, 49, 6058–6065 CrossRef CAS PubMed.
- L. Lutterotti, S. Mathies and H. R. Wenk, IUCr: Newsletter of the CPD, 1999, 21, 14–15 Search PubMed.
- K. Binder and A. P. Young, Rev. Mod. Phys., 1986, 58, 801 CrossRef CAS.
- Y. Tomioka, T. Okuda, Y. Okimoto, R. Kumai, K.-I. Kobayashi and Y. Tokura, Phys. Rev. B: Condens. Matter Mater. Phys., 2000, 61, 422 CrossRef CAS.
- S. L. Hoang, N. X. Phuc, P. V. Phuc, N. M. Hong and L. V. Hong, J. Raman Spectrosc., 2001, 32, 817–820 CrossRef.
- J. Lindén, T. Yamamoto, J. Nakamura, M. Karppinen and H. Yamauchi, Appl. Phys. Lett., 2001, 78, 2736 CrossRef.
- V. López-Flores, N. Bergeard, V. Halté, C. Stamm, N. Pontius, M. Hehn, E. Otero, E. Beaurepaire and C. Boeglin, Phys. Rev. B: Condens. Matter Mater. Phys., 2013, 87, 214412 CrossRef.
| This journal is © The Royal Society of Chemistry 2016 |

