Chromatographic analysis of multicomponent mixture of vitamins B1, B6, B12, benfotiamine and diclofenac; part II: LC-tandem MS/MS method for simultaneous quantification of five components mixture in pharmaceutical formulations and human plasma

Ahmed Salah Fayed* and Maha Abdel-Monem Hegazy
Analytical Chemistry Department, Faculty of Pharmacy, Cairo University, Cairo, Egypt. E-mail: fayedaeg@yahoo.com; ahmed.fayed@pharma.cu.edu.eg; Tel: +20 1001494990

Received 11th February 2016 , Accepted 29th March 2016

First published on 4th April 2016


Abstract

A novel high performance liquid chromatography coupled with tandem mass spectrometry (LC-MS/MS) method was established for the simultaneous determination of multivitamins, namely thiamine hydrochloride (B1), pyridoxine (B6), cyanocobalamin (B12) and benfotiamine (BEN) and their co-formulated drug, diclofenac sodium (DIC) using torsemide as internal standard (IS). Chromatographic separation was accomplished on Shimadzu LC-20 AT Series HPLC, equipped with Sunfire C18 column (Waters) (50 × 4.6 mm, 5 μm) using methanol[thin space (1/6-em)]:[thin space (1/6-em)]0.02 M ammonium acetate (80[thin space (1/6-em)]:[thin space (1/6-em)]20, v/v) pH 6.0 for B1, B12, BEN and DIC, while using methanol[thin space (1/6-em)]:[thin space (1/6-em)]acetonitrile[thin space (1/6-em)]:[thin space (1/6-em)]0.01 M ammonium formate (80[thin space (1/6-em)]:[thin space (1/6-em)]10[thin space (1/6-em)]:[thin space (1/6-em)]10, v/v/v) pH 6.25 for B6 on separate runs at a flow rate of 1.0 mL min−1. Sample preparation involves extraction with methanol using 30 ng mL−1 of IS. Electrospray ionization (ESI) source was operated in the positive ion mode. The multiple reaction monitoring (MRM) mode on a triple quadrupole mass spectrometer was used to quantify the drugs utilizing the transitions of 265.07/122.10, 170.01/152.20, 678.64/147.01, 467.18/122.10, 296.02/214.20, 348.99/263.90 (m/z) for B1, B6, B12, BEN, DIC and IS, respectively. The proposed method was effectively applied for the analysis of laboratory prepared mixtures, in spiked human plasma as well as in their combined pharmaceutical formulations. A detailed analytical and bioanalytical validation was conducted in compliance with the FDA and ICH guidelines proving the method to be selective, linear, precise and accurate over the concentration ranges of 0.01–20.00, 0.02–50.00, 15.00–500.00, 5.00–500.00 and 10.00–500.00 ng mL−1 for the five compounds, in order. The simplicity and sensitivity of this method allows its use in the quality control of the cited drugs.

1. Introduction

Vitamins are organic compounds which are essential for vital activities. Vitamin B complex, thiamine (B1), pyridoxine (B6), cyanocobalamin (B12) and benfotiamine (BEN) play different specific and vital functions in metabolism and the decrease or increase in their levels lead to specific diseases.1 B1 is a water-soluble vitamin, its phosphate derivatives are involved in many cellular processes and its insufficiency leads to polyneuritis. B6 is a water-soluble vitamin present in different forms, but pyridoxal phosphate is the active form. B12 is also called cyanocobalamin, is a water-soluble vitamin with a key role in the normal functioning of the brain and nervous system, and for the formation of blood. BEN or S-benzoylthiamine-O-monophosphate is a synthetic derivative of B1 and useful in the treatment of painful nerve conditions and primarily marketed as an antioxidant dietary supplement.

Diclofenac (DIC) is a non-steroidal anti-inflammatory drug (NSAID) that is commonly co-formulated in tablets and capsules with vitamin B complex to reduce inflammation.1 The structural formulae of B1, B6, B12, BEN and DIC are shown in (Table 1). As the selected compounds are commonly co-formulated, there is a need for development of accurate and efficient analytical methods for their determination which is considered problematic and very difficult because of the complexity of the matrices in which they are usually analyzed, their spectral similarity and their variable concentration ratios.2,3 The standard and official analytical methods4,5 which are sometimes non-specific and time consuming, involve pre-treatment of the sample through complex chemical, physical, or biological steps to eliminate the interferences commonly found, followed by individual method for each different vitamin. These methods include spectrophotometric, polarographic, fluorimetric, enzymatic, and microbiological procedures. There is a limited number of reported methods for determination of the studied compounds either in their single or multicomponent mixtures. They include the determination of B1 and B6 in pharmaceutical preparation by ratio spectra derivative spectrophotometry and HPLC,6,7 electrothermal atomic absorption spectrometric method,8 capillary electrophoresis9–11 and HPLC.12–24 The determination of mixture of the five components was only achieved spectrophotometrically in a previous work in our laboratory through the use of multivariate calibration methods in conjunction with derivative spectrophotometry.25

Table 1 The chemical structure of each compound and its suggested product ion
Compound Precursor ion (Q1) Product ion (Q3)
B1 image file: c6ra03867k-u1.tif image file: c6ra03867k-u2.tif
B6 image file: c6ra03867k-u3.tif image file: c6ra03867k-u4.tif
B12 image file: c6ra03867k-u5.tif image file: c6ra03867k-u6.tif
BEN image file: c6ra03867k-u7.tif image file: c6ra03867k-u8.tif
DIC image file: c6ra03867k-u9.tif image file: c6ra03867k-u10.tif


Since chromatographic methods are of choice in quality control laboratories due to their selectivity, this study was directed to this technique in two parts. In the first part, the mentioned drugs were separated by HPLC-DAD and UPLC methods.26 The aim of this manuscript is to develop a highly sensitive bio-validated method and to show the capability LC-MS/MS for determination of the five compounds in tablets, capsules and human plasma. The advantages of the developed method is shortening of the analysis time the highest sensitivity where concentration down to ng mL−1 can be accurately and precisely determined which allows the use of the method to determine the compounds in plasma and to be applied for bioequivalent and bioavailability studies. On the other hand the previously developed methods do not need expensive instruments and applicable for quality control laboratories.

2. Experimental

2.1. Instruments

The analysis was achieved using mass spectrometer (MS/MS) API 3200 triple quadruple (Applied Biosystems, MDS, SCIEX, Canada), (AB Sciex, Toronto, Canada), equipped with a turbo ion spray interface at 350 °C and operating with N300DR (Peak Scientific, Scotland) nitrogen generator. The control of the LC-MS/MS system, collection and analysis of the data was performed utilizing Analyst software version 1.4.2. Chromatography was carried on an HPLC system consists of; solvent delivery system (SHIMADZU LC-20AT, Japan), which is standalone modular unit that features a reciprocating single piston isocratic pump (SHIMADZU LC-20AD, Japan). SHIMADZU DGU-20A5 online degasser and SHIMADZU SIL-20A, Japan auto sampler were used for mobile phase degassing and sample introduction. Other equipment were; centrifuge (Eppendorf 5804 R, Hamburg, Germany), vacuum concentrator (Eppendorf AG5301, Germany), vision scientific vortex-mixer (KMC-1300V, China), organic dispenser (Varispense, Eppendorf, Germany) and Thermofisher scientific −80 °C freezer (Elite, USA).

2.2. Chemicals and reagents

B1, B6 (both as their hydrochloride salts) and B12 pure standard material materials were kindly supplied by Egyptian International Pharmaceutical Industry Co. (EIPICO) (10th of Ramadan City, Cairo, Egypt) with certified purities of 99.60%, 98.70% and 100.89%, respectively. BEN pure standard material was supplied from Eva Pharma for Pharmaceutical & Medical Appliances (Giza, Egypt) with certified purity of 99.90%, while, DIC (as sodium salt) pure standard material was kindly supplied by Sigma Pharmaceuticals Industries (El-Monofeya, Egypt) and certified to contain 99.70%. Torsemide USP reference standard was used as the internal standard. All chemicals and solvents were of HPLC grade; acetonitrile (E Merk, Germany), methanol (E Merk, Germany), deionized Millipore filtered water, ammonium acetate (Sigma Aldrich, USA) and ammonium formate (Sigma Aldrich, USA).

Frozen human plasma, batch number 071937 was obtained from VACSERA (Giza, Egypt).

2.3. Pharmaceutical formulations

Milga® tablets (batch no. 412857) were manufactured by Eva Pharma for Pharmaceutical & Medical Appliances (Giza, Egypt) and nominally contain 60, 0.25 and 40 mg per tablet of B6, B12 and BEN, respectively. Arthineur® capsules (batch no. 14741C) were manufactured by EGYPHAR (Al-Obour City, Egypt) nominally contain 50, 50, 0.25 and 50 mg per tablet of each of B1 (as mononitrate salt), B6, B12 and DIC (as sodium salt), respectively. Both formulations were purchased from local market.

2.4. Chromatographic and mass spectrometric conditions

Chromatographic separation was accomplished on Sunfire C18 (Waters) (50 × 4.6 mm, 5 μm) and a guard column; phenomenex C18 (Waters) (5.0 × 4.0 mm, 5 μm). Methanol[thin space (1/6-em)]:[thin space (1/6-em)]0.02 M ammonium acetate (80[thin space (1/6-em)]:[thin space (1/6-em)]20, v/v) pH 6.0 was used as a mobile phase for determination of B1, B12, BEN and DIC, while for B6 either in mixtures or alone; methanol[thin space (1/6-em)]:[thin space (1/6-em)]acetonitrile[thin space (1/6-em)]:[thin space (1/6-em)]0.01 M ammonium formate (80[thin space (1/6-em)]:[thin space (1/6-em)]10[thin space (1/6-em)]:[thin space (1/6-em)]10, v/v/v) pH 6.25 on separate runs. The mass spectrometric detection and quantitation was carried out in the positive-ion mode utilizing electrospray ionization (ESI) using torsemide as an internal standard. The optimized parameters are; polarity; positive, ion spray; turbo spray, curtain gas; 20 psi, nebulizing gas, turbo gas and collision activated dissociation gas; 30, 50 and 7 psi, respectively. Ion spray voltage; 5500, temperature; interface heater 350 °C. The injection volume and the flow rate were 15 μL and 1.0 mL min−1, respectively. The quadrupole mass spectrometer was operated at the MRM mode, monitoring the transition of molecular ions to the product ions 265.07/122.10, 170.01/152.20, 678.64/147.01, 467.18/122.10, 296.02/214.20, 348.99/263.90 (m/z) for B1, B6, B12, BEN, DIC and IS, respectively.

2.5. Procedure

2.5.1. Preparation of calibration standards. Primary stock standard solutions of 0.5 mg mL−1 for each of B1, B6, B12, BEN, DIC and 0.3 mg mL−1 for IS were separately prepared in methanol and stored at −20 °C; they were found to be stable for one month. Secondary stock standard solutions were prepared by appropriate dilution with methanol on the day of analysis after equilibration at room temperature for one hour.
2.5.2. Construction of calibration curves. Standard solutions used for constructing the calibration curves and quality control samples were prepared every time before sample analysis. Both primary and secondary stock standard solutions were used to prepare nine different working standard solutions of the five components by accurately taking aliquots and making the appropriate dilution either with mobile phase (analytical procedure) or with plasma (bioanalytical procedure), Table 2. The prepared working standards either in the mobile phase or in plasma were in the concentration range of 0.01–20.00, 0.02–50.00, 15.00–500.00, 5.00–500.00 and 10.00–500.00 ng mL−1 for B1, B6, B12, BEN and DIC, in order.
Table 2 Preparation of standards used for construction of calibration curves and quality control samplesa
  B1 B6 B12 BEN DIC
a b c a b c a b c a b c a b c
a Where, ‘a’ is the concentration of working standard solution in ng mL−1, ‘b’ is the volume taken in μL and ‘c’ is the final concentration in ng mL−1 after completing the volume to 5 mL either with methanol or with human plasma for analytical and bioanalytical procedures, respectively.
1 1 50 0.01 2 50 0.02 1000 75 15 500 50 5 500 100 10
2 1 100 0.02 2 100 0.04 1000 150 30 500 100 10 500 200 20
3 (QCL) 1 150 0.03 2 150 0.06 1000 225 45 500 150 15 500 300 30
4 200 20 0.8 400 20 1.6 5000 50 50 5000 50 50 5000 50 50
5 200 175 7.0 400 200 16.0 5000 200 200 5000 200 200 5000 200 200
6 (QCM) 500 100 10.0 1000 125 25.0 10[thin space (1/6-em)]000 125 250 10[thin space (1/6-em)]000 125 250 10[thin space (1/6-em)]000 125 250
7 500 150 15.0 1000 150 30.0 10[thin space (1/6-em)]000 175 350 10[thin space (1/6-em)]000 175 350 10[thin space (1/6-em)]000 175 350
8 (QCH) 500 160 16.0 1000 200 40.0 10[thin space (1/6-em)]000 200 400 10[thin space (1/6-em)]000 200 400 10[thin space (1/6-em)]000 200 400
9 500 200 20.0 1000 250 50.0 10[thin space (1/6-em)]000 250 500 10[thin space (1/6-em)]000 250 500 10[thin space (1/6-em)]000 250 500


For analytical; to each of a series of vials, 50 μL of prepared working IS solution 300 ng mL−1 were transferred then 0.5 mL of the different working standard solutions of single or mixtures of the investigated drugs were added then analyzed in triplicates as under chromatographic and mass spectrometric conditions.

For bioanalytical; to each of a series of vials, 50 μL of prepared working IS solution 300 ng mL−1 were transferred then 0.5 mL of the different working standard solutions prepared in plasma were added, vortex mixed for 10 s, 1.5 mL methanol was added, vortex mixed for 1.5 min and centrifuged for 10 min at 4000 rpm. The organic layer was then decanted and evaporated at 45 °C to dryness using vacuum concentrator, reconstituted with 250 μL of mobile phase and loaded to the auto sampler. Analysis was performed in triplicates as under chromatographic and mass spectrometric conditions.

2.6. Application to pharmaceutical preparations

For Milga® tablets; ten tablets were accurately weighed, crushed, mixed and finely powdered. A weight of 354 mg (corresponding to the average weight of one tablet) was dissolved in 100 mL methanol and sonicated for 1 hour.

For analysis of B12; 1 mL was diluted into 10 mL volumetric flask with methanol to obtain a final concentration of 250 ng mL−1 of B12. As for BEN, 60 μL were diluted to 100 mL with methanol the final concentration was 240 ng mL−1 BEN, while for B6 from the last solution 1 mL was diluted to 10 mL with methanol to give a final concentration of 36 ng mL−1.

For Arthineur® capsules; the content of ten Arthineur capsules were evacuated, a weight corresponding to one capsule (195 mg) was transferred to 250 mL volumetric flask, methanol was added to the mark and sonicated for 1 hour.

For analysis of B12; 1 mL was diluted into 10 mL flask with methanol; the final concentration was 100 ng mL−1.

For analysis of B1, B6 and DIC; 10 μL of the prepared solution were transferred in 100 mL flask and the volume was completed with methanol, the final concentrations was 20 ng mL−1 for each of the three compounds.

2.7. Method validation

The method was validated to meet the acceptance criteria of the guidance for analytical and bioanalytical method validation.27,28
2.7.1. Specificity and selectivity. One of the advantages of coupling LC with MS/MS detection in the MRM mode is high specificity, since only the ions resulting from the analytes of concern are observed. The chromatograms of the samples were monitored for the detection of any extra peaks. For assessing specificity in plasma; six different batches of human plasma were analyzed to demonstrate the lack of chromatographic interference from endogenous plasma components.
2.7.2. Calibration curve. Calibration curves were constructed by plotting the peak area ratio of the transition pair of analytes to that of IS against the concentration range of calibration standards. The concentrations used for B1, B6, B12, BEN and DIC calibration curve were in the range of 0.01–20, 0.02–50, 15–500, 5–500 and 10–500 ng mL−1, respectively. Two calibrations curves were constructed one for the methanolic standard solutions and the other for those prepared in plasma. Blank samples were run with each calibration curve.
2.7.3. Precision and accuracy. Accuracy, intraday and interday precision were evaluated for samples prepared in methanol, while for spiked plasma samples, inter- and intra-assay precision and accuracy were evaluated by analyzing six replicates at the lower level of quantification (LLOQ) in addition to two different QC levels as described above on different days.
2.7.4. Recovery. The recovery of B1, B6, B12, BEN and DIC from plasma was determined by comparing the responses of the analytes extracted from replicate QC samples at QCL and QCH with the response of analytes from post-extracted plasma standard sample at equivalent concentrations.
2.7.5. Matrix effect. The effect of plasma constituents over the ionization of analytes and IS was determined by comparing the responses of the post extracted plasma standard QC samples (n = 4) with the response of analytes from neat samples at equivalent concentrations. Matrix effect was determined at same concentrations for each analyte as in recovery experiment.
2.7.6. Stability experiments. The stability of analytes and IS in the injection solvent was determined periodically by injecting replicate preparations of processed samples up to 24 h (in auto-sampler) after the initial injection. The peak-areas of the analytes and IS obtained at initial cycle were used as the reference to determine the relative stability of the analytes at subsequent points. Stability of analytes in the plasma after 8 h exposure in an ice bath (bench top) was determined at three concentrations in six replicates. Freezer stability of the analytes in plasma was assessed by analyzing the QC samples stored at −80 ± 10 °C for at least 6 weeks. The stability of analytes in plasma following repeated three freeze–thaw cycles (stored at −20 °C) was assessed using QC samples spiked with analytes.

3. Results and discussion

The main aim of this work was to establish and validate a LC-MS/MS method for the simultaneous determination of vitamins; B1, B6, B12, BEN and DIC in their bulk powders, combined dosage forms and spiked human plasma. LC-MS/MS technique provides a unique precise tool for absolute identification and quantitation of each component of a mixture of compounds. It overcomes the limitation of LC methods uncertainty for identification of compounds. MS as a detector generates three dimensional data include signal strength and spectral data for each point in time this allows the analyst to have valuable information about molecular structure, weight, purity and quantity of a sample. It has the advantages of analyze compounds lacking chromophores, also identifying components of unresolved chromatograms. The minimum time taken for analysis and the highest sensitivity are prominent advantages of the method. Therefore it was worthwhile to apply this technique for analysis of mixtures of vitamins, benfotiamine and diclofenac either in plasma and pharmaceutical formulations.

For achieving our aim the method development and validation was performed in methanol and in spiked plasma samples and both analytical and bioanalytical guidelines for validation were followed.

3.1. Optimization of mass spectrometric parameters

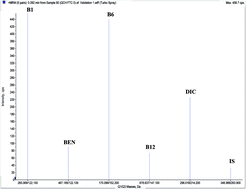
Aiming to the optimum detection of the five compounds along with the IS, tuning of the mass spectrometric parameters were thoroughly studied. The precursor ions and product ions were adjusted by infusion of 5.00 μg mL−1 neat solutions into the mass spectrometer. The ions were scanned in a mass range of 100–700 m/z. Since the five compounds and IS contain basic centers which promote acceptance of protons, accordingly they can be easily protonated under acidic chromatographic conditions. Intensity of their precursor ions and product ions was found to be ideal in the positive mode. Therefore, electrospray ionization (ESI) was operated in the positive ion mode using MRM analysis as we are dealing with mixtures of the studied compounds. Other operating parameters are shown in Table 3. The MRM spectra of the five components along with IS showing the precursor produced at (Q1) and selected product ion (Q3) is presented in Fig. 1. The Q1 full-scan mass spectra of B1, B6, BEN, DIC and IS showed predominant protonated precursor [M + H]+ ions at m/z 265.07, 170.01, 467.18, 296.02 and 348.99, respectively. While for B12 the doubly charged ion 678.63 which corresponds to half the empirical formula is the precursor ion which in accordance with previous study.29 Detection of ions was performed in MRM mode by monitoring the transition pairs as described under the experimental section. The precursor (Q1) and the suggested product ion (Q3) for each of the studied compounds is shown in Table 1.
Table 3 Specified MS parameters of each of the studied compoundsa
Compound Q1 Q3 DP EP CE CXP
a Where, ‘Q1’ is the precursor ion, ‘Q3’ is the product ion, ‘DP’ is the declustering potential, ‘EP’ is the entrance potential, ‘CE’ is the collision energy and ‘CXP’ is the collision exit potential.
B1 265.07 122.10 46.0 10.0 19.0 24.0
B6 170.01 152.20 46.0 10.0 19.0 10.0
B12 678.64 147.10 96.0 10.0 59.0 12.0
BEN 467.18 122.10 126.0 10.0 43.0 8.0
DIC 296.02 214.20 51.0 10.0 41.0 16.0
IS 348.99 263.90 45.0 6.0 23.0 8.0


image file: c6ra03867k-f1.tif
Fig. 1 Multiple reaction monitoring of the five studied compounds and IS under the applied chromatographic conditions showing both precursor/product ions for each compound.

The extracted ion chromatograms (XIC) of the studied drugs and IS are presented in Fig. 2 which shows the highest selectivity of the method.


image file: c6ra03867k-f2.tif
Fig. 2 The extracted ion chromatograms (XIC) of the five studied compounds and IS under the applied chromatographic conditions.

3.2. Optimization of sample preparation for spiked plasma

Sample preparation is an important step for the determination of the studied drugs in human plasma. Different approaches were tried as liquid–liquid extraction technique (using ethyl acetate, diethyl ether, dichloromethane, and n-hexane) and precipitation technique (using methanol and acetonitrile) for simultaneous determination of B1, B6, B12, BEN and DIC. Extraction of the selected compounds from human plasma was best achieved using methanol as an extracting solvent. The methanolic extract, was reconstituted with 250 μL and a volume of 15 μL was injected into the LC-MS/MS system.

3.3. Optimization of chromatographic conditions

In order to optimize the proposed LC-MS/MS method, the effects of several chromatographic parameters were investigated. Different columns were used; Agilent (Zorbax) Eclipse Plus (C18, 50 × 4.6 mm, 3.5 μm), Phenomenex (Luna) (C18, 50 × 4.6 mm, 5 μm), Waters (Sunfire) (C18, 50 × 4.6 mm, 5 μm), Phenomenex (Luna) CN (C18, 50 × 4.6 mm, 5 μm), and the optimum column that was used Sunfire (Waters) (C18, 50 × 4.6 mm, 5 μm) that gave highly resolution using gradient pump. For optimization of the mobile phase composition, different parameters were tested and optimized as the type of aqueous phase and organic modifier, organic modifier-aqueous ratio and pH. Different aqueous solutions and organic modifiers were tried in different percentages. The aqueous solutions include distilled water, 0.02 M ammonium acetate and 0.02 M ammonium formate. While for organic phase; acetonitrile and methanol were tried. Acetic acid, formic acid and ammonium hydroxide were used to adjust the pH range from 3.6 up to 8.7. These parameters were optimized based on the peak shape, peak intensity/area, peak resolution and retention time for the analytes on Sunfire (Waters) (C18, 50 × 4.6 mm, 5 μm). It was observed that the composition and pH of the mobile phase had a significant impact on separation selectivity and sensitivity of the method. The sensitivity was significantly increased with the use of methanol[thin space (1/6-em)]:[thin space (1/6-em)]0.02 M ammonium acetate (80[thin space (1/6-em)]:[thin space (1/6-em)]20, v/v, pH 6) for B1, B12, BEN and DIC. While for B6 it was noticed that better peak symmetry obtained when using methanol[thin space (1/6-em)]:[thin space (1/6-em)]acetonitrile[thin space (1/6-em)]:[thin space (1/6-em)]0.01 M ammonium formate (80[thin space (1/6-em)]:[thin space (1/6-em)]10[thin space (1/6-em)]:[thin space (1/6-em)]10, v/v/v, pH 6.25), for this reason, these conditions were used for analyzing B6 on separate runs. The flow rate of 1.0 mL min−1 was applied and the samples were run at the optimized chromatographic conditions under the general MS parameters and the specified parameters for each compound, Table 3.

Smaller injection volumes help in increasing the lifetime of smaller columns, reduction of instrument time and lower eluent consumption together with a cleaner mass source. All the analytes and IS were eluted in the narrow range of retention times (0.52–0.77 min), which is advantageous for the compensation of matrix effects, the extracted ion chromatogram showing their retention time are presented in Fig. 2.

3.4. Method validation

3.4.1. Specificity. The chromatograms of the samples were monitored for the detection of any extra peaks, however, no chromatographic interference from any of the excipients was observed at the retention times of the drugs. Moreover, by comparing the chromatogram of each sample with that of the standard revealed the absence of interference from any ingredient from either dosage forms or the endogenous products of plasma. Fig. 3 shows the chromatograms of blank human plasma. Fig. (4)–(8) show the full mass spectra of each of the five compounds and the chromatograms of blank plasma spiked with IS and the analytes at their QCH levels. The method selectivity was demonstrated on six blank plasma samples, the chromatograms were found to be free of interfering peaks.
image file: c6ra03867k-f3.tif
Fig. 3 Chromatograms of blank human plasma.

image file: c6ra03867k-f4.tif
Fig. 4 Full mass spectrum (MS2) of B1 and representative chromatogram for standard mixtures containing B1 (16 ng mL−1) and torsemide (IS).

image file: c6ra03867k-f5.tif
Fig. 5 Full mass spectrum (MS2) of B6 and representative chromatogram for standard mixtures containing B6 (40 ng mL−1) and torsemide (IS).

image file: c6ra03867k-f6.tif
Fig. 6 Full mass (MS2) spectrum of B12 representative chromatogram for standard mixtures containing B12 (200 ng mL−1) and torsemide (IS).

image file: c6ra03867k-f7.tif
Fig. 7 Full mass spectrum (MS2) of BEN and representative chromatogram for standard mixtures containing BEN (400 ng mL−1) and torsemide (IS).

image file: c6ra03867k-f8.tif
Fig. 8 Full mass spectrum (MS2) of DIC and representative chromatogram for standard mixtures containing DIC (400 ng mL−1) and torsemide (IS).
3.4.2. Linearity. Under the optimum chromatographic and mass spectrometric conditions linearity in methanol and spiked plasma were evaluated separately by analyzing nine different concentrations of each compound in triplicates. Linear relationship between the peak area ratios of each analyte/IS and their corresponding concentrations was established. The calibration curves were linear in the studied range, Table 2 shows the prepared calibration standards and QC samples with the final concentration ranges. The calibration curve equation is ‘y = bx + c’, where, ‘y’ represents analyte/IS peak area ratio, ‘x’ represents the analyte concentration in ng mL−1, ‘b’ and ‘c’ are the slope and intercept, respectively. The obtained slope, intercept and correlation coefficient values for each compound in methanol and in plasma are presented in Tables 4 & 5, respectively. The LLOQ for each compound in plasma was calculated and presented Table 5.
Table 4 Regression and validation parameters of the five compounds in methanol
Parameter B1 B6 B12 BEN DIC
Linearity range (ng mL−1) 0.01–20.00 0.02–50.00 15.00–500.00 5.00–500.00 10.00–500.00
Slope 0.501891 0.098410 0.002023 0.002373 0.01018
Intercept 0.004816 0.091946 −0.00518 −0.00139 −0.02767
Correlation coefficient 0.9996 0.9999 0.9999 0.9998 0.9995
[thin space (1/6-em)]
Accuracy
Bias 0.323 −0.223 −1.275 1.488 −0.675
RSD% 1.461 1.084 0.671 0.327 0.882
[thin space (1/6-em)]
Precision (RSD%)
Intraday 0.733 1.076 0.971 0.789 0.790
Interday 0.871 0.982 0.891 1.001 0.831
Robustness (RSD%) 1.049 1.168 1.003 0.656 0.993
% Stability (24 h) 99.10 100.13 100.23 99.94 99.43


Table 5 Parameters of the obtained calibration curves and LLOQ for each of the five compoundsa
Compound Slope Intercept Correlation coefficient (r) LLOQ (ng mL−1)
a The calculated slope, intercept and correlation coefficients are the average of 6 calibration curves.
B1 0.521365 0.009154 0.9976 0.01
B6 0.14912 0.119371 0.9984 0.02
B12 0.001952 −0.00625 0.9996 15.00
BEN 0.002731 −0.00022 0.9983 5.00
DIC 0.011847 −0.4676 0.9946 10.00


3.4.3. Precision and accuracy. Precision and accuracy were assessed for both solutions prepared in methanol and spiked plasma, the relative standard deviation, was 4.36, 7.24, 4.54, 6.18 and 4.63% at LLOQ for the five analytes in order, the intraday and interday precision and accuracy results in methanol Table 4 and in spiked plasma at both QCL and QCH levels (Tables 6 & 7) are presented.
Table 6 Intra-assay precision and accuracy
Component Concentration (ng mL−1)
Added Obtained Bias (%) RSD (%)
B1 0.03 0.028 −6.66 0.981
16.00 16.00 0.02 0.733
B6 0.06 0.06 0.02 1.087
40.00 38.99 −2.53 0.834
B12 45.00 45.01 0.02 0.712
400.00 400.79 0.20 0.972
BEN 15.0 15.03 0.20 0.879
400.00 403.34 0.836 0.789
DIC 30.00 29.01 −3.30 1.004
400.00 397.30 −0.68 0.781


Table 7 Inter-assay precision and accuracy
Component Concentration (ng mL−1)
Added Obtained Bias (%) RSD (%)
B1 0.03 0.028 −3.94 7.41
16.00 14.72 −7.99 4.68
B6 0.06 0.062 2.88 5.02
40.00 36.69 −8.28 1.52
B12 45.00 42.46 −5.64 3.93
400.00 353.71 −11.57 3.57
BEN 15.00 13.24 −11.74 3.81
400.00 364.81 −8.98 4.79
DIC 30.00 29.13 −2.92 2.56
400.00 446.97 11.74 1.45


3.4.4. Robustness of the method. The robustness of the method was verified by the uniformity of the peak area ratios of the analytes/IS with the intentional minor changes performed in the mass spectrometric parameters and chromatographic conditions, e.g. sheath gas flow (±5 psi), the capillary temperature or turbo ion spray temperature (±5 °C), collision energy (±5 V) and the flow rate (±10 mL).
3.4.5. Extraction recovery. The mean extraction recovery for the analyzed compounds from spiked plasma was calculated at both low and high QC levels. It varied from 93.89 to 99.56%, 92.32 to 95.89%, 93.24 to 96.10%, 93.78 to 94.76% and 96.56 to 98.91% for B1, B6, B12, BEN and DIC, respectively. The mean extraction recovery for IS was calculated and found to be 98.50%, respectively.
3.4.6. Matrix effects. The effect of plasma constituents over the ionization of analytes and IS was determined by comparing the responses of the post extracted plasma standard QC samples (n = 4) with the response of analytes from neat samples at equivalent concentrations. The relative standard deviation of peak area ratios (analyte/IS), was lower than 2% and the relative standard deviation of peak areas of individual compounds was lower than 4%, indicating no significant matrix effects.
3.4.7. Sample stability. It was assessed for both solutions prepared in methanol and spiked plasma samples. The samples prepared in methanol showed good stability within 24 h, the expected time till complete analysis of the dosage form solutions, Table 4. On the other hand; bioanalytical method validation requires the study of the sample stability under different conditions. All stability parameters were tested for spiked plasma samples and the results are shown in Table 8.
Table 8 Stability of B1, B6, B12, BEN and DIC in matrix by the proposed method
Parameter Stability (%)
B1 B6 B12 BEN DIC
(a) Short term stability of analyte in matrix at room temperature
QCL 98.80 105.05 97.58 98.80 98.37
QCH 100.14 100.54 100.76 100.14 98.76
[thin space (1/6-em)]
(b) Post preparative stability
QCL 95.89 94.97 100.74 98.91 98.04
QCH 97.90 99.14 96.59 96.83 97.66
[thin space (1/6-em)]
(c) Long term stability of analyte in matrix at −80°C
QCL 98.80 105.05 97.57 98.80 98.37
QCH 100.14 100.54 100.76 100.14 98.76
[thin space (1/6-em)]
(d) Freeze and thaw stability
QCL 93.38 95.90 97.06 98.31 96.84
QCH 95.78 96.23 98.23 97.99 97.90


Short-term stability. The short term stability of analytes in plasma samples (with a low and high quality control samples) was studied for period of 24 h at room temperature (25 °C) and ambient light. The results are shown in Table 8, where the samples were stable under the studied conditions.
Post-preparative stability. Three sets of spiked samples with low and high concentrations of the three analytes were analyzed and left in the autosampler at 25 °C for one day. The samples were analyzed using a freshly prepared calibration samples. The processed samples were stable at room temperature for this period. The results are shown in Table 8.
Long-term stability. The long-term stability of frozen plasma samples was examined after 6 weeks storage at −80 °C. The samples were stable under studied conditions and the results are shown in Table 8.
Freeze and thaw stability. Plasma samples with low, medium and high concentrations of the three analytes were prepared. The samples were stored at −20 °C and subjected for 3 freeze/thaw cycles. During each cycle triplicate 1.0 mL aliquots was processed, analyzed and the results averaged. No significant substance loss during repeated thawing and freezing was observed as shown in Table 8.

3.5. Application to pharmaceutical preparations

The proposed method was effectively applied for the analysis of the studied compounds in were analyzed in Milga® tablets and Arthineur® capsules in order to show the capability of the proposed LC-MS method for quality control and routine analysis of the studied drugs in their dosage forms. The concentrations of the drugs were calculated referring to the corresponding regression equation of the calibrations curve constructed using the response of the solutions prepared in methanol. The mean percentage recoveries for the proposed LC-MS/MS method are presented in Table 9.
Table 9 Determination of the studied compounds in tablets and capsules
Dosage form Found (mean ± SD)
B1 B6 B12 BEN DIC
a Labeled to contain 72.7, 0.25 and 40 mg per tablet of B6, B12 and BEN.b Labeled to contain 50, 50, 0.25 and 50 mg per tablet of each of B1, B6, B12 and DIC.
Milga® tablets (batch no. 412857)a 100.51 ± 0.85 99.91 ± 1.84 101.98 ± 1.43
Arthineur® capsules (batch no. 14741C)b 99.94 ± 1.54 101.8 ± 0.94 98.98 ± 1.32 100.96 ± 0.98


4. Conclusion

A sensitive, simple and specific LC-MS/MS method was developed for the simultaneous determination of multivitamins and diclofenac in tablets and capsules and in spiked human plasma. The proposed method has proved to be of high sensitivity with LLOQ of 0.01, 0.02, 15.00, 5.00 and 10.00 ng mL−1 for B1, B6, B12, BEN and DIC, respectively. The method was validated in accordance with both ICH guidelines and industrial bioanalytical guidance. The results gained from the validation study have confirmed that the developed method is sensitive, selective, linear, precise and accurate. Based on all previous advantages and results the developed method can be conveniently used by quality control laboratories.

References

  1. R. R. Eitenmiller, Y. Lin and W. O. Landen, Vitamin Analysis for the Health and Food Sciences, Boca Raton, CRC Press, 1999 Search PubMed .
  2. Martindale: The Extra Pharmacopoeia, ed. W. Martindale and J. E. F. Reynolds, Royal Pharmaceutical Society, London, 31st edn, 1997 Search PubMed.
  3. AMA Division of Drugs in cooperation with the American Society for Clinical Pharmacology and Therapeutics, American Medical Association (AMA) Drug Evaluations, Chicago, 5th edn, 1983 Search PubMed.
  4. R. Strohecker and H. M. Henning, Vitamin Assay Tested Methods, VerlagChemie, Limburg, 1965 Search PubMed .
  5. The United States Pharmacopoeia, U.S. Pharmacopoeial Convention, Inc., Rockville, MD, 24th revision, 2004 Search PubMed.
  6. C. K. Markopoulou, K. A. Kagkadis and J. E. Koundourellis, J. Pharm. Biomed. Anal., 2002, 30, 1403–1410 CrossRef CAS PubMed .
  7. M. M. Sena, Z. F. Chaudhry, C. H. Collins and R. J. Poppi, J. Pharm. Biomed. Anal., 2004, 36(4), 743–749 CrossRef CAS PubMed .
  8. Official Methods of Analysis (OMA), Association of Official Analytical Chemists, Washington DC, 13th edn, 1980 Search PubMed.
  9. G. Dinelli and A. Bonetti, Electrophoresis, 1994, 15, 1147–1150 CrossRef CAS PubMed .
  10. D. Lambert, C. Adjalla, F. Felden, S. Benhayoun, J. P. Nicholas and J. L. Gueant, J. Chromatogr., 1992, 608, 311–315 CrossRef CAS .
  11. L. Fotsing, M. Fillet, I. Bechet, Ph. Hubert and J. Crommen, J. Pharm. Biomed. Anal., 1997, 15, 1113–1123 CrossRef CAS PubMed .
  12. A. P. De Leenheer, W. E. Lambert and H. Nelis, Modern Chromatographic Analysis of Vitamins – Chromatographic Science Series, New York, Marcel Dekker, 1992, p. 12 Search PubMed .
  13. D. C. Woollard, J. Chromatogr., 1984, 301, 470–476 CrossRef CAS PubMed .
  14. P. F. Chatzimichalakis, V. F. Samanidou, R. Verpoorte and I. N. Papadoyannis, J. Sep. Sci., 2004, 27, 1181–1188 CrossRef CAS PubMed .
  15. H. Iwase, J. Chromatogr. A, 1992, 590, 359–363 CrossRef CAS PubMed .
  16. K. Shinomiya, K. Yoshida and Y. Kabasawa, J. Liq. Chromatogr. Relat. Technol., 2001, 24, 2615–2623 CrossRef CAS .
  17. P. Moreno and V. Salvado, J. Chromatogr. A, 2000, 870, 207–215 CrossRef CAS PubMed .
  18. U. Hoeller, C. Brodhag, A. Knoebel, P. Hofmann and V. Spitzer, J. Pharm. Biomed. Anal., 2003, 31, 151–158 CrossRef .
  19. P. Wimalasiri and R. B. H. Wills, J. Chromatogr., 1985, 318, 412–416 CrossRef CAS PubMed .
  20. E. Dinc, G. Kokdil and F. A. Onur, J. Pharm. Biomed. Anal., 2000, 22, 915–923 CrossRef CAS .
  21. S. Poongothai, R. Ilavarasan and C. M. Karrunakaran, Int. J. Pharm. Pharm. Sci., 2010, 2(4), 133–139 CAS .
  22. M. L. Orr, Pantothenic acid, Vitamin B6 and Vitamin B12 in Foods, Home Economics-US Department of Agricultural Bulletin, research report no. 36, Washington DC, 1969 Search PubMed .
  23. E. Wang and W. Hou, J. Chromatogr., 1988, 447, 256–262 CrossRef CAS .
  24. K. Chu and K. Tin, Anal. Lett., 1998, 31, 2707–2715 CrossRef CAS .
  25. M. A. Hegazy, N. S. Abdelwahab and A. S. Fayed, Spectrochim. Acta, 2015, 140, 524–533 CrossRef CAS PubMed .
  26. LC-tandem MS/MS method for simultaneous quantification of multicomponent mixture of vitamins B1, B6, B12, benfotiamine and diclofenac in pharmaceutical formulations and human plasma, Under publication.
  27. ICH Harmonized Tripartite Guideline, Validation of Analytical Procedures: Text and Methodology, Q2(R1), Current step 4 version, Parent guidelines on Methodology, 1996, Incorporated in November 2005.
  28. FDA, Guidance for industry: bioanalytical method validation, US Department of Health and Human Services, Food and Drug Administration, Center for Drug Evaluation and Research (CDER), Center for Veterinary Medicine (CV), 2001 Search PubMed .
  29. S. Mohsin, M. Zumwalt and I. Singh, Agilent Technologies, Inc., 2008, printed in the USA August 28, 2008, 5989–7084EN.

Footnote

Electronic supplementary information (ESI) available. See DOI: 10.1039/c6ra03867k

This journal is © The Royal Society of Chemistry 2016
Click here to see how this site uses Cookies. View our privacy policy here.