DOI:
10.1039/C6RA03818B
(Paper)
RSC Adv., 2016,
6, 31422-31430
Catalytic oxidation of NO by O2 over CeO2–MnOx: SO2 poisoning mechanism
Received
11th February 2016
, Accepted 8th March 2016
First published on 10th March 2016
Abstract
The catalytic oxidation of NO by O2 was performed over a series of CeO2–MnOx catalysts with different molar ratios of Mn/Ce, which were prepared by the sol–gel method. The highest NO conversion efficiency reached 96% over the catalyst with a 0.4 Mn doping value at 238 °C. The possible reaction pathways of the catalytic oxidation process were proposed according to several characterization measurements. NO was adsorbed on the catalyst surface to form nitrates and then decomposed into NO2. However, the catalyst was completely deactivated under an atmosphere of SO2. NO conversion efficiency dramatically declined from 92% to 22% within only 400 min. Comparing the BET, TPR, TPD, XRD, XPS, FTIR, and TGA results of fresh and poisoned catalysts, the catalyst deactivation could be mainly attributed to manganese sulfate formation on the catalyst surface, which could only slightly decompose. The active sites for NO adsorption were occupied. Finally, the oxidation of NO to NO2 was terminated due to lack of nitrates, which are intermediates for NO oxidation.
1. Introduction
Nitrogen oxides, particularly NO, are major pollutants that exist in coal-fired flue gas; they are mainly removed by direct reduction technology, including selective catalytic reduction (SCR)1 and selective non-catalytic reduction (SNCR).2 Recently, the oxidation method,3–7 which converts the insoluble NO into highly soluble NO2, NO3, and N2O5 which then can be eliminated by wet flue gas desulfurization (WFGD)3,8,9 together with sulfur dioxide, has been proposed. For the purpose of oxidation, plasma treatment,3,4 injection of oxidants,6–8 and catalytic oxidation by excessive oxygen10,11 are often adopted. Among these methods, catalytic oxidation, without injection of the other oxidants, is considered to be an effective and economical approach.
Noble metals, typically platinum based catalysts, are known to demonstrate excellent NO oxidation efficiency.12,13 The strong Pt–O bond causes the NO oxidation reaction to be thermodynamically endothermic on the catalyst surface.14 In order to weaken the Pt–O bond and enhance the adsorption ability of nitrogen oxides, doping with transition metals is often required.15 Meanwhile, the usage of noble metals is restricted by their high cost. However, transition metals present excellent redox abilities themselves and are more economical. Cerium and manganese oxides have shown especially good activity for SCR at low temperature.16,17 Ceria (CeO2), an abundant and inexpensive metal oxide, has been applied extensively as a catalyst carrier for its capacity to enhance and stabilize the dispersion of other metal oxides.18,19 It also has excellent oxygen storage capacity and redox properties. Ceria is an oxygen reservoir, which can form large amounts of labile oxygen vacancies and oxygen species during the redox shift between Ce4+ and Ce3+ under oxidative and reductive conditions.20,21 Manganese oxides have strong dynamic oxygen storage capacity and excellent redox properties; they are active and stable catalysts for catalytic oxidation.22,23 Above all, ceria doped with manganese oxides was carefully selected as the catalyst for its potential catalytic oxidation ability for multi-pollutant removal.
Sulfur deactivation is one of the most significant factors restricting the application of the catalytic oxidation method. The deactivation mechanism of low temperature SCR has been investigated in recent studies.24–26 The transition metal oxide deactivation process was mainly attributed to three aspects: (1) sulfates formed on the catalyst surface occupy the active sites; (2) reduction of metal oxides inhibits the redox shift; (3) the reduced acid sites prevent NH3 adsorption. However, few studies have focused on the catalytic oxidation of NO. SCR occurs in a reductive atmosphere, while catalytic oxidation occurs in an oxidative atmosphere, so the deactivation mechanisms are expected to be different. Therefore, it is essential to investigate the mechanism of the effect of SO2 on catalytic oxidation activity separately, which will be helpful to understand the deactivation mechanism and thus improve the resistance to SO2. Therefore, a series of CeO2–MnOx catalysts with different Mn/Ce molar ratios were prepared and the optimal catalyst was used to carry out SO2 poisoning tests. Accordingly, several characterization methods, including BET, X-ray diffraction (XRD), H2-temperature programmed reduction (H2-TPR), NO-temperature programmed desorption (NO-TPD), X-ray photoelectron spectroscopy (XPS), Fourier transform infrared spectroscopy (FT-IR), and thermogravimetric analysis (TGA), were carried out to study the sulfated catalyst.
2. Experimental section
2.1 Catalyst preparation
Catalysts were prepared through a sol–gel method.27 Nitrate salts of Ce and Mn were dissolved in deionized water. The mole ratios of Mn/Ce used were 0, 0.2, 0.4, 0.6, and 0.8. Citrate was added to the solution to promote gel formation. The mole ratio of citrate to the nitrate salts was 2
:
1. All reagents were of analytical grade and were purchased from Sinopharm Chemical Reagent Co., Ltd. The mixture was stirred at 80 °C until a gel formed and then dried in an oven at 110 °C for 12 h. The dried gel was calcined at 500 °C for 3 h under air atmosphere in a muffle furnace. The obtained solid product was sieved in a 50-mesh sieve.
2.2 Catalyst characterization
For each catalyst sample, detailed characterization was performed through specific surface area and pore structure measurement, H2-TPR, XRD, NO-TPD, XPS, FT-IR, and TGA.
Porous structure parameters were measured through N2 adsorption at liquid N2 temperature (77 K) using an automatic surface area and pore size analyzer (Micromeritics ASAP 2010). Prior to the measurements, each sample was degassed at 473 K for 4 h. The specific surface area and average pore diameter were determined by the BET method. The total pore volume was calculated by the single point adsorption of pores less than 180.2005 nm in diameter at P/P0 = 0.99.
H2-TPR measurements using an automatic temperature programmed chemisorption analyzer (Micromeritics AutoChem II 2920) were used to evaluate the reducibility of the metallic ions and the redox ability of the metal oxide catalysts. Prior to the test, 75 mg of each catalyst sample was purged at 120 °C in Ar atmosphere with a flow rate of 50 mL min−1 for 1 h. Finally, the H2 consumption of each sample was obtained by increasing the temperature from 50 °C to 800 °C with a ramp of 10 °C min in 5% H2/Ar atmosphere (20 mL min−1).
XRD patterns of the catalyst samples were recorded on a Rigaku D/max 2550PC diffractometer operating at 40 kV and 40 mA using Cu Kα radiation with a scanning rate of 4° min−1 in the range of 2θ = 20° to 80°.
NO-TPD experiments carried out on the same instrument with H2-TPR were used to evaluate the NO adsorption ability of the catalyst. The NO desorption signal was detected by a Hiden QIC20 mass spectrum instrument. Prior to the test, each sample was exposed at 50 °C in 5 vol% NO/Ar atmosphere with a flow rate of 50 mL min−1 for 1 h, followed by Ar purge for another 30 min. Finally, the NO desorption of each sample was obtained by increasing the temperature from 50 °C to 800 °C with a ramp of 10 °C min−1.
XPS spectra were used to evaluate the element valence and semi-quantitative concentration distribution on the catalyst surface. The spectra were determined using a photoelectron spectrometer (Thermo Scientific Escalab 250Xi) with a standard Al Kα source (1486.6 eV) operating in constant analysis energy (100 eV) mode at a scanning step of 0.1 eV. All binding energies were referenced to the C 1s line at 284.5 eV.
FT-IR spectroscopy was used to detect species generated on the catalyst surface during the catalytic oxidation process with and without SO2. A Nicolet 5700 FTIR spectrometer with 0.09 cm−1 resolution was used to carry out these measurements.
TGA experiments were conducted on a thermogravimetric analyzer (TA-Q500 TGA). 2 mg of each catalyst sample was loaded into the TGA reactor. The temperature of the TGA furnace was increased to 100 °C and kept constant for 10 min to remove adsorbed water. After equilibration at 50 °C for 10 min, the temperature was increased to 850 °C at a rate of 10 °C min−1 under N2 atmosphere. The TGA and DTA (differential thermal analysis) curves were obtained.
2.3 Activity and poisoning tests
Catalytic activity and SO2 poisoning tests were carried out in a quartz tube-bed reactor heated by an electric furnace (Yifeng Furnace Co., Ltd). The reaction temperature was measured by a K-type thermocouple deposed into the catalyst bed. The simulated flue gas, mixed from bottled N2, O2, NO and SO2, was supplied by Jinggong Gas Co., Ltd. (N2 – 99.999%, O2 – 99.999%, NO – 5%/balance N2, SO2 – 5%/balance N2). A gas N2 mixture containing 300 ppm NO and 10% O2 was injected into the reactor separately to prevent the oxidation reaction in the absence of catalyst. 100 ppm SO2 was injected into the reactor at 210 °C with the same stream of N2/NO during the poisoning tests. The total gas flow rate was 1 L min−1 and was controlled by mass flow controllers (MFC, Alicat Scientific Inc., America); the powder catalyst dosage was 3 g. The corresponding gas hourly space velocity (GHSV) was 20
000 h−1. The concentrations of NO, NO2, and SO2 in the initial and outlet gas at the steady-state condition were measured by a Fourier transform infrared gas analyzer (Gasmet FTIR DX4000, Finland). The NO conversion efficiency was calculated by eqn (1): |
[Conv.]NO = [NO2]out /([NO]out + [NO2]out) × 100%
| (1) |
where [Conv.]NO is the NO conversion efficiency, [NO2]out is the outlet NO2 concentration of the reactor, and [NO]out is the outlet NO concentration of the reactor.
3. Results and discussion
3.1 Catalytic activity of CeO2–MnOx
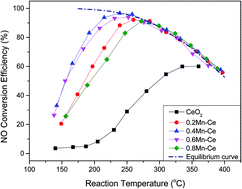
The catalytic activities of catalysts with different molar ratios of Mn/Ce are presented in Fig. 1. Only about 60% NO conversion efficiency is achieved with pure CeO2 (Mn/Ce = 0) at 330 °C. When Mn is doped, the catalytic activities are distinctly improved. The NO conversion efficiency initially increases and then decreases with increasing Mn doping level. NO conversion efficiency increases with reaction temperature and then decreases with the thermodynamic equilibrium curve, given as a dotted line. It is obvious that the optimal molar ratio of Mn/Ce is 0.4, which displays excellent low temperature catalytic oxidation activity. The highest NO conversion efficiency is nearly 96% at 238 °C, and more than 60% can be achieved at 160 °C.
 |
| Fig. 1 NO conversion efficiencies of catalysts calcined at 500 °C with different molar ratios of Mn/Ce. | |
The BET surface areas, total pore volumes, and average pore diameters of catalysts with different molar ratios of Mn/Ce are summarized in Table 1. It can be seen that the BET surface area decreases from 48.6 m2 g−1 to 29.9 m2 g−1 and the average pore diameter increases from 4.1 nm to 12.0 nm with increasing Mn doping level. Meanwhile, the total pore volume changes very little. This illustrates that the doping process results in a decline in the number of pores and then in a decrease of the surface area.
Table 1 Porous structure parameters and lattice constants of catalystsa
Sample |
BET surface area (m2 g−1) |
Total pore volume (mL g−1) |
Average pore diameter (nm) |
Lattice constants (Å) |
The lattice constants are calculated by the Jade program based on the CeO2 (111) crystal plane according to the XRD data. |
CeO2 |
48.6 |
0.05 |
4.1 |
5.4202 |
0.2Mn–Ce |
46.7 |
0.08 |
6.9 |
5.4091 |
0.4Mn–Ce |
39.8 |
0.07 |
7.1 |
5.4052 |
0.6Mn–Ce |
32.8 |
0.09 |
10.9 |
5.3970 |
0.8Mn–Ce |
29.9 |
0.09 |
12.0 |
5.3904 |
0.4Mn–Ce-sulfated |
16.1 |
0.06 |
14.9 |
5.4031 |
Fig. 2 shows the H2-TPR profiles for all the catalysts. The reduction peaks of pure CeO2 (Mn/Ce = 0) at 450 °C and 750 °C are associated with the reduction of superficial Ce4+ ions and bulk lattice oxygen, respectively.28,29 Meanwhile, these two peaks are very weak compared with those of the other Mn doped samples. The reduction peaks of the Mn doped samples at lower temperature can be mainly attributed to the two step reduction, including Mn2O3 to Mn3O4 at 200 to 220 °C and Mn3O4 to MnO at 310 to 342 °C.30,31 Of course, the reduction of highly dispersed manganese oxide species strongly interacting with the ceria surface also makes contributions to these two reduction peaks. While the peak at higher temperature, similar to the peak of ceria, can be attributed to the reduction of MnOx species with larger particles or intermediates as well as the reduction of the bulk lattice oxygen of CeO2.32 The excellent low temperature catalytic activity of the Mn doped samples is demonstrated by the higher peak height and larger peak area compared to pure ceria. By comparison, the peak height and area increase significantly when the molar ratio of Mn/Ce increases from 0.2 to 0.4, and they are similar for the molar ratios of 0.4, 0.6, and 0.8. However, the reduction peak shifts to a higher temperature when the molar ratio increases from 0.6 to 0.8. As a result, the samples with 0.4 and 0.6 molar ratios displayed the best redox ability, which is in agreement with the activity test results shown in Fig. 1.
 |
| Fig. 2 H2-TPR profiles for catalysts with different Mn doping proportions. | |
The XRD patterns of the catalysts with various molar ratios of Mn/Ce are shown in Fig. 3. Five diffraction peaks appear on all five catalyst samples, with diffraction angles located at 28.5°, 33.1°, 47.4°, 56.4°, and 59.2°. The diffraction angles are consistent with the fluorite structure of cubic CeO2 (111), (200), (220), (311), and (222). This reveals that the framework of CeO2 has not been changed by the doping of manganese oxides,17,32 and the manganese oxides have been highly dispersed on the CeO2 substrate. Meanwhile, Machida et al.33 considered that Ce4+ might be substituted by Mn3+ in the fluorite structure due to their structural similarity. The smaller ionic radius of Mn3+ ion (0.066 nm) compared to Ce4+ ion (0.1098 nm) leads to the incorporation of Mn3+ into the fluorite lattice of CeO2,34 followed by the shrinkage of the crystal cell of CeO2. This gives rise to a decrease in the lattice constant of CeO2 when Mn is doped and a slight decline with increasing Mn doping level, which is shown in Table 1. This is evidenced by the fact that the main diffraction peaks of CeO2 shift to slightly higher Bragg angle values and become shorter and broader with increasing Mn doping level.
 |
| Fig. 3 XRD characterization for catalysts with different Mn doping proportions: (a) whole patterns and (b) enlarged-zone patterns. | |
3.2 SO2 poisoning process
In order to investigate the SO2 poisoning process during catalytic oxidation of NO, the catalyst with a 0.4 molar ratio of Mn/Ce was tested, and the results are shown in Fig. 4. The NO conversion efficiency remains stable at about 92% for 60 min before SO2 is injected. When SO2 is added to the simulated gas, the NO conversion efficiency decreases gradually with reaction time. After 400 min injection, the SO2 gas is stopped, and the conversion efficiency decreases from 92% to 22%. SO2 leads to severe deactivation of the catalyst for NO oxidation. The SO2 concentration in the outlet gas is also shown. No increase can be observed in the first 100 min, which can be attributed to the adsorption on the catalyst. After that, SO2 concentration increases with reaction time. When SO2 is stopped, the conversion efficiency remains stable and no recovery can be observed. This illustrates that the catalyst deactivation is an irreversible process. After this test, the sulfated catalyst that was exposed to the atmosphere of SO2, NO, and O2 for 400 min at 210 °C was measured by a series of characterization measurements to reveal the poisoning mechanism.
 |
| Fig. 4 NO conversion efficiency on CeO2–MnOx catalyst under 100 ppm SO2 atmosphere (molar ratio of Mn/Ce: 0.4, reaction temperature: 210 °C). | |
3.3 Characterization of poisoning catalyst
3.3.1 BET. As is shown in Table 1, the surface area decreases from 39.8 m2 g−1 to 16.1 m2 g−1, and the average pore diameter increases from 7.1 nm to 14.9 nm when the catalyst is sulfated. Meanwhile, there is no obvious change for the total pore volume. This illustrates that the pore numbers on the catalyst surface decrease during the poisoning process, which then results in a decrease in the catalyst activity.
3.3.2 TPR. Compared with fresh catalyst in Fig. 5, the reduction peaks at 209 °C, 310 °C, and 750 °C cannot be observed for the sulfated catalyst. Meanwhile, a strong reduction peak appears at 480 °C, which can be attributed to the reduction of SO42−.35 Combined with the above TPR analysis, the disappearance of these three peaks demonstrates that the manganese oxides on catalyst surface are replaced by manganese sulfate; the bulk lattice oxygen is also substituted by other species, which will be revealed by other characterization measurements.
 |
| Fig. 5 H2-TPR profiles of fresh and sulfated catalyst: the sulfated catalyst was measured after the poisoning test, where it was exposed to SO2 + NO + O2 for 400 min at 210 °C. The following figures are the same. | |
3.3.3 NO-TPD. The intensity of the NO desorption on the sulfated catalyst was much weaker than that on fresh catalyst, as shown in Fig. 6. This illustrates that the NO adsorption ability was largely restrained after the poisoning process. The NO adsorbed on the catalyst surface exists in the form of nitrate species, which are coordinated by its oxygen atoms. The oxygen atoms used to bridge NO are covered by SO42− after sulfuration. This can also be related to the decrease of NO adsorption ability over the sulfated catalyst.
 |
| Fig. 6 NO-TPD profiles of fresh and sulfated catalyst. | |
3.3.4 XRD. As is shown in Fig. 7, the XRD patterns after sulfuration show few changes compared with fresh catalyst, which suggests that sulfuration does not destroy the fluorite structure of CeO2–MnOx. According to the above results, SO42− is indeed formed on the sulfated catalyst. It is reasonable to conclude that manganese sulphates are preferentially formed instead of cerium sulphates. Previous studies have also indicated that manganese oxides can protect ceria from sulfur poisoning.36,37
 |
| Fig. 7 XRD patterns of fresh and sulfated catalyst. | |
3.3.5 XPS. The XPS spectra of the catalysts were investigated and are shown in Fig. 8. Detailed spectra were recorded for the Ce 3d, Mn 2p, and O 1s regions. The characteristic peaks of Ce 3d shown in Fig. 8(a) are composed of two types, named as v, corresponding to the 3d5/2 states, and u, corresponding to the 3d3/2 states, respectively. As is listed in Table 2, the v, v′′, and v′′′ peaks and u, u′′, and u′′′ peaks are attributed to the Ce4+ species.38 Moreover, the v′ and u′ peaks actually represent Ce3+ components.39,40 This suggests that Ce4+ and Ce3+ coexist on the catalyst surface. The mole ratios of Ce4+/(Ce4+ + Ce3+) for fresh and sulfated catalyst calculated from the XPS spectra are 0.79 and 0.75, respectively. The weak decrease in the Ce4+ proportion can be ascribed to the reduction of Ce4+ to Ce3+ as a result of exposure to SO2.
 |
| Fig. 8 XPS spectra of fresh and sulfated catalyst over the spectral regions of Ce 3d, Mn 2p, and O 1s. | |
Table 2 The Ce 3d binding energies (eV) and valence compositions on fresh and sulfated catalyst
Name |
v |
v′ |
v′′ |
v′′′ |
u |
u′ |
u′′ |
u′′′ |
Ce4+/Ce |
Fresh |
882.3 |
883.9 |
888.7 |
898.3 |
900.8 |
902.2 |
907.5 |
916.8 |
0.79 |
Sulfated |
882.4 |
883.6 |
888.9 |
898.4 |
900.9 |
902.4 |
907.5 |
916.9 |
0.75 |
Fig. 8(b) shows the photoelectron spectra of the Mn 2p region of the catalysts. The region is composed of a spin orbit doublet with Mn 2p3/2 with a binding energy of 642 eV and Mn 2p1/2 observed at 653 eV, corresponding to a coexisting valence state of Mn4+ and Mn3+. The Mn 2p3/2 region can be decomposed into several components by peak-fit processing. Two peaks are assigned to Mn3+ (ref. 41 and 42) and Mn4+ (ref. 41 and 43) for the fresh catalyst, whereas a new peak corresponding to Mn2+ (ref. 44) appears for the sulfated catalyst. The binding energies are all listed in Table 3. The strong interaction between manganese and cerium oxides leads to some differences of the binding energies existing between these catalysts and pure MnO, Mn2O3, and MnO2.44,45 After sulfuration, the proportion of Mn4+ and Mn3+ listed in Table 3 certainly decreases and is transformed into Mn2+ according to eqn (2) and (3). Furthermore, the binding energies of Mn4+ and Mn3+ shift to higher values after sulfuration, which may be related to the formation of sulfates on the catalyst surface.
|
2Mn2O3 + 4SO2 + O2 → 4MnSO4
| (3) |
Table 3 The Mn 2p3/2 binding energies (eV) and valence compositions on fresh and sulfated catalyst
Name |
Mn2+ |
Mn3+ |
Mn4+ |
Mn2+/Mn |
Mn3+/Mn |
Mn4+/Mn |
Fresh |
— |
641.6 |
643.8 |
0 |
0.67 |
0.33 |
Sulfated |
640.8 |
641.9 |
644.5 |
0.10 |
0.60 |
0.30 |
The O 1s spectra of fresh and sulfated catalysts are illustrated in Fig. 8(c). The O 1s spectra are asymmetric and complicated due to the interaction between the oxygen species of manganese and cerium oxides. The spectra are decomposed to lattice oxygen Oα, chemisorbed oxygen Oβ, and adsorbed OH groups Oγ.31,46,47 The binding energies and distribution of oxygen species concentrations are all listed in Table 4. The weak increase of the adsorbed OH groups might be assigned to the hydrolyzation of sulfates formed on the catalyst surface.48 It can be observed that the Oβ proportion increases distinctly after sulfuration. This can be attributed to three aspects: (1) SO2 consumes some highly ionized lattice oxygen of the metal oxides during the poisoning process, and sulfates accumulate on the catalyst surface. The oxygen species in the sulfates (S
O) can be assigned to chemisorbed oxygen. (2) The sulfate formation causes unbalanced electronic distribution on the catalyst surface and then generates more vacancies to adsorb the oxygen species.48 (3) The Ce3+ ions are beneficial to create charge imbalance, labile oxygen vacancies, and unsaturated chemical bonds on the catalyst surface,49,50 which generates more chemisorbed oxygen on the catalyst surface. Therefore, the slight increase of Ce3+ described above facilitates the increase of chemisorbed oxygen. Generally, the chemisorbed oxygen is often considered to be the most active oxygen species and to be beneficial in most of the catalytic oxidation reactions,51,52 including the oxidation of NO to NO2.10,20 However, the biggest contribution to the increase of chemisorbed oxygen is sulfate formation, which cannot enhance the catalytic activity.
Table 4 The binding energies (eV) and distribution of oxygen species on fresh and sulfated catalyst
Name |
Oα (lattice oxygen) |
Oβ (chemisorbed oxygen) |
Oγ (adsorbed OH groups) |
Oα/O |
Oβ/O |
Oγ/O |
Fresh |
529.2 |
531.1 |
533.5 |
0.67 |
0.31 |
0.02 |
Sulfated |
529.4 |
531.4 |
533.3 |
0.55 |
0.41 |
0.04 |
3.3.6 FT-IR. FT-IR analysis was carried out to investigate the diversification in the surface adsorbed species after sulfuration. Infrared spectra of the fresh, used, and sulfated catalyst covering the range of 875 to 2000 cm−1 are recorded in Fig. 9. For the fresh catalyst, the bands at 1048, 1121, 1395, and 1614 cm−1 can be assigned to incompletely decomposed nitrate species on manganese and cerium oxides.17,53 The used catalyst was tested after exposure to an atmosphere of NO and O2 for 400 min at 210 °C. Compared with the weak band at 1395 cm−1 for the fresh catalyst, the used catalyst displays a stronger band at 1386 cm−1, corresponding to free nitrates.54,55 It can be speculated that these nitrates are the intermediates in NO oxidation to NO2. Firstly, NO is adsorbed on surface active sites of the catalyst to form nitrosyls. Then the unstable nitrosyls are oxidized into nitrates by lattice oxygen and finally decomposed into NO2. After sulfuration, the band that represents the free nitrates shifts to 1417 cm−1, and the absorbance decreases. This illustrates that the exposure to SO2 inhibits the formation of nitrates on the catalyst surface, and the catalytic reaction will be restrained due to a lack of intermediates. Furthermore, two stronger bands at 1045 and 1133 cm−1 can be observed after sulfuration. These bands can be assigned to either surface or bulk sulfates.56,57 These sulfates can be partly attributed to reactions (1) and (2), as shown before. Meanwhile, SO2 oxidation to SO3 according to eqn (4) and (5) might be promoted. The active sites that are used for adsorbing nitrogen oxides and intermediates of NO oxidation to NO2 are occupied by sulfur oxides and sulfates. Therefore, the catalytic activity of NO oxidation decreases continuously after exposure to SO2.
 |
| Fig. 9 FT-IR spectra of fresh, used and sulfated catalyst: the used catalyst was measured after exposure to NO + O2 for 400 min at 210 °C. | |
3.3.7 TGA. In order to evaluate the thermal stability of the fresh catalyst and investigate the sulfate decomposition temperature of the sulfated catalyst, thermogravimetric analysis (TGA) was performed, and the results are shown in Fig. 10. The weight loss of fresh catalyst is only less than 3.0% after thermal treatment, suggesting good thermal stability. The derivative DTA curve displays two peaks at 200 °C and 720 °C, respectively. Because water adsorbed on the sample catalyst was removed, the first weight loss peak should be attributed to the decomposition of residual nitrates on the metal oxides. The second peak can be assigned to the phase transitions of metal oxides.58 For the sulfated catalyst, the weight loss is slightly larger than that of the fresh catalyst after thermal treatment. However, the weight loss at a higher temperature region, corresponding to the sulfate decomposition,59,60 occupies about 73% of the total weight loss. It can be concluded that regenerating the catalyst by the decomposition of the sulfates on the catalyst surface requires a temperature higher than 700 °C; this process requires further investigation.
 |
| Fig. 10 TGA profiles of fresh and sulfated catalyst. | |
3.4 Poisoning mechanism over CeO2–MnOx
Unlike the reductive atmosphere for SCR,24–26 the SO2 deactivation mechanism for catalytic oxidation of NO occurs in an oxidative atmosphere, and thus is somewhat different. Various kinds of characterization measurements were carried out to obtain the possible reaction pathways of the catalytic oxidation and poisoning process, which has not been studied in previous works. Nitric oxides (NO) are adsorbed on the catalyst surface to form nitrosyls and then oxidize into nitrates by the lattice oxygen, with evidence of the nitrate peak shown in the FTIR spectra for the catalyst after the oxidation reaction. Meanwhile, Ce4+ and Mn4+ are reduced to Ce3+ and Mn3+, respectively. Then nitrates are decomposed into nitrogen dioxides (NO2) and one lattice oxygen is restored. After the nitrogen dioxides dissociate from the catalyst surface, Ce and Mn are returned to their previous valence states by adsorbed oxygen and the original lattice oxygen. The active sites are regained and a new cycle begins. However, when the catalyst is exposed to sulfur dioxide (SO2) atmosphere, the sulfur dioxides occupy the active sites to form sulphites. Sulfates are formed on the catalyst surface, oxidized by the lattice oxygen. Hereafter, some sulfates decompose into sulfur trioxides (SO3) that will desorb from the catalyst surface. The reduced Ce3+ can be oxidized to Ce4+ again by adsorbed oxygen and nitrogen dioxide. As a result, only a slight decrease was observed in the Ce4+ proportion after sulfuration. The undecomposed sulfates are formed on Mn sites based on the XRD and XPS (Mn 2p) results presented. Due to the higher temperature required for the manganese sulfate decomposition shown in the TGA results, the active sites are only slightly regenerated. The active sites are occupied by sulfates so that the catalytic reaction cannot continue. This leads to a lack of nitrates, which are a decisive intermediate for NO oxidation to NO2. The main difference between catalytic oxidation of NO and SCR can be observed: in terms of SCR, the reductive atmosphere could inhibit sulfate formation to some extent, whereas the oxidative atmosphere promotes sulfate formation for catalytic oxidation.
4. Conclusions
CeO2–MnOx mixed oxide catalysts with different molar ratios of Mn/Ce prepared by the sol–gel method were conducted to evaluate the catalytic activity of NO oxidation. The highest NO conversion efficiency of nearly 96% at 238 °C was reached by the catalyst with 0.4 Mn doping value. Physico-chemical characterizations of the catalysts were carried out, coupled with BET, TPR, and XRD.
The SO2 poisoning process was tested with the optimal catalyst at 210 °C. Exposure to SO2 leads to severe catalyst deactivation for NO oxidation. When SO2 is added, NO conversion efficiency decreases from 92% to 22% after 400 min. A series of characterization measurements over the sulfated catalyst were performed to reveal the poisoning mechanism with the help of BET, TPR, TPD, XRD, XPS, FTIR, and TGA. According to the comparison between fresh and sulfated catalyst, the catalyst deactivation could be mainly attributed to manganese sulfate formed on the catalyst surface, which occupies the active sites for NO adsorption. Finally, the catalytic oxidation is inhibited due to the lack of nitrates. Furthermore, the oxidative atmosphere promotes sulfuration of the catalyst.
Acknowledgements
This work was supported by the National Natural Science Foundation of China (51422605), the National Basic Research Program of China (2012CB214906) and the Zhejiang Provincial Natural Science Foundation (LR16E060001).
References
- B. Li, Z. Ren, Z. Ma, X. Huang, F. Liu, X. Zhang and H. Yang, Catal. Sci. Technol., 2016 10.1039/c5cy01430a.
- D. Q. Dao, L. Gasnot, K. Marschallek, A. El Bakali and J. F. Pauwels, Energy Fuels, 2010, 24, 1696–1703 CrossRef CAS.
- S. L. Ding, Q. Yu, Y. Z. Zhang, Y. Liu, C. X. Xie and G. Yu, J. Adv. Oxid. Technol., 2015, 18, 114–122 CAS.
- I. Jogi, E. Stamate, C. Irimiea, M. Schmidt, R. Brandenburg, M. Holub, M. Bonislawski, T. Jakubowski, M. L. Kaariainen and D. C. Cameron, Fuel, 2015, 144, 137–144 CrossRef CAS.
- K. Li, X. L. Tang, H. H. Yi, P. Ning, D. J. Kang and C. Wang, Chem. Eng. J., 2012, 192, 99–104 CrossRef CAS.
- K. Skalska, J. S. Miller and S. Ledakowicz, Chem. Eng. Sci., 2011, 66, 3386–3391 CrossRef CAS.
- Z. H. Wang, J. H. Zhou, Y. Q. Zhu, Z. C. Wen, J. Z. Liu and K. Cen, Fuel Process. Technol., 2007, 88, 817–823 CrossRef CAS.
- Y. S. Mok and H. J. Lee, Fuel Process. Technol., 2006, 87, 591–597 CrossRef CAS.
- Z. H. Wang, X. Zhang, Z. J. Zhou, W. Y. Chen, J. H. Zhou and K. F. Cen, Energy Fuels, 2012, 26, 5583–5589 CrossRef CAS.
- M. Y. Zhang, C. T. Li, L. Qu, M. F. Fu, G. M. Zeng, C. Z. Fan, J. F. Ma and F. M. Zhan, Appl. Surf. Sci., 2014, 300, 58–65 CrossRef CAS.
- Z. Guo, Z.-H. Huang, M. Wang and F. Kang, Catal. Sci. Technol., 2015, 5, 827–829 CAS.
- R. L. Arevalo, K. Oka, H. Nakanishi, H. Kasai, H. Maekawa, K. Osumi and N. Shimazaki, Catal. Sci. Technol., 2015, 5, 882–886 CAS.
- Y. Li, M. Q. Shen, J. Q. Wang, T. M. Wan and J. Wang, Catal. Sci. Technol., 2015, 5, 1731–1740 CAS.
- S. Ovesson, B. I. Lundqvist, W. F. Schneider and A. Bogicevic, Phys. Rev. B: Condens. Matter Mater. Phys., 2005, 71, 1–5 CrossRef.
- M. C. Escano, T. Q. Nguyen, H. Nakanishi and H. Kasai, J. Phys.: Condens. Matter, 2009, 21, 1–6 CrossRef PubMed.
- S. Andreoli, F. A. Deorsola and R. Pirone, Catal. Today, 2015, 253, 199–206 CrossRef CAS.
- G. S. Qi, R. T. Yang and R. Chang, Appl. Catal., B, 2004, 51, 93–106 CrossRef CAS.
- S. Pengpanich, V. Meeyoo, T. Rirksomboon and K. Bunyakiat, Appl. Catal., A, 2002, 234, 221–233 CrossRef CAS.
- A. M. Silva, L. O. O. Costa, A. P. M. G. Barandas, L. E. P. Borges, L. V. Mattos and F. B. Noronha, Catal. Today, 2008, 133, 755–761 CrossRef.
- X. Li, S. Zhang, Y. Jia, X. Liu and Q. Zhong, J. Nat. Gas Chem., 2012, 21, 17–24 CrossRef CAS.
- G. S. Qi and R. T. Yang, J. Catal., 2003, 217, 434–441 CrossRef CAS.
- V. S. Escribano, E. F. Lopez, J. M. Gallardo-Amores, C. D. Martinez, C. Pistarino, M. Panizza, C. Resini and G. Busca, Combust. Flame, 2008, 153, 97–104 CrossRef.
- L. W. Jia, M. Q. Shen, J. J. Hao, T. Rao and J. Wang, J. Alloys Compd., 2008, 454, 321–326 CrossRef CAS.
- B. Q. Jiang, Z. B. Wu, Y. Liu, S. C. Lee and W. K. Ho, J. Phys. Chem. C, 2010, 114, 4961–4965 CAS.
- S. W. Pan, H. C. Luo, L. Li, Z. L. Wei and B. C. Huang, J. Mol. Catal. A: Chem., 2013, 377, 154–161 CrossRef CAS.
- Z. Y. Sheng, Y. F. Hu, J. M. Xue, X. M. Wang and W. P. Liao, J. Rare Earths, 2012, 30, 676–682 CrossRef CAS.
- Z. Wang, F. Lin, S. Jiang, K. Qiu, M. Kuang, R. Whiddon and K. Cen, Fuel, 2016, 166, 352–360 CrossRef CAS.
- B. de Rivas, R. Lopez-Fonseca, M. A. Gutierrez-Ortiz and J. I. Gutierrez-Ortiz, Appl. Catal., B, 2011, 101, 317–325 CrossRef CAS.
- S. Ricote, G. Jacobs, M. Milling, Y. Y. Ji, P. M. Patterson and B. H. Davis, Appl. Catal., A, 2006, 303, 35–47 CrossRef CAS.
- J. Trawczynski, B. Bielak and W. Mista, Appl. Catal., B, 2005, 55, 277–285 CrossRef CAS.
- P. Venkataswamy, K. N. Rao, D. Jampaiah and B. M. Reddy, Appl. Catal., B, 2015, 162, 122–132 CrossRef CAS.
- P. Yang, S. S. Yang, Z. N. Shi, Z. H. Meng and R. X. Zhou, Appl. Catal., B, 2015, 162, 227–235 CrossRef CAS.
- M. Machida, M. Uto, D. Kurogi and T. Kijima, Chem. Mater., 2000, 12, 3158–3164 CrossRef CAS.
- Z. Wang, G. L. Shen, J. Q. Li, H. D. Liu, Q. Wang and Y. F. Chen, Appl. Catal., B, 2013, 138, 253–259 CrossRef.
- S. J. Yang, Y. F. Guo, H. Z. Chang, L. Ma, Y. Peng, Z. Qu, N. Q. Yan, C. Z. Wang and J. H. Li, Appl. Catal., B, 2013, 136, 19–28 CrossRef.
- M. Casapu, O. Krocher and M. Elsener, Appl. Catal., B, 2009, 88, 413–419 CrossRef CAS.
- K. Tikhomirov, O. Krocher, M. Elsener, M. Widmer and A. Wokaun, Appl. Catal., B, 2006, 67, 160–167 CrossRef CAS.
- J. Liu, Z. Zhao, J. Wang, C. Xu, A. Duan, G. Jiang and Q. Yang, Appl. Catal., B, 2008, 84, 185–195 CrossRef CAS.
- M. Y. Smirnov, A. V. Kalinkin, A. V. Pashis, A. M. Sorokin, A. S. Noskov, K. C. Kharas and V. I. Bukhtiyarov, J. Phys. Chem. B, 2005, 109, 11712–11719 CrossRef CAS PubMed.
- X. Y. Wang, Q. Kang and D. Li, Appl. Catal., B, 2009, 86, 166–175 CrossRef CAS.
- M. Kang, E. D. Park, J. M. Kim and J. E. Yie, Appl. Catal., A, 2007, 327, 261–269 CrossRef CAS.
- M. R. Morales, B. P. Barbero and L. E. Cadus, Appl. Catal., B, 2006, 67, 229–236 CrossRef CAS.
- D. Delimaris and T. Ioannides, Appl. Catal., B, 2008, 84, 303–312 CrossRef CAS.
- L. J. Liu, Q. A. Yu, J. Zhu, H. Q. Wan, K. Q. Sun, B. Liu, H. Y. Zhu, F. Gao, L. Dong and Y. Chen, J. Colloid Interface Sci., 2010, 349, 246–255 CrossRef CAS PubMed.
- X. F. Tang, Y. G. Li, X. M. Huang, Y. D. Xu, H. Q. Zhu, J. G. Wang and W. J. Shen, Appl. Catal., B, 2006, 62, 265–273 CrossRef CAS.
- V. P. Santos, M. F. R. Pereira, J. J. M. Orfao and J. L. Figueiredo, Appl. Catal., B, 2010, 99, 353–363 CrossRef CAS.
- C. H. Zhang, C. Wang, W. C. Zhan, Y. L. Guo, Y. Guo, G. Z. Lu, A. Baylet and A. Giroir-Fendler, Appl. Catal., B, 2013, 129, 509–516 CrossRef CAS.
- X. S. Du, X. Gao, L. W. Cui, Y. C. Fu, Z. Y. Luo and K. F. Cen, Fuel, 2012, 92, 49–55 CrossRef CAS.
- B. Guan, H. Lin, L. Zhu and Z. Huang, J. Phys. Chem. C, 2011, 115, 12850–12863 CAS.
- X. Gao, Y. Jiang, Y. Zhong, Z. Y. Luo and K. F. Cen, J. Hazard. Mater., 2010, 174, 734–739 CrossRef CAS PubMed.
- F. Larachi, J. Pierre, A. Adnot and A. Bernis, Appl. Surf. Sci., 2002, 195, 236–250 CrossRef CAS.
- H. L. Li, C. Y. Wu, Y. Li and J. Y. Zhang, Environ. Sci. Technol., 2011, 45, 7394–7400 CrossRef CAS PubMed.
- K. I. Hadjiivanov, Catal. Rev.: Sci. Eng., 2000, 42, 71–144 CAS.
- A. L. Goodman, E. T. Bernard and V. H. Grassian, J. Phys. Chem. A, 2001, 105, 6443–6457 CrossRef CAS.
- M. Kantcheva, J. Catal., 2001, 204, 479–494 CrossRef CAS.
- H. Abdulhamid, E. Fridell, J. Dawody and M. Skoglundh, J. Catal., 2006, 241, 200–210 CrossRef CAS.
- T. Yamaguchi, T. Jin and K. Tanabe, J. Phys. Chem., 1986, 90, 3148–3152 CrossRef CAS.
- J. Cheng, J. Yu, X. Wang, L. Li, J. Li and Z. Hao, Energy Fuels, 2008, 22, 2131–2137 CrossRef CAS.
- D. W. Kwon, K. B. Nam and S. C. Hong, Appl. Catal., B, 2015, 166, 37–44 CrossRef.
- W. S. Kijlstra, M. Biervliet, E. K. Poels and A. Bliek, Appl. Catal., B, 1998, 16, 327–337 CrossRef.
|
This journal is © The Royal Society of Chemistry 2016 |
Click here to see how this site uses Cookies. View our privacy policy here.