DOI:
10.1039/C6RA03762C
(Paper)
RSC Adv., 2016,
6, 61927-61933
Solvothermal synthesis of CuO–MgO nanocomposite particles and their catalytic applications
Received
10th February 2016
, Accepted 21st June 2016
First published on 23rd June 2016
Abstract
CuO–MgO nanocomposites were prepared by a solvothermal procedure. Analysis of the X-ray diffraction patterns of the nanoparticle samples showed the formation of minor second phase CuO in addition to MgO as a major phase. On the other hand, TEM images showed CuO minor phase nanoparticles embedded in the MgO matrix. The catalytic properties of these nanomaterials were then investigated with respect to increase in CuO component in the nanocomposite. Three different catalytic reactions for the treatment of model pollutants were selected for this purpose. These were the catalytic reduction of p-nitrophenol, and catalytic degradation of methyl orange and methylene blue. In all cases the catalytic activity was found to increase with the amount of CuO in the nanocomposite. The catalytic efficiencies of all three reactions were high and followed zero-order kinetics.
1. Introduction
The potential of costly noble metallic nanoparticles (such as Au, Pt) as catalysts for different types of hydrogenation reactions has been explored extensively.1–4 Efforts towards the preparation and design of catalysts consisting of nanoparticles from cheaper transition metals, or still better their oxides, could lead to more energy and cost effective alternatives. Recently, there have been reports on the uses of Cu and CuO nanocrystals towards the reduction of p-nitrophenol (Nip), methylene blue (MB) and methyl orange (MO) with good catalytic activity.5–8 For instance, improved reduction rate of Nip by altering the morphology and microstructure of CuO nanocrystals has been observed.9–11 In addition, reports on the degradation of MB by nanostructured CuO, CuO/functionalized graphene nanocomposites12,13 and degradation of MO by CuO/CeO2 composites8 have established CuO nanostructures as efficient and cheap heterogeneous catalysts.
It is well known that catalyst support has a crucial role in the catalytic activity. Thus, magnesium oxide has been widely utilized as catalyst support for various reactions like oxidative dehydrogenation of propane over V2O5/MgO,14 CO2 reforming of methane over Ni/MgO,15 Au nanoparticles supported on MgO for p-nitrophenol reduction16 etc. Since MgO is an irreducible oxide, therefore, it is relatively inactive and thus suitable for support applications. In this connection it is also important to mention the low tendency of MgO towards oxygen adsorption. In this communication we present a solvothermal protocol for synthesis of CuO–MgO nanocomposites. Catalytic activities of these nanoparticles were investigated for the model reaction of Nip reduction, then for MB and MO degradation. The catalytic application of CuO–MgO nanocomposite material for Nip reduction or MB or MO degradation has not been reported so far. The catalytic kinetics, particularly, the influence of substrate concentration on the order of the reaction has been studied in detail. The reaction of catalytic reduction of p-nitrophenol (Nip) is important due to several reasons. First, it is a model catalytic reduction reaction, which occurs in mild conditions, with no side reactions and can easily be monitored through in situ UV visible spectroscopy. Second, the reduction of Nip leads to formation of p-aminophenol (AP) and this reaction is actually a representative for reduction of nitroarenes to their corresponding amines. In addition to this, while most of these nitroarenes are environmental pollutants, the corresponding amines are important intermediates in preparation of several drugs besides other applications. It is also worthwhile to note that in many cases catalysts demonstrating good catalytic reduction activity for Nip also do so for degradation of dyes such as methyl orange, methylene blue etc. The latter are well known azo dye effluents of textile industries into water. Similar to Nip, these pollutants are also mutagenic and carcinogenic to humans, besides being non-biodegradable and resistant to oxidation. In view of the above, methylene blue (MB), methyl orange (MO), and Nip have been used as model pollutants in literature to determine the catalytic activity of new catalyst materials.17–22
2. Experimental details
2.1 Solvothermal preparation of MgO supported CuO nanoparticles
All chemicals were supplied by Merck, India and used without further purification. The salt precursors taken were CuCl2·2H2O (98.5% purity) and MgCl2·6H2O (99% purity). The Cu and Mg precursor salts were respectively taken in the molar ratio of x![[thin space (1/6-em)]](https://www.rsc.org/images/entities/char_2009.gif) :(1 − x) with x = 0, 0.01, 0.03, 0.05 and 0.07. They were dissolved in a mixture of 40 mL de-ionized (DI) water in 50 mL ethylene glycol. To this reaction mixture, 2.5 M NaOH was added in a drop wise manner under continuous stirring until the pH of the solution reached 12. The reaction mixture was then transferred to a 40 mL Teflon-lined autoclave and heated at 180 °C for 24 h. The precipitate formed was recovered after letting the autoclave cool naturally to room temperature. This precipitate was washed several times with DI water and finally with absolute ethanol using a centrifuge. The precipitate was then dried in an oven at 100 °C for 12 h and the powder obtained was calcined at 450 °C for 1 h in open air to get the final product. For convenience of presentation, samples with x = 0, 0.01, 0.03, 0.05 and 0.07 are hereafter designated as CMS-0, CMS-1, CMS-2, CMS-3 and CMS-4 respectively.
:(1 − x) with x = 0, 0.01, 0.03, 0.05 and 0.07. They were dissolved in a mixture of 40 mL de-ionized (DI) water in 50 mL ethylene glycol. To this reaction mixture, 2.5 M NaOH was added in a drop wise manner under continuous stirring until the pH of the solution reached 12. The reaction mixture was then transferred to a 40 mL Teflon-lined autoclave and heated at 180 °C for 24 h. The precipitate formed was recovered after letting the autoclave cool naturally to room temperature. This precipitate was washed several times with DI water and finally with absolute ethanol using a centrifuge. The precipitate was then dried in an oven at 100 °C for 12 h and the powder obtained was calcined at 450 °C for 1 h in open air to get the final product. For convenience of presentation, samples with x = 0, 0.01, 0.03, 0.05 and 0.07 are hereafter designated as CMS-0, CMS-1, CMS-2, CMS-3 and CMS-4 respectively.
2.2 Procedure for catalytic kinetics evaluation
Initially, 0.1 mL of either 1.2 mM Nip or 1 mM MO or 2 mM MB were taken in 1.85 mL of DI water in a standard quartz cuvette of 1 cm path length to obtain the required solution. It was followed by the addition of 50 μL aqueous solution of NaBH4 in the above solutions. The concentration of NaBH4 was 0.263 M for p-NP and, 0.197 M for MO and MB solutions respectively. Then 200 μg of CuO–MgO catalyst powder was added into the above prepared solutions. The UV-vis absorption spectra of the solutions were recorded at regular intervals of time using Cary 60UV-vis spectrophotometer (Agilent Technologies) in the wavelength range of 200–800 nm.
2.3 Characterization
Phillips X'pert Pro Advanced powder X-ray diffractometer with Cu Kα radiation (λ = 0.15431 nm) was used to record XRD patterns of all the samples. Transmission electron microscopy (TEM, TECHNAI G2) with an acceleration voltage 200 kV was used to identify morphology of the particles. HRTEM images were collected using FEI TECNAI G2 20 TWIN TEM. SEM-EDX spectrum was obtained by FEI Quanta 200F. PHI 5000 Versaprobe II X-ray photoelectron spectrometer (ULVAC-PHI) using Al Kα as X-ray beam was used to understand the effect of catalysis on the oxidation states of the Cu, Mg and O components of the catalyst sample. Surface area of these catalysts were measured using surface area analyser (Smart Sorb 92/93).
3. Results and discussion
XRD patterns of powder samples are shown in Fig. 1. The analyses of these diffraction patterns reveal the existence of essentially the MgO phase. The presence of small quantity of Mg(OH)2 phase was also seen in these samples (CMS-1 to CMS-3). In samples CMS-1 to CMS-3 the CuO phase could not be identified due to its low concentration. However, CuO phase was observed in CMS-4 sample which can be attributed to the increased CuO concentration in the sample. Another important observation is the broadening of the MgO peaks in the diffraction patterns with increase in CuO content.
 |
| | Fig. 1 XRD patterns of CMS-1, CMS-2, CMS-3 and CMS-4 samples. | |
Fig. 2 shows the TEM brightfield images of MgO and CuO–MgO samples. Nanoparticles embedded in larger agglomerated particles can be seen in Fig. 2b–d. No such smaller particles could be seen in TEM image of pure MgO nanostructure (Fig. 2a) prepared by the same procedure. We also observe that the quantity of smaller particles increases with Cu2+ precursor percentage. To confirm the phase of the smaller nanoparticles we did HRTEM imaging of such a region (Fig. 3) of CMS-4 catalyst. Fig. 3a and b delineate and magnify the region showing the smaller nanoparticles adjacent to bigger agglomerated nanoparticles. Thus, the HRTEM image of CMS-4 catalyst (Fig. 3c) presents two distinct particles with d-spacing ∼0.25 nm and ∼0.14 nm. The d-spacing of ∼0.25 nm is of smaller particle. This corresponds to interplanar spacing of (0 0 2) plane of CuO phase. The d-spacing ∼0.14 nm could be indexed to (2 2 0) plane of MgO. On the basis of these observations we conclude that the smaller embedded nanoparticles are of CuO phase. The atomic percentage data obtained from SEM-EDX spectrum for all catalysts (CMS-1 to CMS-4) is tabulated in Table 1. It shows the presence of chemical compositions of Mg, Cu and O present in all CuO–MgO samples. The Cu atomic percentage for CMS-1, CMS-2, CMS-3 and CMS-4 are found to be 0.74%, 2.23%, 3.17% and 5.67% respectively.
 |
| | Fig. 2 TEM micrographs of CMS-1, CMS-2, CMS-3 and CMS-4 samples. | |
 |
| | Fig. 3 HRTEM images of CMS-4 sample (a), magnified view of the region showing the smaller nanoparticles adjacent to bigger agglomerated nanoparticles (b), d spacing of (0 0 2) plane of CuO phase and (2 2 0) plane of MgO (c). | |
Table 1 Atomic percentage data of Cu, Mg and O in all samples CMS-1, CMS-2, CMS-3 and CMS-4 obtained from EDX spectrum
| Element |
Atomic% |
| CMS-1 |
CMS-2 |
CMS-3 |
CMS-4 |
| O K |
52.48 |
59.80 |
53.57 |
52.10 |
| Mg K |
46.78 |
37.96 |
43.36 |
42.53 |
| Cu K |
0.74 |
2.23 |
3.07 |
5.37 |
Fig. 4a shows peaks corresponding to Cu, Mg and O in the XPS spectrum for the sample. The Cu 2p core level XPS spectrum (Fig. 4b) exhibits two major peaks for binding energies 934.9 and 955 eV (with spin–orbit splitting of 19.9 eV).23,24 These peaks are mainly attributed to Cu 2p3/2 and Cu 2p1/2 in CuO respectively. The shake-up peaks at 943 and 963 eV further confirmed the Cu2+ chemical state.23 Fig. 4c focuses on the Mg 1s region. This spectrum shows a peak at 1303.9 eV,25 which is typically due to Mg2+ species in the CMS-4 catalyst. Finally, the fitted O 1s spectrum consists of three peaks located at 530, 531.8 and 533.8 eV (Fig. 4d).26,27 The peak at 530 eV corresponds to lattice oxygen in MgO and CuO.26 The other two peaks at 531.8 and 533.8 eV originates from the adsorbed oxygen and water molecules on the surface CuO–MgO composite respectively.24
 |
| | Fig. 4 XPS spectra of as synthesized sample CMS-4. Survey spectrum (a), curve fitting spectrum of Cu 2p (b), Mg 1s (c), and O 1s (d). | |
The XPS survey spectrum of the catalyst CMS-4 after its use for the Nip reduction reaction, is displayed in Fig. 5a. Major peaks in the spectrum are at binding energies 932.3 and 952.2 eV.27 These are typically ascribed to Cu 2p3/2 and Cu 2p1/2 in Cu2O respectively (Fig. 5b). On the other hand, peaks at 934.2 and 954.1 eV with its shake-up peaks at 942.2 and 962.3 eV are due to the presence of Cu2+ species.23,24 Fig. 5c demonstrates the presence of Mg 1s peak at 1303.9 eV.25 In Fig. 5d, we observe peaks at 530 and 531 eV corresponding to lattice oxygen in MgO and CuO,26 and adsorbed oxygen on the catalyst surface. From these observations, it is clear that after use of the catalyst most of Cu2+ was reduced to Cu+ state but not completely. This could be due to presence of excess NaBH4 in the reaction system. In the next sub-sections 3.1, 3.2 and 3.3 we discuss the results of kinetics of Nip, MO and MB reduction respectively in presence of catalysts CMS-1 to CMS-4.
 |
| | Fig. 5 XPS spectra of sample CMS-4 after its use for the Nip reduction reaction. Survey spectrum (a), curve fitting spectrum of Cu 2p (b), Mg 1s (c), and O 1s (d). | |
3.1 Nitrophenol reduction by CuO–MgO catalyst
The characteristic UV-vis absorption of aqueous Nip solution was observed at ∼317 nm and shifted to ∼401 nm on addition of excess NaBH4 due to the formation of nitrophenolate ion. There was no reduction of Nip by NaBH4 in absence of catalyst. CMS-0 (pure MgO) nanoparticles were also tested for their catalytic activity. Fig. 6a gives the UV-visible spectra till 50 min of addition of CMS-0 catalyst (MgO sample) to Nip in presence of excess NaBH4. There is hardly any change in the intensity of absorption peak maximum. In contrast to this, Fig. 6b shows the complete reduction of Nip in presence of CMS-1 catalyst. The intensity of absorbance at ∼401 nm decreases with time and simultaneous increase of a new absorbance peak at ∼301 nm with two isosbestic points at ∼281 and ∼313 nm was observed. This indicates that Nip was converted to AP without any side reaction.
 |
| | Fig. 6 UV-vis spectra for reduction of Nip by NaBH4 in presence of (a) CMS-0 and (b) CMS-1 catalyst. | |
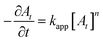
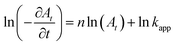
Denoting the absorbance of p-nitrophenolate ions at any time t and initial time t = 0 by At and A0 respectively, we plot At/A0 versus time plots for CMS-1, CMS-2, CMS-3 and CMS-4 catalyzed reactions (Fig. 7a). In all these plots At/A0 changes linearly with time which indicates that for these CuO–MgO catalysts zero-order rate law with respect to Nip concentration is followed. We employ the following methodology28 to find the exact order with respect to Nip. The rate equation for the reduction of Nip can be written as follows:
| |
 | (1) |
here, the exponents
m and
n are the order of [NaBH
4] and [Nip] respectively. The concentration of Nip at time of
t is denoted by
At, while
k is the rate constant. As mentioned earlier, since NaBH
4 has been taken in excess in comparison to Nip (more than 100 times in excess), therefore, its concentration virtually remains constant throughout the reaction.
Eqn (1) can be written in following simplified form:
| |
 | (2) |
| |
 | (3) |
 |
| | Fig. 7 (a) At/A0 versus time and (b) kapp versus x (mole fraction of Cu precursor salt) plots of CMS-1, CMS-2, CMS-3 and CMS-4 samples for reduction of Nip. | |
From the linear regression analysis of the ln(∂At/∂t) versus ln(At) plot the value of n is found to be n ∼ 0 for all catalyst samples. This indicates that the reaction belongs to the pseudo-zero-order reaction kinetics with respect to Nip. This is in contrast to results reported in majority of articles published in this area.15,16,21 However, there are recent exceptions where in presence of some catalysts the reduction of Nip was found to follow pseudo zero order kinetics.29,30 Another feature that we observe is that the rate constant increases with CuO content in the nanocomposite (Fig. 7b). This graph indicates that the active site density is related to the CuO content and increases with it. However, such an effect could also be due to increase in surface area. To investigate this aspect, we measure the surface area of these catalysts. These were found to be 96.20, 61.88, 50.55 and 36.12 m2 g−1 for CMS-1, CMS-2, CMS-3 and CMS-4 respectively. Here with increasing CuO content the surface area of catalyst decreases from CMS-1 to CMS-4. From this we conclude that the reaction rate constant is not dependent on surface area in this case. It is also clear from this that the active site density is related to the CuO content.
The activity of catalyst cannot be compared using rate constants because of several reasons. First, for the same reaction catalyzed by different catalysts the order of the reaction may be different rendering any comparison impossible. Further, neither the amount of product formed nor the catalyst used is taken into account. Therefore, in this study activities of the catalysts were measured in terms of turnover frequency (TOF). The TOF is calculated by dividing the amount of product formed (moles) by the amount of catalyst (moles) and the time required to produce the given amount of product.31 Amount of reactant may be used in this calculation instead of amount of product in case the product yield is 100%, else the percentage of yield needs to be taken into account. Table 2 gives a comparison of rate constants and the TOF of our catalyst samples with data available in literature for catalysts in which either CuO or MgO was a component. It is worthwhile to mention here that for all cases from literature presented in this table, TOF values were calculated by us using data given in these references assuming 100% product yield. On referring to Table 2 we find that for ref. 10 where spherical CuO nanoparticles alone were used as catalyst, the TOF value was calculated to be only 17.24 min−1. For one of the Cu2O phases in ref. 32 the TOF value is still lower, while for another Cu2O phase32 the TOF value lies between that of CMS-1 and CMS-2. Relative to these values, the TOF values found for the catalysts CMS-3 and CMS-4, prepared in the present study, are much higher. Another aspect is that the TOF value increases with the CuO component content in the catalyst samples. For the catalysts in the present study, where spherical CuO nanoparticles are embedded in MgO matrix, the TOF value ranges from 52.8 to 281.0 min−1. This is a big jump from references where either CuO10 or Cu2O32 only nanoparticles were used as catalysts. This indicates that the formation of CuO–MgO nanocomposites does have synergistic effect in comparison to catalytic behavior of CuO nanoparticles alone.
Table 2 Comparison of apparent reaction rate constants and turnover frequencies (TOF) for reduction of p-nitrophenol
| Catalyst |
Apparent reaction rate constant (kapp) (s−1) |
Turnover frequency (TOF) (min−1) |
Reference |
| Pseudo first order kinetics kapp values. Pseudo zero order kinetics kapp values. |
| CuO |
0.045a |
17.2 |
10 |
| Leaf like CuO |
0.0355a |
** |
11 |
| Au–MgO |
0.0076a |
0.00048 |
16 |
| Cu2O |
0.0156a |
4.7 |
32 |
| Cu2O |
0.0086a |
82.0 |
32 |
| CMS-1 |
0.00128b |
52.8 |
This work |
| CMS-2 |
0.0022b |
93.42 |
This work |
| CMS-3 |
0.00304b |
149.5 |
This work |
| CMS-4 |
0.00408b |
281.0 |
This work |
Another interesting feature to note is that the reduction starts without any induction time, that is, immediately after the addition of the catalyst without any delay. Different reasons have been attributed in literature for observation of induction time. For many catalysts it has been shown that such induction time is due to dissolved or adsorbed oxygen present in water reacting faster with borohydride than with Nip.30,33,34 The fact that we have not done anything to remove the dissolved oxygen (like purging the water with nitrogen) suggests that such CuO–MgO catalysts are technologically attractive alternatives under conditions that are suitable for zero order kinetics.
We have also carried out experiments for investigating the catalyst reusability. Accordingly, the catalyst CMS-4 was recycled four times. While the reaction rate after first cycle was 0.00354 s−1, even after four cycles the change in reaction rate was insignificant. Thus, the reaction rate at the end of the fourth cycle was found to be 0.00332 s−1. The histogram for reusability for four cycles is shown in Fig. 8b. As shown in the histogram, Nip reduction after first cycle was 86.5% and this decreased to 78% after four cycles. The small decrease in reaction rate may be due to the change in the state of copper from CuO to Cu2O as discussed in section 3.
 |
| | Fig. 8 Reusability of CMS-4 catalyst for four cycles of Nip reduction (a) and histogram showing percentage degradation in four cycles (b). | |
3.2 Methyl orange degradation by CuO–MgO catalyst
Fig. 9a displays an attempt to catalyze MO degradation in presence of MgO (CMS-0) only. However, as in case of Nip reduction, here also there is hardly any change in the maximum absorbance intensity with time. Fig. 9b depicts CMS-1 catalyzed degradation of MO in presence of NaBH4. The decrease in intensity of absorbance at ∼463 nm with time and appearance of new peak at ∼247 nm indicates the formation of hydrazine derivative.35
 |
| | Fig. 9 UV-vis spectra for degradation of MO by NaBH4 in presence of CMS-0 (a) and CMS-1 catalyst (b). | |
In Fig. 10a we observe that the degradation of MO in the presence of CMS-1, CMS-2, CMS-3 and CMS-4 obeys pseudo-zero-order kinetics. This was confirmed by using the methodology28 detailed in section 3.1. The apparent rate constant (kapp) increases with amount of CuO content, that is, from CMS-1 till CMS-4 (Fig. 10b). In MO degradation experiments there is an induction time after addition of the catalyst before the start of the reaction. Furthermore, the induction time increased in a systematic manner with CuO content (Fig. 10b). Possibly, dissolved oxygen in water adsorbs on to the catalyst surface and the reaction of such adsorbed oxygen with NaBH4 (rather than substrate) causes the induction time.34 Since the induction time increases with CuO content in the nanocomposite, therefore, it may be inferred that such oxygen adsorption on the catalyst surface also increases with CuO content. However, this is at variance with the observations made in case of Nip reduction. It appears that the adsorption of Nip on the catalyst is stronger than that of oxygen. Thus, in presence of excess substrate (Nip), oxygen is not able to get adsorbed on to the catalyst surface. On the other hand, the adsorption of MO on to this catalyst is possibly comparable or weaker to oxygen.
 |
| | Fig. 10 Degradation kinetics of MO in presence of CMS-1, CMS-2, CMS-3 and CMS-4 catalyst samples (a) At/A0 versus time (b) kapp and induction time versus x (mole fraction of Cu precursor salt) plots. | |
3.3 Methylene blue degradation by CuO–MgO catalyst
The UV-vis spectrum of reduction of MB with NaBH4 in the presence of CMS-0 (MgO alone) catalyst shows very poor reduction after 50 min as shown in Fig. 11a. On the other hand, in presence of other CuO–MgO nanocomposite catalysts reduction of MB occurs (Fig. 11b). This is monitored by the reduction of the intensity of absorbance of the UV-vis absorption peak at 664 nm. MB reduction in presence of CMS-1, CMS-2, CMS-3 and CMS-4 catalysts follow pseudo-zero-order kinetics (Fig. 12a), again confirmed using the methodology in ref. 28. Here our finding is different from the observation in case of MO (section 3.2). As the CuO content was increased, from CMS-1 to CMS-2 the rate showed slight increase. Then from CMS-2 to CMS-3 the rate constant almost doubles. Finally, at CMS-4 the rate constant decreases to lowest value among all four catalyst samples (Fig. 12b). Furthermore, in all cases an induction time or lag time was always required before the start of the reaction. Here also the situation may be similar to that observed in case of MO degradation.
 |
| | Fig. 11 UV-vis spectra for degradation of MB by NaBH4 in presence of CMS-0 (a) and CMS-1 catalysts (b). | |
 |
| | Fig. 12 Plots displaying the degradation kinetics (At/A0 versus t) of MB with CMS-1, CMS-2, CMS-3 and CMS-4 taken as catalysts (a) kapp and induction time versus x (mole fraction of Cu precursor salt) plots (b). | |
4. Conclusions
Solvothermally synthesized CuO–MgO nanocomposites have shown excellent catalytic activity towards reduction of p-nitrophenol, degradation of methyl orange and methylene blue dyes. The catalytic activity increased with amount of CuO content until the precursor copper salt concentration in the nanocomposite did not exceed 7%. On further increasing the precursor copper salt concentration pure CuO phase was not obtained. All CuO–MgO nanocomposite catalyzed reactions were found to follow pseudo-zero-order kinetics. The catalytic activities of these catalysts were found for reduction of p-nitrophenol, degradation of methyl orange and methylene blue. With respect to p-nitrophenol reduction all CuO–MgO nanocomposite catalysts demonstrate significantly better activity (TOF) than other nanocatalysts reported earlier in literature having either CuO or MgO components. From this it could be inferred that such relatively high TOF could be due to some kind of synergistic effect operating in these nanocomposites.
Acknowledgements
We thank Prof. Y. C. Sharma (Department of Chemistry, IIT BHU) for surface area measurements using Smart Sorb 92/93 Surface area analyzer. One of authors (ADV) would also like to thank UGC, New Delhi for financial support (SRF).
References
- N. Pradhan, A. Pal and T. Pal, Colloids Surf., A, 2002, 196, 247–257 CrossRef CAS
 .
. - S. Pandey and S. B. Mishra, Carbohydr. Polym., 2014, 113, 525–531 CrossRef CAS PubMed .
- C. Lin, K. Tao, D. Hua, Z. Ma and S. Zhou, Molecules, 2013, 18, 12609–12620 CrossRef CAS PubMed .
- A. Gangula, R. Podila, M. Ramakrishna, L. Karanam, C. Janardhana and A. M. Rao, Langmuir, 2011, 27, 15268–15274 CrossRef PubMed .
- A. D. Verma, R. K. Mandal and I. Sinha, Catal. Lett., 2015, 145, 1885–1892 CrossRef CAS .
- Z. Zhou, C. Lu, X. Wu and X. Zhang, RSC Adv., 2013, 3, 26066–26073 RSC .
- M. U. A. Prathap, B. Kaur and R. Srivastava, J. Colloid Interface Sci., 2012, 370, 144–154 CrossRef PubMed .
- D. Xu, F. Cheng, Q. Lu and P. Dai, Ind. Eng. Chem. Res., 2014, 53, 2625–2632 CrossRef CAS .
- Y. Ma, Y. Ni, F. Guo and N. Xiang, Cryst. Growth Des., 2015, 15, 2243–2252 Search PubMed .
- M. Nasrollahzadeh, M. Maham and S. Mohammad Sajadi, J. Colloid Interface Sci., 2015, 455, 245–253 CrossRef CAS PubMed .
- W. Che, Y. Ni, Y. Zhang and Y. Ma, J. Phys. Chem. Solids, 2015, 77, 1–7 CrossRef CAS .
- N. Yusoff, N. M. Huang, M. R. Muhamad, S. V. Kumar, H. N. Lim and I. Harrison, Mater. Lett., 2013, 93, 393–396 CrossRef CAS .
- R. Srivastava, M. U. Anu Prathap and R. Kore, Colloids Surf., A, 2011, 392, 271–282 CrossRef CAS .
- A. A. Lemonidou and M. Machli, Catal. Today, 2007, 127, 132–138 CrossRef CAS .
- W. Hua, L. Jin, X. He, J. Liu and H. Hu, Catal. Commun., 2010, 11, 968–972 CrossRef CAS .
- K. Layek, M. L. Kantam, M. Shirai, D. Nishio-Hamane, T. Sasaki and H. Maheswaran, Green Chem., 2012, 14, 3164 RSC .
- S. Zaman, A. Zainelabdin, G. Amin, O. Nur and M. Willander, J. Phys. Chem. Solids, 2012, 73, 1320–1325 CrossRef CAS .
- V. S. Suvith and D. Philip, Spectrochim. Acta, Part A, 2014, 118, 526–532 CrossRef CAS PubMed .
- M. M. Khan, J. Lee and M. H. Cho, J. Ind. Eng. Chem., 2014, 20, 1584–1590 CrossRef CAS .
- A. K. Chatterjee, R. K. Sarkar, A. P. Chattopadhyay, P. Aich, R. Chakraborty and T. Basu, Nanotechnology, 2012, 23, 085103 CrossRef PubMed .
- S. Naraginti, F. B. Stephen, A. Radhakrishnan and A. Sivakumar, Spectrochim. Acta, Part A, 2015, 135, 814–819 CrossRef CAS PubMed .
- W. Wu, M. Lei, S. Yang, L. Zhou, L. Liu, X. Xiao, C. Jiang and V. A. L. Roy, J. Mater. Chem. A, 2015, 3, 3450–3455 RSC .
- O. Akhavan and E. Ghaderi, J. Mater. Chem., 2011, 21, 12935–12940 RSC .
- D. P. Dubal, G. S. Gund, R. Holze, H. S. Jadhav, C. D. Lokhande and C. Park, Dalton Trans., 2013, 42, 6459–6467 RSC .
- A. M. Salvi, F. Langerame, A. Macchia, M. P. Sammartino and M. L. Tabasso, Chem. Cent. J., 2012, 6, 1–13 Search PubMed .
- H. Liu, Q. Hu, G. Fan, L. Yang and F. Li, Catal. Sci. Technol., 2015, 5, 3960–3969 Search PubMed .
- R. Ji, W. Sun and Y. Chu, RSC Adv., 2014, 4, 6055–6059 RSC .
- X. Gu, W. Qi, X. Xu, Z. Sun, L. Zhang, W. Liu, X. Pan and D. Su, Nanoscale, 2014, 6, 6609–6616 RSC .
- A. Fedorczyk, J. Ratajczak, O. Kuzmych and M. Skompska, J. Solid State Electrochem., 2015, 19, 2849–2858 CrossRef CAS .
- X. Kong, Z. Sun, M. Chen, C. Chen and Q. Chen, Energy Environ. Sci., 2013, 6, 3260 Search PubMed .
- C. C. C. J. Seechurn, A. Deangelis and T. J. Colacot, Introduction to New Trends in Cross-Coupling: Theory and Applications, RSC Catalysis Series No. 21, The Royal Society of Chemistry, 2015 Search PubMed .
- A. K. Sasmal, S. Dutta and T. Pal, Dalton Trans., 2016, 45, 3139 RSC .
- T. Vincent and E. Guibal, Langmuir, 2003, 19, 8475–8483 CrossRef CAS .
- S. Saha, A. Pal, S. Kundu, S. Basu and T. Pal, Langmuir, 2010, 26, 2885–2893 CrossRef CAS PubMed .
- G. T. Brown and J. R. Darwent, J. Chem. Soc., Faraday Trans. 1, 1984, 80, 1631–1643 RSC .
|
| This journal is © The Royal Society of Chemistry 2016 |
Click here to see how this site uses Cookies. View our privacy policy here. 


