
The influence of ionic liquid additives on zinc half-cell electrochemical performance in zinc/bromine flow batteries
Gobinath P. Rajarathnam a,
Max E. Eastonb,
Martin Schneidera,
Anthony F. Mastersb,
Thomas Maschmeyerbc and
Anthony M. Vassallo*a
a,
Max E. Eastonb,
Martin Schneidera,
Anthony F. Mastersb,
Thomas Maschmeyerbc and
Anthony M. Vassallo*a
aSchool of Chemical and Biomolecular Engineering, J01, University of Sydney, NSW 2006, Australia. E-mail: anthony.vassallo@sydney.edu.au; gobinath.rajarathnam@sydney.edu.au; msch4873@uni.sydney.edu.au; Fax: +61 2 9351 2854; Tel: +61 2 9351 6740
bSchool of Chemistry, F11, University of Sydney, NSW 2006, Australia. E-mail: max.easton@sydney.edu.au; thomas.maschmeyer@sydney.edu.au; anthony.masters@sydney.edu.au
cAustralian Institute of Nanoscale Science and Technology, A31, University of Sydney, NSW 2006, Australia
First published on 11th March 2016
Abstract
Six ionic liquids were assessed for their suitability as alternative bromine-sequestering agents (BSAs) in zinc/bromine redox flow batteries (Zn/Br RFBs) via comparison against conventional BSA, 1-ethyl-1-methylpyrrolidinium bromide ([C2MPyrr]Br). These alternative BSAs included the bromide salts of the following cations: 1-ethyl-1-methylpiperidinium ([C2MPip]+), 1-ethyl-1-methylimidazolium ([C2MIm]+), 1-(2-hydroxyethyl)-3-methylimidazolium ([C2OHMIm]+), 1-ethylpyridinium ([C2Py]+) and 1-(2-hydroxyethyl)pyridinium ([C2OHPy]+). Cyclic and linear sweep voltammetry, as well as electrochemical impedance spectroscopy, were performed to understand the influence of electrolytes containing these ionic liquids on zinc half-cell electrochemical performance. Solutions with [C2Py]Br, [C2MIm]Br and [C2OHPy]Br improved zinc half-cell performance (highest-magnitude current, charge, maximum power and energy) when compared to those utilizing [C2MPyrr]Br. Electrolytes employing these BSAs also reduced the nucleation overpotential of zinc electrodeposition and stripping compared to those using [C2MPyrr]Br. Zinc electrodeposits obtained during charging from electrolytes containing the different BSAs were analyzed via scanning electron microscopy and X-ray diffraction. Scanning electron micrographs showed a strong relationship between the chemical structure of the BSA employed and the crystallinity of zinc electrodeposits, with solutions containing [C2OHMIm]Br, [C2Py]Br and [C2OHPy]Br producing more compact zinc deposits than those with other BSAs. These findings warrant further investigation of BSAs with delocalized cationic charge. While these compounds have been proposed for application in Zn/Br systems, they are also potentially adaptable to other types of RFBs, which employ the Br2/Br− redox couple and use electrolytes containing BSAs.
1. Introduction
Flow batteries offer a practical energy storage solution towards integrating renewable power sources with existing grid networks, prompting a number of recent reviews on the technology.1–8 In particular, zinc/bromine redox flow batteries9 (Zn/Br RFBs) are a practical and attractive choice for utility-scale electrical energy storage applications due to their high theoretical specific energy of 440 W h kg−1.10,11 There is an imperative to pursue the development of novel electrolytes and electrode materials, which improve electrochemical performance and increase the cost-effectiveness and commercial competitiveness of Zn/Br RFBs.The Zn/Br battery comprises two half-cell reactions during charge: zinc electroplating and the oxidation of bromide to bromine. The reverse reactions occur during discharge, whereby zinc is stripped from the electrode and Zn2+ ions enter the solution, while bromine is reduced to bromide. The two half-cell chemical reactions are as follows (eqn (1) and (2)):
| Zn2+ (aq) + 2e− ⇌ Zn (s), E0 = −0.76 V vs. standard hydrogen electrode (SHE) | (1) |
| 2Br− (aq) ⇌ Br2 (aq) + 2e−, E0 = +1.09 V vs. SHE | (2) |
Br2 evolved at the cathode during charging of the Zn/Br RFB is volatile and also capable of causing the battery to self-discharge upon contact with electroplated zinc (generated at the opposing half-cell). Hence, it is beneficial for the Zn/Br system to introduce a bromine sequestration agent (BSA) that complexes the evolved Br2 into a separate phase from the aqueous electrolyte, as a different chemical species. The BSA is usually an organic quaternary ammonium bromide such as 1-ethyl-1-methylmorpholinium bromide or 1-ethyl-1-methylpyrrolidinium bromide,12,13 although there has been recent work to find suitable alternatives.14
In the late 1970s and throughout the 1980s when most of the major developments on Zn/Br systems occurred,15–20 the mechanism of dendrite formation from zinc halide solutions was studied, as were methods of its prevention. Some of these reports on zinc deposition during charging tests of zinc half-cells in Zn/Br systems indicated that the formation of zinc dendrites was prevalent during charging.15,16 Dendritic growth has negative implications on Zn/Br performance due to an increased risk of damage to the membrane occurring within the battery, thereby allowing Br2 to diffuse across the cell and self-discharge the electroplated zinc.
The evaluation of various organic bromide salts as potential BSAs has been a focus of earlier literature.17,21–23 A recent study has also looked at the influence of the BSA on the bromide-side electrode as a result of the changing electrochemical environment within the Zn/Br system at different states-of-charge.24 However, there appears to be little work reported to date investigating the possible effects of these organic agents on the zinc-side electrode of Zn/Br RFBs during electrodeposition (charging phase) and de-plating (discharge phase). The quality of electroplated zinc depends on many factors, including electrolyte composition.25 For instance, the presence of surfactants in zinc plating baths facilitates smooth electroplating, resulting in a uniform and shiny deposit.26 Consequently, the particular BSA employed could be considered an electrolyte additive which influences this electrodeposition process – a phenomenon which has been reported and reviewed in the literature.27–30 Such a consideration is of high importance as the use and effects of organic additives in zinc electroplating has long been an established practice in industry.31,32 This has also been investigated for the Zn/Br system.33 With relevance to the present work, it has been reported that increasing BSA concentrations in the electrolyte had the effect of reducing formation of zinc dendrites during charging.16
The present work is motivated by the need to develop alternative BSAs, which improve the electrochemical performance of both half-cells of the Zn/Br system. The focus here is on the zinc half-cell and significantly expands upon previous work presented in this area and accepted for publication in conference proceedings.34 Five novel BSAs are tested and compared against the conventionally used BSA, [C2MPyrr]Br, in a zinc half-cell to study the influence of the chemical structure of a BSA against the Zn/Zn(II) redox couple in this system. The methods, findings and implications of the present work are relevant to other RFBs, which employ the Br2/Br− redox couple and make use of organic BSAs to sequester the bromine evolved. The mechanism, kinetics and extent of bromine complexation by these BSAs are also likely to significantly influence system behavior in the bromine half-cell as well as overall full-cell charge/discharge cycling performance. These investigations are left to a separate study. Aspects of this work are also adaptable for hybrid systems that rely on metal deposition from solution.
2. Methodology
2.1. BSA and electrolyte preparation
Zinc bromide (as ZnBr2, Aldrich, >98%), zinc chloride (ZnCl2, Ajax, >95%) and potassium chloride (KCl, Ajax, 99.8%) were sourced commercially. The sequestration agents 1-ethyl-1-methylpyrrolidinium bromide ([C2MPyrr]Br), 1-ethyl-1-methylpiperidinium bromide ([C2MPip]Br), 1-ethyl-1-methylimidazolium bromide ([C2MIm]Br), 1-(2-hydroxyethyl)-3-methylimidazolium bromide ([C2OHMIm]Br), 1-ethylpyridinium bromide ([C2Py]Br) and 1-(2-hydroxyethyl)-pyridinium bromide ([C2OHPy]Br) were prepared by quaternisation of the required tertiary amine (Aldrich) by bromoethane (BDH), and purified by standard literature methods.35 Typical BSA concentrations used in Zn/Br electrolytes are approximately 0.8–1 M16,22 hence, this concentration range was selected for testing. Stock solutions (50 mL of 2.5 M ZnBr2 primary electrolyte) were prepared for each BSA tested.2.2. Half-cell electrochemical measurements
A glass three-terminal electrochemical cell was used for half-cell studies. Graphite-coated conductive carbon plastic sheets made from high-density polyethylene (HDPE) blended with carbon nanotubes (RedFlow Ltd., Brisbane, Australia) with known exposed surface area of 0.3 cm2 were used as working electrodes. Silver–silver chloride (Ag/AgCl/3.4 M KCl) was used as the reference electrode while the counter electrode was a polished vitreous carbon rod of 5 mm diameter. N2 gas was bubbled through each testing solution for at least 20 minutes under magnetic stirring to remove dissolved oxygen prior to half-cell testing. N2 was also introduced above the surface of the de-oxygenated solution to create and maintain an inert atmosphere to minimize oxygen re-dissolution into the electrolyte solution. The testing setup was placed in a custom-built Faraday shielding cage for the duration of all tests to minimize electrochemical interferences. The range of testing temperatures was based on ambient laboratory conditions of 25 ± 1 °C.Electrochemical measurements were made using a Bio-Logic SP-300 potentiostat attached to a desktop computer running EC-Lab (version 10.32) data acquisition software, which controls the instrument and was also used to process and fit the results obtained. Cyclic voltammetry (CV) was run at 30 mV s−1 with a step size of 2 mV between 0 V and −1 V vs. Ag/AgCl, with scans stabilizing by the sixth cycle. Linear sweep voltammetry (LSV) was carried out at a slow scan rate of 2 mV s−1 from −0.95 V to −0.7 V vs. Ag/AgCl. Good reproducibility of current densities is obtained using this setup, with values within ±2% (standard deviation of ±0.04 mA cm−2) for CV measurements and ±1% (standard deviation of ±0.001 mA cm−2) for LSV. The following equations were used for Tafel fitting on the linear regions of Tafel plots (eqn (3) and (4)):
 | (3) |
 | (4) |
 | (5) |
Electrochemical impedance spectroscopy (EIS) measurements began with polarizing the working electrode for 1 minute at −1 V vs. Ag/AgCl to promote zinc deposition, followed by measurement of the open-circuit potential (OCP). Potentiostatic EIS scans were then carried out within a frequency range of 4 MHz to 50 mHz (10 points per decade) at OCP with a 10 mV ac perturbation. The differential capacitance arising from ion assembly at the electroplated zinc surface (forming an interfacial electrical double-layer, EDL) due to the negatively polarized working electrode was studied using impedance methods described in the literature.36 Scanning was carried out at 20 frequencies between 0.1 and 200 kHz and potentials between −0.2 V and +0.2 V vs. OCP (0.1 V steps) to identify a suitable frequency for comparing EDL capacitive behavior of each solution studied. 1 kHz was selected as a suitable frequency as it allowed for clear comparison of trends in differential capacitance to be made (higher frequencies led to lower differential capacitance and distorted impedance measurements). Under the assumption that the working electrode is ideally polarizable, the differential capacitance was calculated as follows36 (eqn (6)):
| C = −(ωZim)−1 | (6) |
2.3. Zinc deposit preparation and characterization
A Neware battery cycler was used to generate zinc deposits on graphite-coated electrodes (similar to those used in half-cell electrochemical tests) at a current density of 20 mA cm−2 for 4 minutes. The electrolyte solution was under constant magnetic stirring at 800 rpm to promote electrolyte homogeneity. The deposits were then stored under vacuum in a desiccator prior to analysis via scanning electron microscopy (SEM) and X-ray diffraction (XRD). Samples were quickly transferred to the SEM in air. SEM imaging was performed with a Zeiss ULTRA+ operating at 5.0 kV. XRD scans were carried out in air using a Shimadzu S6000 employing a Cu-Kα target under conditions of 40 kV and 30 mA, between a range of 30–80°, at a scan speed of 5° min−1 and step size of 0.02°. The diffractograms obtained were analyzed using the PDF4+ software database to identify the preferred crystal orientations of zinc electrodeposited from each solution.3. Results and discussion
3.1. Physical properties of electrolytes containing varying BSA compounds
The cation structures of the various bromide salts prepared for this work are shown in Scheme 1, with mnemonic and numerical shorthand defined for ease of reference. The cations were selected using the conventional BSA, [C2MPyrr]Br (1), as a structural basis. Table 1 summarizes the physical properties measured for the electrolyte solutions containing all components of the electrolyte (as defined in Methodology section 2.1.).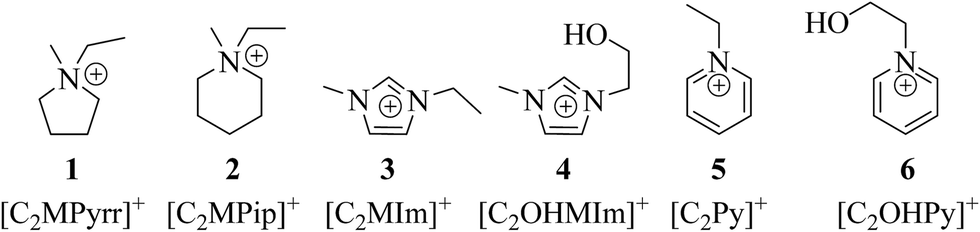 | ||
| Scheme 1 Cation structures of the BSAs studied in the present work. | ||
| BSA | pH | Conductivity (mS cm−1) |
|---|---|---|
| [C2MPyrr]Br (1) | 3.72 | 92.3 |
| [C2MPip]Br (2) | 3.64 | 84.1 |
| [C2MIm]Br (3) | 3.75 | 97.4 |
| [C2OHMIm]Br (4) | 3.30 | 96.0 |
| [C2Py]Br (5) | 3.65 | 98.8 |
| [C2OHPy]Br (6) | 3.41 | 96.7 |
Conductivities were comparable for solutions containing 3–6, with values ranging from 96.0–98.8 mS cm−1. Conductivity of the electrolyte employing 1 was slightly lower (92.3 mS cm−1) while the value for solutions containing 2 was significantly less at 84.1 mS cm−1. Electrolyte conductivity was enhanced when BSA cations with a delocalized positive charge were employed, a property which has a possible influence over electrochemical performance, vide infra. Similar pH values (3.64–3.75) were measured for solutions utilizing 1, 2, 3 and 5. However, a lower pH was obtained in the presence of BSAs with a hydroxyethyl group (4 and 6). This lower pH is attributed to the labile and thus acidic hydrogen atom of the OH group.
The influence of these physical properties and other chemical influences induced by the structurally disparate BSA cations on the zinc half-cell electrochemical performance are investigated below.
3.2. Cyclic voltammetry and Tafel analysis for the zinc redox couple in solutions of ionic liquid bromide salts
Voltammograms from CV of the Zn/Zn2+ redox couple in solutions containing the various BSAs are presented in Fig. 1. The following electrochemical performance indicators and relevant efficiencies (eff) are calculated during forward (i.e. reduction, red) and reverse (i.e. oxidation, ox) scans and are presented in Table 2: highest-magnitude current (j), charge (Q), maximum power (P*) and energy (E*) density, and nucleation overpotential (NOP). Values for highest-magnitude current and maximum power are obtained directly from voltammograms while energy and charge densities are calculated by integrating the area under plots of current and power against time, respectively. The electrode potential (jox-E) at which the stripping peak was produced from each electrolyte was also recorded. Ag/AgCl is used as a reference for calculating P* and E*. NOP for zinc electrodeposition is calculated as the difference between the deposition (DP) and cross-over potentials (COP) observed in CV plots. | ||
| Fig. 1 Zinc-side cyclic voltammograms for electrolytes containing the six BSAs tested in the present study: 1 [C2MPyrr]Br (thin solid red line), 2 [C2MPip]Br (large dotted red line), 3 [C2MIm]Br (thin dashed green line), 4 [C2OHMIm]Br (small dotted green line), 5 [C2Py]Br (thick solid blue line) and 6 [C2OHPy]Br (thick dashed blue line). | ||
| [C2MPyrr]Br (1) | [C2MPip]Br (2) | [C2MIm]Br (3) | [C2OHMIm]Br (4) | [C2Py]Br (5) | [C2OHPy]Br (6) | |
|---|---|---|---|---|---|---|
| jred, mA cm−2 | −10.3 | −8.8 | −10.8 | −10.2 | −13.3 | −10.9 |
| jox, mA cm−2 | 9.3 | 7.7 | 9.5 | 9.0 | 12.5 | 9.9 |
| jox-E, mV | −618 | −645 | −615 | −640 | −524 | −640 |
| Qred, mC cm−2 | −58.6 | −47.5 | −63.5 | −56.9 | −99.6 | −62.1 |
| Qox, mC cm−2 | 53.8 | 43.3 | 57.7 | 52.4 | 89.5 | 55.2 |
| Qeff, % | 91.9% | 91.3% | 90.9% | 92.1% | 89.9% | 88.9% |
| P*red, mW cm−2 | 10.3 | 8.8 | 10.8 | 10.2 | 13.3 | 10.9 |
| P*ox, mW cm−2 | 5.7 | 5.0 | 5.9 | 5.8 | 6.6 | 6.4 |
| P*eff, % | 56.0% | 56.3% | 54.5% | 56.5% | 49.3% | 58.2% |
| E*red, mJ cm−2 | 55.2 | 44.9 | 59.7 | 53.7 | 92.3 | 58.6 |
| E*ox, mJ cm−2 | 30.3 | 24.0 | 31.2 | 28.8 | 43.0 | 30.7 |
| E*eff, % | 54.9% | 53.5% | 52.3% | 53.7% | 46.5% | 52.4% |
| DP, mV | −848 | −865 | −841 | −856 | −792 | −851 |
| COP, mV | −809 | −815 | −804 | −815 | −762 | −815 |
| NOP, mV | 39 | 50 | 37 | 41 | 30 | 36 |
The highest magnitude of current densities obtained during zinc electrodeposition and stripping were for solutions of BSA 5, while those utilizing 2 gave the lowest values. This trend was generally observed for forward and reverse scan Q, P* and E* values. All the electrolytes tested gave relatively close Qeff (maximum difference of 3%), while a broader range of values was obtained for P*eff and E*eff (7–9% maximum difference). Pred during the forward CV scan of each solution was calculated using the highest-magnitude current at a lower scan limit of −1 V vs. Ag/AgCl reference, hence, each electrolyte produced P*red values of magnitude similar to their jred. However, this behavior was not maintained during the reverse scan since the stripping jox occurred at jox-E other than −1 V. Half-cell results suggest a possible inverse relationship between the magnitude of E values obtained in the zinc half-cell and the E*eff of zinc-related processes. A clear relationship is observed between better zinc half-cell electrochemical performances and narrowing of the NOP. The best-performing electrolyte containing BSA 5 also produced the lowest NOP while the highest NOP was recorded for the worst-performing solution utilizing BSA 2. On the basis of metrics including current densities and NOP, it is notable that better zinc half-cell CV performance was observed in almost every instance for solutions which employed BSAs possessing delocalized cationic charge (i.e. 3, 5 and 6), relative to the salts with localized charge (i.e. 1 and 2).
The cell configuration used is expected to result in variations of zinc ion concentration in the electrolyte solution during CV measurements, viz. decreasing and increasing during the forward and reverse scans, respectively. This variation is in turn expected to have influence over the various impedances within the system determining half-cell performance, such as those associated with diffusion limitations at the electrode–electrolyte interface. This aspect is of interest in the present work, and consequently studied via EIS with the results presented and discussed in subsequent sections of this work.
Tafel plots for the zinc half-cell in the presence of each BSA are presented in Fig. 2. Tafel analysis was performed for each electrolyte and a full set of Tafel fitting parameters including the exchange current density (i0), polarization resistance (Rp), anodic (βa) and cathodic (βc) beta constants as well as the potential (E0) at which i0 occurs, is presented in Table 3. Tafel plots show that lower E0 generally leads to higher i0, although there appears to be some trade-off for the case of solutions with BSA 3 where i0 decreased instead. Solutions producing lower Rp were generally also those which produced higher magnitude currents, charge, maximum power and energy densities observed during CV tests.
 | ||
| Fig. 2 Zinc half-cell Tafel plots for electrolytes containing the six BSAs tested in the present study: 1 [C2MPyrr]Br (thin solid red line), 2 [C2MPip]Br (large dotted red line), 3 [C2MIm]Br (thin dashed green line), 4 [C2OHMIm]Br (small dotted green line), 5 [C2Py]Br (thick solid blue line) and 6 [C2OHPy]Br (thick dashed blue line). | ||
| [C2MPyrr]Br (1) | [C2MPip]Br (2) | [C2MIm]Br (3) | [C2OHMIm]Br (4) | [C2Py]Br (5) | [C2OHPy]Br (6) | |
|---|---|---|---|---|---|---|
| i0, mA cm−2 | 1.15 | 0.70 | 1.67 | 1.02 | 1.03 | 0.97 |
| E0, mV | −805 | −811 | −801 | −812 | −760 | −812 |
| βa, mV dec−1 | 132 | 97 | 173 | 114 | 108 | 100 |
| βc, mV dec−1 | 138 | 107 | 179 | 120 | 112 | 111 |
| Rp, Ω | 79 | 101 | 73 | 74 | 71 | 68 |
3.3. Impedance spectroscopy
A Nyquist plot obtained by EIS for each electrolyte is presented in Fig. 3. An equivalent circuit model (see inset of Fig. 3) representing the various contributors to electrochemical impedance within the system was proposed and fitted using the Simplex method for each EIS result obtained. The proposed circuit is deemed appropriate due to the single-time-constant behavior observed in the impedance spectra obtained. The resistor circuit element R1 represents solution resistance existing between the reference and working electrodes. R2 represents charge-transfer resistance of the redox reaction while C2 represents the capacitive contribution of the electrical double-layer arising due to ions at the electrode–electrolyte interface. Finally, the W2 element represents Warburg diffusion limitations of ions. The values of each circuit element are presented in Table 4 for each of the electrolytes studied. | ||
| Fig. 3 Zinc half-cell Nyquist curves for electrolytes containing the six BSAs tested in the present study: 1 [C2MPyrr]Br (thin solid line), 2 [C2MPip]Br (large dotted line), 3 [C2MIm]Br (thin dashed line), 4 [C2OHMIm]Br (small dotted line), 5 [C2Py]Br (thick solid line) and 6 [C2OHPy]Br (thick dashed line). Inset shows the equivalent circuit model used to simulate each curve. | ||
| [C2MPyrr]Br (1) | [C2MPip]Br (2) | [C2MIm]Br (3) | [C2OHMIm]Br (4) | [C2Py]Br (5) | [C2OHPy]Br (6) | |
|---|---|---|---|---|---|---|
| R1, Ω | 53.2 ± 0.3 | 57.6 ± 0.3 | 55.3 ± 0.3 | 56.3 ± 0.3 | 56.2 ± 0.3 | 52.9 ± 0.2 |
| C2, μF | 36 ± 3 | 82 ± 9 | 92 ± 11 | 109 ± 24 | 83 ± 11 | 96 ± 23 |
| R2, Ω | 21.1 ± 0.3 | 17.5 ± 0.4 | 15.1 ± 0.4 | 8.6 ± 0.3 | 13.9 ± 0.4 | 7.7 ± 0.2 |
| W2, Ω s−0.5 | 4.5 ± 0.1 | 3.8 ± 0.2 | 3.9 ± 0.2 | 2.3 ± 0.1 | 2.6 ± 0.2 | 2.4 ± 0.1 |
Some links are observed between zinc half-cell electrochemical impedance behavior and the physical properties of electrolytes. Electrolyte solution resistances (R1) are close (between 53 and 58 Ω), with those employing BSA 2 having the highest R1. A higher R1 suggests a lower mobility of ions within the electrolyte under the polarization conditions studied, which in turn could potentially be attributed to physical properties of the electrolyte such as a lower ionic conductivity. This suggestion is generally supported by the 9% lower ionic conductivity measured for electrolyte containing BSA 2 compared to electrolyte using 1 (see Table 1). The better-performing solutions containing BSAs 3, 5 and 6 showed conductivities 5–7% higher than those with 1, even though they also produced slightly higher R1.
Significantly higher capacitance (C2) values were obtained for electrolytes containing non-conventional BSAs (i.e. 2–6). We attribute this increase in capacitance to denser packing of ions forming the EDL in those solutions. EIS results suggest that the BSA (which is usually considered a spectator in zinc half-cell electrochemistry) is actually interacting with the primary and/or supporting ions present in the electrolyte. It is also possible for the BSAs to be directly interacting with the surface of the negatively polarized zinc-side electrode (and later with the electrodeposited zinc as the charging phase progresses), thereby giving rise to an electrode-blocking phenomenon at some regions which causes additional zinc to deposit elsewhere.
Both EIS and differential capacitance tests confirm the existence of some adsorption on the surface of the zinc-covered working electrode, and the differential capacitances varied according to electrode potential vs. OCP. Solutions containing 3 consistently produced the lowest differential capacitance at all scanning potentials, while those using 1 and 4 generally produced higher differential capacitance and electrolytes utilizing 2, 5 and 6 gave mid-range values. Cation type significantly influences EDL behavior, with denser EDL leading to higher capacitance.36 The size of ions (both cations and anions) has also been shown to influence differential capacitance, with larger ions leading to lower capacitance.37 We attribute the variations in differential capacitance seen in our work to the potential-dependent adsorption of BSA cations on the electroplated zinc surface. The BSA orientation and degree of this adsorption influences the packing density of ions forming the EDL, consequently changing the capacitance. Molecular modelling studies are underway to study this behavior.
A trend is observed between charge-transfer resistances (R2) and the structures of BSA present in solution. Electrolytes containing the two BSAs possessing hydroxyl functional groups (i.e. 4 and 6) produced the lowest R2 values of the BSAs studied. The use of non-hydroxyl versions of these BSAs resulted in a slight increase to these values (i.e. solutions with BSAs 3 and 5), while electrolytes containing 1 and 2 produced the highest R2. These observations suggest the strong dependence of zinc-side charge-transfer resistance on more than one factor, in this case pH, conductivity and other factors related to the chemical structure of the BSA that were unable to be measured directly. The relationship between the low pH and R2 of electrolytes with BSAs 4 and 6 is less than obvious. We propose two possible explanations for these observations: (a) the presence of the OH group increases the dipole behavior of the BSA, which in turn limits interactions with the zinc surface (e.g. adsorption) due to certain unfavorable molecular orientations (as described during EDL discussion, above) and thereby assists zinc electrodeposition by lowering the impedance to charge-transfer; (b) the labile hydrogen in the OH group results in more H+ ions being available to preferentially form the EDL at the negatively polarized working electrode (compared to other cations in solution), and these H+ ions are in turn displaced with relative ease when zinc ions undergo charge transfer and get electrodeposited.
EIS results also showed that the use of the non-conventional BSAs decreases resistance attributed to Warburg diffusion limitation (W2) in the zinc half-cell. This observation further suggests that BSAs are interacting with ions in solution and strongly influencing ion behavior (including mobility).
3.4. SEM and XRD characterization of zinc electrodeposits
The morphology of zinc electrodeposits obtained by galvanostatic deposition at 20 mA cm−2 after 4 minutes of charging varies significantly, depending on the BSA present in the electrolyte. This is unsurprising as the presence of various organic electrolyte additives has been shown previously to significantly alter the preferential crystal orientation of deposited zinc.38 SEM images of zinc deposits obtained from electrolytes containing the different BSAs are presented in Fig. 4. Zinc electrodeposits obtained from electrolytes containing BSAs 4–6 exhibited highly crystalline regions with crystal sizes generally less than or equal to 10 μm. This production of highly crystalline zinc plating is a result of the relatively low diffusion limitations and charge-transfer resistances observed for solutions containing these BSAs. Conversely, solutions with the conventional BSA 1 produced slightly less ordered, but still relatively small crystalline deposits that were slightly larger than 10 μm. Zinc deposits with micrographs exhibiting highly mossy morphologies and little apparent ordering are produced from solutions containing BSAs 2 and 3. Compactness of zinc deposits has been linked to improved battery performance39 and is supported by the findings in this work, wherein solutions giving highly-crystalline deposits were generally found to give good electrochemical performance during CV tests. The disparate structural features of the BSA cations studied potentially influence the formation and maintenance of complexed species with zinc in solution, leading to differences in orientations of crystals obtained, vide infra. Further experimental and molecular simulation work is currently in progress to understand this behavior. | ||
| Fig. 4 SEM images (100 (a, b, c and e) or 200 (d and f) μm scale for large images, 2 μm scale for insets) of zinc deposits obtained after 4 minutes of charging at 20 mA cm−2 current density from electrolytes containing the six BSAs tested: (a) 1 [C2MPyrr]Br, (b) 2 [C2MPip]Br, (c) 3 [C2MIm]Br, (d) 4 [C2OHMIm]Br, (e) 5 [C2Py]Br and (f) 6 [C2OHPy]Br. | ||
The preferred crystal orientations of zinc electrodeposits was analyzed via XRD and found to vary depending on the BSA present in the electrolyte solution. Reflections, found by examination of blank samples to be associated with the clean/bare graphite electrode substrate and conductive silver-based glue from the preparation stage, were removed prior to identifying the preferred orientations of zinc crystal obtained using PDF card #04-014-0230 in the PDF4+ database and confirming with results of previous studies involving zinc electroplated from ZnBr2 solutions.40,41 Raw diffractograms for each zinc deposit obtained from electrolytes containing the different BSAs are presented in Fig. 5, with Miller indices of zinc peaks indicated after identification during processing. Electrolyte with BSA 1 yielded an electrodeposit with a (101) preferred orientation and to a lesser extent the (102) orientation. Zinc electrodeposited from solutions containing BSAs 2–6 generally shows a strong preference for basal orientations. Most alternative electrolytes produced zinc preferring the (004) configuration, with the exception of samples derived from solutions with 6 that produced crystals preferring the (002) orientation.
 | ||
| Fig. 5 Diffractograms (with Miller indices of zinc peaks indicated) from XRD analysis of zinc deposits obtained after 4 minutes of charging at 20 mA cm−2 current density from electrolytes containing the six BSAs tested: (a) 1 [C2MPyrr]Br, (b) 2 [C2MPip]Br, (c) 3 [C2MIm]Br, (d) 4 [C2OHMIm]Br, (e) 5 [C2Py]Br and (f) 6 [C2OHPy]Br. | ||
Electrochemical performance from half-cell tests of electrodepositing media can be linked to crystal orientation, with higher current densities obtained from electrolytes which produced zinc deposits with strong preferences for basal orientations at initial stages of charging (in this case 4 minutes into the charging process). Furthermore, an increasing preference for non-basal orientations directly relates to a decrease in zinc half-cell performance. This relationship is confirmed by the best-performing electrolytes containing 3, 5 and 6, all of which produce zinc deposits with preferences for (002) or (004) orientations. The presence of additional (103) or (102) planes in zinc electrodeposits from solutions containing 2 and 4 correlates with unfavorable electrochemical performance. It is possible that the presence of the (101) orientation in zinc electrodeposits could be linked to electrolytes which give better electrochemical performance. It has been shown that differential capacitance (as a function of electrode potential) is influenced by electrode surface structure.42 Given that the type of BSA used changes the morphology of zinc deposits obtained in the present work, variation in surface topography is the likely cause of different EDL structures and packing densities (and thus capacitive behavior) observed during EIS and differential capacitance tests for the different BSAs studied.
3.5. The influence of BSAs on zinc electrodeposition and stripping processes
On the basis of half-cell CV and Tafel analyses, electrolytes containing [C2MIm]Br and [C2OHPy]Br showed better electrochemical performance compared to those using the conventional BSA, [C2MPyrr]Br, while solutions utilizing [C2Py]Br gave the best performance.The alteration of the chemical structure of the BSA employed in the zinc half-cell has demonstrated a clear influence over both voltammetry performance and the quality of zinc electrodeposits obtained during the charging phase. This may be due to a number of factors. As expected, the conductivity of the solution is a strong driver of the electrochemical performance (see in particular EIS analysis), however this does not account for all observed behavior. We propose that zinc ions in solution are complexed to various extents (and by varying modes of interaction) by alteration of the BSA's chemical character, however this too is not straightforward. Zinc ions in aqueous solutions will be complexed by weakly associated ligands of water molecules (i.e., Zn(H2O)y2+), or bromide ions from the zinc bromide salt and/or BSA (i.e., Zn(Br)x(x−2)−). The existence of such bromo-zincates are well-known in the literature.43–45 In this example, favorable zinc electrodeposition is likely to occur for zinc coordinating water ligands preferentially due to the cationic complex arriving at the negatively polarized electrode, rather than the slight repulsion for the negatively charged bromide ligands. Thus, an important factor to consider is the strength of interaction between the BSA cation and its bromide counter-ion, whereby a weakly associated ion pair is more likely to provide a higher concentration of bromide ligands to complex zinc ions in solution.
In the case of the reduction currents experienced during electrodeposition, the negatively polarized electrode will assemble cationic species at its surface in the EDL. As the chemical structure of the BSA cation is varied substantially, the assembly of the EDL will vary in turn between each BSA electrolyte (as seen during EIS and differential capacitance tests). Consequently, the selection of BSA has significant influence over the behavior of zinc being electrodeposited on the electrode surface during the charging phase. In addition to the factors identified in the present study, other parameters likely also influence zinc half-cell performance. It is illuminating that those BSAs possessing delocalized cationic charges result in improved zinc half-cell performance by almost all the performance metrics applied in this study. Although further investigations are required to understand in more detail the chemistry underlying these observations, it is proposed that the electrolytes containing, for example, [C2Py]Br, assemble more weakly at the EDL and complex their bromide anions more strongly than do BSAs such as [C2MPip]Br. Weaker interactions amongst BSAs as well as with other electrolyte species would in turn influence ion mobility and thus the solution conductivities which appear to be linked to charge-transfer resistances.
4. Conclusions
Electrochemical studies were carried out on the zinc half-cell of a Zn/Br flow battery to study the performance of electrolytes containing six different BSAs: [C2MIm]Br, [C2OHMIm]Br, [C2Py]Br, [C2OHPy]Br, [C2MPip]Br and the conventionally-employed [C2MPyrr]Br. Solutions with [C2MIm]Br, [C2Py]Br and [C2OHPy]Br showed relatively good performance during CV tests and are recommended for further investigation as potential alternatives for future Zn/Br development. The best-performing electrolyte containing [C2Py]Br had lower polarization resistance and produced higher exchange currents than solutions with other BSAs due to a lower diffusion limitation and less charge-transfer resistance (as seen during EIS). SEM imaging and XRD analysis of zinc electrodeposits obtained from each electrolyte clearly showed the significant influence of BSAs on zinc deposition morphologies during the initial stages of charging. The type of BSA employed influences the size and preferred orientation of zinc crystals obtained, with smaller crystals and basal orientations linked to better electrochemical performance. The findings of this work demonstrate the strong influence of BSA choice on zinc half-cell performance and behavior, contrary to the conventional simplifying assumption that BSAs are only spectators in this chemistry. It is expected that these findings will lead to rationally improved electrolyte formulations that also address the zinc electrodeposition process in Zn/Br flow batteries.Acknowledgements
The authors thank the Australian Research Council and RedFlow Ltd. (Brisbane, Australia) for research funding and support, as well as A/Prof. Andrew Minett and Nikan Noorbehesht for facilitating equipment access. They acknowledge the facilities and the scientific and technical assistance of the Australian Microscopy & Microanalysis Research Facility at the University of Sydney. They would also like to express thanks for the Henry Bertie and Florence Mabel Gritton Research Scholarship (MEE) and the Australian Postgraduate Award (GPR).References
- P. Alotto, M. Guarnieri and F. Moro, Renewable Sustainable Energy Rev., 2014, 29, 325–335 CrossRef CAS.
- W. Wang, Q. Luo, B. Li, X. Wei, L. Li and Z. Yang, Adv. Funct. Mater., 2013, 23, 970–986 CrossRef CAS.
- T. M. I. Mahlia, T. J. Saktisahdan, A. Jannifar, M. H. Hasan and H. S. C. Matseelar, Renewable Sustainable Energy Rev., 2014, 33, 532–545 CrossRef.
- B. R. Chalamala, T. Soundappan, G. R. Fisher, M. R. Anstey, V. V. Viswanathan and M. L. Perry, Proc. IEEE, 2014, 102, 976–999 CrossRef CAS.
- B. Dunn, H. Kamath and J.-M. Tarascon, Science, 2011, 334, 928–935 CrossRef CAS PubMed.
- A. Z. Weber, M. M. Mench, J. P. Meyers, P. N. Ross, J. T. Gostick and Q. Liu, J. Appl. Electrochem., 2011, 41, 1137–1164 CrossRef CAS.
- L. M. S. Moro, in 2013 International Conference on New Concepts in Smart Cities: Fostering Public and Private Alliances, (SmartMILE), IEEE, Gijon, Spain, 2013, pp. 1–4 Search PubMed.
- M. Skyllas-Kazacos, M. H. Chakrabarti, S. A. Hajimolana, F. S. Mjalli and M. Saleem, J. Electrochem. Soc., 2011, 158, R55 CrossRef CAS.
- G. P. Rajarathnam and A. M. Vassallo, The Zinc/Bromine Flow Battery: Materials Challenges and Practical Solutions for Technology Advancement, Springer, Singapore, 1st edn, 2016 Search PubMed.
- C. Ponce de Leon and F. C. Walsh, in Encyclopedia of Electrochemical Power Sources, ed. C. Dyer, J. Garche, P. Moseley, Z. Ogumi, D. Rand and B. Scrosati, Elsevier, Amsterdam, NL, 2009, pp. 487–496 Search PubMed.
- F. Beck and P. Rüetschi, Electrochim. Acta, 2000, 45, 2467–2482 CrossRef CAS.
- K. Cedzynska, Electrochim. Acta, 1995, 40, 971–976 CrossRef CAS.
- G. Poon, A. Parasuraman, T. M. Lim and M. Skyllas-Kazacos, Electrochim. Acta, 2013, 107, 388–396 CrossRef CAS.
- E. Lancry, B.-Z. Magnes, I. Ben-David and M. Freiberg, ECS Trans., 2013, 53, 107–115 CrossRef.
- R. A. Putt, Assessment of technical and economic feasibility of zinc/bromine batteries for utility load leveling, Palo Alto, CA, USA, 1979 Search PubMed.
- K. J. Cathro, Zinc–bromine batteries for energy storage applications: volume 541 of end of grant report, Department of Resources and Energy, Canberra, Australia, 1986 Search PubMed.
- K. J. Cathro, K. Cedzynska and D. C. Constable, J. Power Sources, 1985, 16, 53–63 CrossRef CAS.
- M. Mastragostino and S. Valcher, Electrochim. Acta, 1983, 28, 501–505 CrossRef CAS.
- Exxon Research and Engineering Company, Development of a Circulating Zinc–Bromine Battery, Phase I. Final Report, Linden, New Jersey, USA, 1983 Search PubMed.
- Exxon Research and Engineering Company, Development of a Circulating Zinc–Bromine Battery, Phase II. Final Report, Linden, New Jersey, USA, 1983 Search PubMed.
- P. M. Hoobin, K. J. Cathro and J. O. Niere, J. Appl. Electrochem., 1989, 19, 943–945 CrossRef CAS.
- K. J. Cathro, K. Cedzynska, D. C. Constable and P. M. Hoobin, J. Power Sources, 1986, 18, 349–370 CrossRef CAS.
- I. Vogel and A. Moebius, J. Power Sources, 1991, 13, 237–243 CAS.
- J.-D. Jeon, H. S. Yang, J. Shim, H. S. Kim and J. H. Yang, Electrochim. Acta, 2014, 127, 397–402 CrossRef CAS.
- S. S. Abd El Rehim, S. M. Abd El Wahaab, E. E. Fouad and H. H. Hassan, J. Appl. Electrochem., 1994, 24, 350–354 CrossRef CAS.
- A. Gomes, A. S. Viana and M. I. Silva, J. Electrochem. Soc., 2007, 154, 452–461 CrossRef.
- Z. Liu, S. Z. El Abedin and F. Endres, Electrochim. Acta, 2013, 89, 635–643 CrossRef CAS.
- A. P. Abbott, J. C. Barron, G. Frisch, K. S. Ryder and A. F. Silva, Electrochim. Acta, 2011, 56, 5272–5279 CrossRef CAS.
- A. P. Abbott and K. J. McKenzie, Phys. Chem. Chem. Phys., 2006, 8, 4265 RSC.
- M. Kar, B. Winther-Jensen, M. Forsyth and D. R. MacFarlane, Phys. Chem. Chem. Phys., 2013, 15, 7191–7197 RSC.
- T. G. Sitnikova and A. S. Sitnikov, Prot. Met., 2005, 41, 607–609 CrossRef CAS.
- K. Boto, Electrodeposition Surf. Treat., 1975, 3, 77–95 CrossRef CAS.
- G. D. Wilcox and P. J. Mitchell, J. Power Sources, 1989, 28, 345–359 CrossRef CAS.
- G. P. Rajarathnam, M. Schneider, M. E. Easton and A. M. Vassallo, in Asia Pacific Confederation of Chemical Engineering Congress 2015: APCChE 2015, incorporating CHEMECA 2015, Engineers Australia, Melbourne, Victoria, pp. 1929–1940 Search PubMed.
- A. K. Burrell, R. E. Del Sesto, S. N. Baker, T. M. McCleskey and G. A. Baker, Green Chem., 2007, 9, 449–454 RSC.
- V. Lockett, R. Sedev, J. Ralston, M. Horne and T. Rodopoulos, J. Phys. Chem. C, 2008, 112, 7486–7495 CAS.
- V. Lockett, M. Horne, R. Sedev, T. Rodopoulos and J. Ralston, Phys. Chem. Chem. Phys., 2010, 12, 12499–12512 RSC.
- K. O. Nayana, T. V. Venkatesha, B. M. Praveen and K. Vathsala, J. Appl. Electrochem., 2010, 41, 39–49 CrossRef.
- D. Desai, X. Wei, D. A. Steingart and S. Banerjee, J. Power Sources, 2014, 256, 145–152 CrossRef CAS.
- S. Suresh, T. Kesavan, Y. Munaiah, I. Arulraj, S. Dheenadayalan and P. Ragupathy, RSC Adv., 2014, 4, 37947 RSC.
- D. S. Baik and D. J. Fray, J. Appl. Electrochem., 2001, 31, 1141–1147 CrossRef CAS.
- J. Vatamanu, L. Cao, O. Borodin, D. Bedrov and G. D. Smith, J. Phys. Chem. Lett., 2011, 2, 2267–2272 CrossRef CAS.
- J. G. Contreras, C. A. López and G. V. Seguel, Spectrosc. Lett., 1985, 18, 601–607 CrossRef CAS.
- M. M. Yang, D. A. Crerar and D. E. Irish, J. Solution Chem., 1988, 17, 751–762 CrossRef CAS.
- J. Van Heumen, T. Ozeki and D. E. Irish, Can. J. Chem., 1989, 67, 2030–2036 CrossRef CAS.
| This journal is © The Royal Society of Chemistry 2016 |