Laser irradiation induced photo-crystallization in nano-structured amorphous Se90−xHgxS10 (x = 0, 5, 10, 15) thin films

Shabir Ahmada, K. Asokanb and M. Zulfequar*a
aDepartment of Physics, Jamia Millia Islamia, New Delhi-110025, India. E-mail: mzulfe@rediffmail.com
bMaterials Science Division, Inter University Accelerator Centre, New Delhi-110067, India

Received 6th February 2016 , Accepted 19th April 2016

First published on 20th April 2016


Abstract

The present study focuses on the influence of laser irradiation induced photo crystallization on the modification of the optical and electrical properties of thermally evaporated amorphous Se90−xHgxS10 (x = 0, 5, 10, 15) thin films. The chemical composition and amorphous nature of the as-prepared thin films were examined by energy dispersive X-ray analysis and X-ray diffraction (XRD) respectively. However, the XRD analysis revealed the crystalline nature of the thin films irradiated using a 337.1 nm pulsed laser. These results were further investigated by surface morphological techniques, namely atomic force microscopy (AFM) and scanning electron microscopy (SEM). An enhancement in the average grain sizes after laser irradiation was observed. The absorption spectra obtained using a UV-vis-spectrophotometer were evaluated using the Urbach’s edge method. As the duration of laser irradiation was increased, the optical energy gap and tail energy width for all the compositions decreased. Further, it has been observed that the value of the optical energy gap decreases with Hg content in the Se–S alloy. These results have been interpreted on the basis of laser irradiation-induced photo-crystallization in the film. Electrical analyses such as dark dc conductivity and photoconductivity in the temperature range 310–390 K show an enhancement of the electrical conductivity and a reduction in activation energy as the irradiation time increases and specify that the density of defect states decreases after irradiation. Temperature dependent photoconductivity measurements show similar trends to that of dark conductivity. This is because the photo-created carriers can move easily in laser irradiated thin films due to the crystallinity of the material.

1. Introduction

Metal based chalcogenides possess most desirable physical properties, especially optical properties, for potential applications. A major advantage of chalcogenide semiconductor thin films is the controlled response to external stimuli such as heat treatment, laser irradiation, gamma irradiation, swift heavy ion irradiation etc. which makes them feasible for several advanced applications like optical computing, optical data storage, ultrafast optical switches, optical sensors etc.1–4 During the process of light–matter interaction, electrons and holes are created; these photo-created carriers may not remain free but can become trapped, or localized in one way or another in the band tail states of amorphous semiconductors. Such localized states exhibit a strong electron–phonon coupling which may lead to a structural rearrangement of the lattice, and hence changes in the physical properties causing photo-darkening, photo-expansion, photo-crystallization, etc.5–8 Knowledge of the optical and electrical properties of these chalcogenide glasses is obviously necessary for exploiting their potential for very interesting technological applications. However, due to their outstanding performance in the technological field, various investigations have been reported so far regarding the study of the optical properties of chalcogenide thin films.9–12 Optical absorption data provide information on the band structure and the energy gap of semiconductors and hence understanding and developing the energy band diagram is possible for both crystalline and amorphous materials.

In the present study, the influence of pulsed laser irradiation on the structural, optical and electrical parameters of Se90−xHgxS10 (x = 0, 5, 10, 15) thin films has been investigated by analyzing the absorption spectra in the spectral range 400–800 nm for the optical study and the temperature range 310–390 K for the electrical study. We have used selenium (Se) as a major component as it has wide commercial applications in many industrial fields, such as Xerography, photo rectifiers, solar cells,13–15 photoconductors for high-definition television (HDTV),13 digital radiography (DDR)16 etc. This is because Se based photoconductors have high spatial resolution, low thermal noise and high sensitivity against a wide variety of wavelengths from visible to ultraviolet17 as well as X-rays18,19 as compared to Si based photoconductors. But pure Se has many disadvantages like low sensitivity and short lifetime. To overcome these disadvantages, we have selected Hg as an additive element or dopant for Se. As it is the only metal, except rubidium, gallium and cesium, that could be in the liquid state near room temperature, this makes it possible for Hg to be used as a high temperature thermometer. There is a strong tendency for Hg to supercool below its freezing point, so, seeding may be necessary to initiate solidification. The addition of the third element sulphur (S) enhances the electrical conductivity as is evident from various studies on similar types of alloys.20,21

2. Experimental studies

The bulk samples of Se90−xHgxS10 (x = 0, 5, 10, 15) ternary chalcogenide glass were prepared from a stoichiometric mixture of highly pure (99.999% purity) Se, S and Hg. The constituent elements were weighed in accordance with their atomic weight percentages using an electronic balance having the least count of 10−4 g. The material was then sealed in chemically cleaned and evacuated (∼10−5 torr) quartz ampoules (length ∼ 5 cm and internal diameter ∼ 8 mm). The sealed ampoules were placed in a Microprocessor-Controlled Programmable Muffle Furnace, where the temperature was increased at a constant heating rate of 4 °C min−1 up to 900 °C and the material within the ampoules was allowed to melt at 900 °C for 15 h. During heating, the ampoules were constantly rocked, by a rotating ceramic rod which was tucked away in the furnace with the ampoules, in order to obtain a homogeneous glassy alloy. After rocking for about 15 hours, the obtained melt was rapidly quenched in ice-cooled water. After quenching, the ingots were removed by breaking the ampoules and were grinded into a fine powder with the help of a pestle and mortar. From this powder, thin films were deposited by a thermal evaporation technique on cleaned glass substrates, at room temperature and under a pressure of ∼10−5 torr using a molybdenum boat. The glass substrates were first cleaned in an ultrasonic bath and then by acetone. To achieve a meta-stable equilibrium, the films were kept inside the deposition chamber for 24 h as suggested by Abkowitz.22 The radiation treatment of these thin films was performed using a TEA N2 pulsed laser, with wavelength 337.1 nm, power 100 kW and pulse width 1 ns, for different durations of time: 5, 10, and 15 min. The film thickness of Se90−xHgxS10 (x = 0, 5, 10, 15) were measured to be approximately 300 nm with the help of ellipsometry technique. The elemental compositions of the investigated thin films were verified by an energy dispersive X-ray (EDX) technique. A Rigaku Ultima IV X-ray diffractometer (XRD) was used in the scanning angle range of 10–60° for studying the structure of the as-prepared and laser-irradiated thin films. The copper target (Cu Kα1) was used as the X-ray source with wavelength λ = 1.54560 Å. The surface morphologies of the investigated thin films were studied using field emission scanning electron microscopy (FESEM). Model: Σigma by Carl Zeiss employed with Gemini Column (patented technology of Carl Zeiss). The surface topography of these films were analyzed using atomic force microscopy (AFM) (Nanoscope IIIa) in tapping mode in which the images were recorded before and after irradiation. The optical characterization of the thin films was carried out using a UV-vis-spectrophotometer (model: Camspec M550 double beam) with the wavelength range 400–800 nm. For electrical measurements, an electrode with a 1 mm gap was made using silver paste on the thin films. Dark dc conductivity and photoconductivity measurements were carried out in the temperature range 310–390 K at a constant voltage of 1.5 V by mounting the thin films on a specially designed metallic sample holder in which white light (200 W tungsten lamp) was shone through a transparent window. The thermal effects produced due to the lamp are not predominating because of its negligibly small temperature (nearly 2–4 K). The intensity of the lamp was measured to be 3650 lx by a digital Luxmeter (MS6610).

3. Results

3.1. X-ray diffraction (XRD) studies

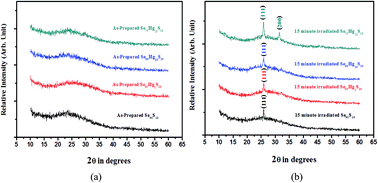
An X-ray diffractometer (XRD) was employed for studying the structure of the as-prepared and irradiated thin films of Se90−xHgxS10 (x = 0, 5, 10, 15). The X-ray diffraction patterns were obtained at room temperature, and are illustrated in Fig. 1. The absence of any sharp structural peaks in the XRD patterns of the as-prepared thin films confirms their amorphous nature while the presence of sharp structural peaks in the XRD patterns of the 15 min laser-irradiated thin films could be indicative of irradiation induced crystallization due to grain growth. Thus the XRD analysis clearly reveals the amorphous to crystalline phase transition after laser irradiation. Similar results have also been reported by other workers for different chalcogenide glasses.23,24 The peak values of the laser-irradiated thin films match well with cubic structure as per the standard data file (card no. 22-0729). The crystallite sizes of the 15 min laser irradiated thin films of Se90−xHgxS10 (x = 0, 5, 10 and 15) were calculated at the prominent (111) peak using Scherrer’s formula:25
 
image file: c6ra03491h-t1.tif(1)
where ‘D’ is the crystallite size, ‘λ’ is the wavelength of the X-ray used (i.e., λ = 1.54560 Å), ‘β’ is the full-width at half-maximum (FWHM) and ‘θ’ is the Bragg’s angle of reflection. The calculated grain size values are 69.23 nm, 78.52 nm, 82.01 nm and 100.22 nm for the 15 min laser irradiated thin films of Se90−xHgxS10 (x = 0, 5, 10 and 15) respectively.

image file: c6ra03491h-f1.tif
Fig. 1 XRD patterns of (a) as-prepared and (b) 15 minute laser irradiated thin films of Se90−xHgxS10 (x = 0, 5, 10, 15).

3.2. Elemental composition and surface morphological analysis

The elemental composition analysis was carried out using an EDX technique. Fig. 2 shows the typical EDX patterns of the as-prepared thin films of Se90−xHgxS10 (x = 0, 15). The calculated wt% values show Se (89.82%) and S (10.12%) for Se90S10 and Se (74.12%), S (9.64%) and Hg (16.24%) for Se75Hg15S10. Similarly the wt% values of the other compositions agree well with the experimentally taken wt% values. Intense peaks for Se were found in the spectra, due to its high concentration in comparison to S and Hg. The wt% values of C, Si, Na and Ca that arise due to the glass substrate are omitted in the analysis.
image file: c6ra03491h-f2.tif
Fig. 2 EDX spectra of as-prepared thin films of (a) Se90S10, and (b) Se75Hg15S10.
Surface morphological analysis. SEM is a suitable technique to study the microstructure of the thin films. Fig. 3 shows typical SEM images of the as-prepared and 15 min laser irradiated thin films of Se90−xHgxS10 (x = 0, 15). It is clear from these images, that the laser irradiated thin films show crystallites with developed facets which are due to the laser pulses. This is because irradiation initiates nucleation and grain growth. The grain size as calculated from the SEM images of these films varies from 36 to 62 nm for Se90S10 and 59 to 98 nm for Se75Hg15S10. A similar trend was also found in other compositions (Fig not shown).
image file: c6ra03491h-f3.tif
Fig. 3 SEM images of (a, c) as-prepared and (b, d) 15 minute laser irradiated thin films of Se90−xHgxS10 (x = 0, 15).

The typical two-dimensional and three-dimensional (2D and 3D) AFM images are depicted in Fig. 4 for the Se90−xHgxS10 films with Hg content x = 0 and 15. It is observed that the grain size increases with laser irradiation. The calculated grain size values of the as-prepared thin films of Se90−xHgxS10 (x = 0, 5, 10, 15) are 37 nm, 43 nm, 50 nm and 58 nm respectively whereas for the irradiated thin films, the grain size values are 59 nm, 71 nm, 83 nm and 95 nm respectively for same composition. The calculation of the average surface roughness (Ra) values for these as-prepared thin films shows very low values of 0.11, 0.12, 0.12, and 0.10 nm respectively for Se90−xHgxS10 (x = 0, 5, 10, 15). Such very low values predict a uniform surface of the Se90−xHgxS10 films when prepared by the thermal evaporation technique. It shows the compactness, pin hole free and adhesive nature of these films on glass substrates which will be very useful for various optoelectronic devices. After irradiation the average surface roughness (Ra) values of Se90−xHgxS10 (x = 0, 5, 10, 15) decrease to 0.09, 0.09, 0.10 and 0.08 nm, respectively. These AFM images confirm the results obtained from SEM and XRD analysis of Se90−xHgxS10. The AFM analysis shows that the grain size increases with the addition of Hg to the Se–S alloy. This is expected because the atomic radius of Hg is 0.151 nm, which is greater than the atomic radius of Se 0.117 nm. The present study on Se90−xHgxS10 films produced a very good solid solution which means that Hg atoms replace Se atoms in the crystal lattice. This leads to the formation of linear grains with an enhancement of grain size when one mixes Se–S with various amounts of Hg–Se.


image file: c6ra03491h-f4.tif
Fig. 4 AFM images (2 dimensional and 3 dimensional) of (a, b) as-prepared and (c, d) 15 minute laser irradiated thin films of Se90−xHgxS10 (x = 0, 15).

3.3. Optical studies

The optical absorption of the investigated thin films was measured in the wavelength range 400–800 nm as shown in Fig. 5. This was used to determine the optical constants like the absorption coefficient (a), extinction coefficient (k), optical band gap (Eg), Urbach’s energy (Eu) etc. This is because analysis of an optical absorption spectrum is one of the most dynamic, simple and yet most useful optical techniques for explaining various features concerning the band structure and the energy gap of amorphous materials.
image file: c6ra03491h-f5.tif
Fig. 5 Optical absorption spectra of as-prepared and laser irradiated thin films of (a) Se90S10, and (b) Se75Hg15S10.

The absorption coefficient (α) is calculated directly from the absorbance vs. wavelength curves using the relation:26,27

 
image file: c6ra03491h-t2.tif(2)

Fig. 6 displays the typical UV-visible absorption coefficient spectra of the as-prepared and laser irradiated (5, 10 and 15 min) Se90−xHgxS10 (x = 0, 15) thin films measured at room temperature. The absorption coefficient (α) value increases with the photon energy for the as-prepared and laser irradiated thin films. In an absorption process, a known energy of photon excites an electron from a lower to a higher energy state, corresponding to an absorption edge. In chalcogenide glasses, a typical absorption edge can be broadly ascribed to one of three processes: residual below-gap absorption, Urbach tails or inter-band absorption. Chalcogenide glasses have been found to exhibit highly reproducible optical edges which are relatively insensitive to preparation conditions and only the observable absorption28 with a gap under equilibrium conditions accounts for the first process. In the second process the absorption edge depends exponentially on the photon energy according to the Urbach relation:29

 
α = α0[thin space (1/6-em)]exp(/Eu) (3)
where α0 is a constant, h is plank’s constant and Eu is the width of the band tail or Urbach’s energy. The values of Urbach’s energy for the investigated thin films were estimated directly from the slopes of the plot ln(α) versus hν below the fundamental edge (figure not shown). The calculated values of Urbach’s energy decrease after laser irradiation, as listed in Tables 1–4, indicating that the dense defect states are decreased in the forbidden gap leading to the crystallization of the material after irradiation.


image file: c6ra03491h-f6.tif
Fig. 6 Variation in the absorption coefficient (α) with the incident photon energy of the as-prepared and laser irradiated thin films of (a) Se90S10, and (b) Se75Hg15S10.
Table 1 Optical parameters at a wavelength of 580 nm and electrical parameters at a temperature of 341 K for the as-prepared and laser irradiated thin films of Se90S10
Irradiation time Optical parameters Electrical parameters
Eg (eV) α × 104 (cm−1) Eu (eV) K ΔEdc (eV) σdc−1 cm−1) σ0−1 cm−1) ΔEph (eV) σph−1 cm−1)
As-deposited 1.95 ± 0.001 1.749 ± 0.3 0.220 0.080 0.296 5.924 × 10⁻⁵ 1.392 × 100 0.328 2.221 × 10⁻⁵
5 minutes 1.92 ± 0.001 2.030 ± 0.3 0.218 0.093 0.290 6.664 × 10⁻⁵ 1.277 × 100 0.327 2.406 × 10⁻⁵
10 minutes 1.91 ± 0.001 2.268 ± 0.3 0.216 0.104 0.266 7.590 × 10⁻⁵ 6.433 × 10⁻¹ 0.296 2.777 × 10⁻⁵
15 minutes 1.87 ± 0.001 3.338 ± 0.3 0.211 0.154 0.255 8.331 × 10⁻⁵ 4.857 × 10⁻¹ 0.294 3.517 × 10⁻⁵


Table 2 Optical parameters at a wavelength of 580 nm and electrical parameters at a temperature of 341 K for the as-prepared and laser irradiated thin films of Se85Hg5S10
Irradiation time Optical parameters Electrical parameters
Eg (eV) α × 104 (cm−1) Eu (eV) K ΔEdc (eV) σdc−1 cm−1) σ0−1 cm−1) ΔEph (eV) σph−1 cm−1)
As-deposited 1.91 ± 0.001 1.641 ± 0.3 0.218 0.077 0.295 6.664 × 10⁻⁵ 1.514 × 100 0.253 2.591 × 10⁻⁵
5 minutes 1.88 ± 0.001 2.466 ± 0.3 0.216 0.115 0.293 7.590 × 10⁻⁵ 1.611 × 100 0.257 3.147 × 10⁻⁵
10 minutes 1.86 ± 0.001 2.524 ± 0.3 0.214 0.118 0.296 7.960 × 10⁻⁵ 1.871 × 100 0.253 3.517 × 10⁻⁵
15 minutes 1.85 ± 0.001 2.712 ± 0.3 0.212 0.126 0.250 8.516 × 10⁻⁵ 4.189 × 10⁻¹ 0.242 6.109 × 10⁻⁵


Table 3 Optical parameters at a wavelength of 580 nm and electrical parameters at a temperature of 341 K for the as-prepared and laser irradiated thin films of Se80Hg10S10
Irradiation time Optical parameters Electrical parameters
Eg (eV) α × 104 (cm−1) Eu (eV) K ΔEdc (eV) σdc−1 cm−1) σ0−1 cm−1) ΔEph (eV) σph−1 cm−1)
As-deposited 1.90 ± 0.001 2.170 ± 0.3 0.215 0.100 0.282 7.775 × 10⁻⁵ 1.135 × 100 0.244 2.591 × 10⁻⁵
5 minutes 1.85 ± 0.001 2.876 ± 0.3 0.212 0.132 0.260 7.775 × 10⁻⁵ 5.374 × 10⁻¹ 0.234 3.517 × 10⁻⁵
10 minutes 1.89 ± 0.001 2.244 ± 0.3 0.209 0.103 0.259 1.073 × 10⁻⁴ 7.173 × 10⁻¹ 0.223 3.702 × 10⁻⁵
15 minutes 1.80 ± 0.001 3.739 ± 0.3 0.206 0.172 0.258 1.258 × 10⁻⁴ 8.129 × 10⁻¹ 0.197 4.258 × 10⁻⁵


Table 4 Optical parameters at a wavelength of 580 nm and electrical parameters at a temperature of 341 K for the as-prepared and laser irradiated thin films of Se75Hg15S10
Irradiation time Optical parameters Electrical parameters
Eg (eV) α × 104 (cm−1) Eu (eV) K ΔEdc (eV) σdc−1 cm−1) σ0−1 cm−1) ΔEph (eV) σph−1 cm−1)
As-deposited 1.85 ± 0.001 2.398 ± 0.3 0.212 0.213 0.245 9.626 × 10⁻⁵ 3.995 × 10⁻¹ 0.171 5.924 × 10⁻⁵
5 minutes 1.81 ± 0.001 3.245 ± 0.3 0.207 0.250 0.246 1.036 × 10⁻⁴ 3.815 × 10⁻¹ 0.158 7.775 × 10⁻⁵
10 minutes 1.75 ± 0.001 3.291 ± 0.3 0.203 0.277 0.156 1.481 × 10⁻⁴ 2.981 × 10⁻² 0.157 9.812 × 10⁻⁵
15 minutes 1.66 ± 0.001 4.197 ± 0.3 0.200 0.323 0.150 1.703 × 10⁻⁴ 2.795 × 10⁻² 0.117 1.073 × 10⁻⁴


The optical band gap was determined by applying the Tauc model,28 and the Davis and Mott model30 in the high absorbance region:

 
(αhν) = B(Eg)n (4)
where () is the photon energy, Eg is the optical band gap, and B is a constant. The exponent n is an index associated with the type of transition, which may be direct or indirect. Both types of transitions involve the interaction of electromagnetic waves (photons) with an electron in the valence band, which is excited across the gap to the conduction band. In fact n takes the values of 1/2 and 2 for allowed direct and indirect transitions respectively, and takes the values of 1/3 and 3 for forbidden direct and forbidden indirect transitions respectively. To obtain the value of n, several authors31–33 have suggested that the quantity (αhν)1/n must be plotted as a function of the incident photon energy () for all possible values of n and the one which fits eqn (4) will be taken as the value of n. In the present system, the value of n comes out to be 2 indicating that allowed indirect optical transitions are involved in the investigated thin films as shown in Fig. 7. The calculated optical band gap values of these films are summarized in Tables 1–4. The values of the optical band gap (Eg) decrease continuously when increasing the exposure time of laser irradiation. Similar results have also been reported for other amorphous Se based alloys.2,24 This decrease in the optical band gap with irradiation is understood in terms of inducing crystallization in semiconducting glasses. Laser irradiation provides sufficient energy to break weaker bonds thus introducing some translational degree of freedom to the system resulting in an increase in the heat capacity of the system and a decrease in the optical energy gap. Consequently, crystallization via nucleation and growth becomes possible and depends on the laser irradiation. The amount of crystalline phase increases with exposure time. In this way, the decrease in the optical band gap is attributed to the amorphous to crystalline phase transformation.


image file: c6ra03491h-f7.tif
Fig. 7 Variation of (αhν)1/2 with incident photon energy for the as-prepared and laser irradiated thin films of (a) Se90S10, and (b) Se75Hg15S10.

Fig. 8 shows the effect of grain size on the band gap schematically. The homonuclear bond energies of S–S, Se–Se and Hg–Hg, and the electro-negativities of S, Se, and Hg have been reported in various studies.20,34 The values of the heteronuclear bond energies Se–S, Hg–Se and Se–Hg are calculated using the values of electro-negativity and the homonuclear bond energies in an equation reported elsewhere.20,34 This analysis shows that the average bond energy decreases from 459.3 kJ mol−1 to 200.16 kJ mol−1. Thus, it is expected that some homonuclear bonds break, due to the laser irradiation, within the Se chain and new heteronuclear bonds are formed, because these require only a small amount of energy for formation. In this process, the additive elements Hg and S can mix completely with Se. Hence, in this way the resultant particle size increases because the atomic radius of Hg is greater than the atomic radius of Se. Thus, according to the Young–Laplace equation,35 the smaller the radius of the grain, the greater will be the pressure and hence strong forces towards the interior of the grain are present. These abnormalities at the surface are responsible for changes in the inter-atomic forces and hence changes in the band gap.36,37


image file: c6ra03491h-f8.tif
Fig. 8 Shows the schematic representations of the effect of laser irradiation on the grain size and band gap of Se–Hg–S thin films.

The extinction coefficient (K) values at different wavelengths have been estimated using the formula:27

 
image file: c6ra03491h-t3.tif(5)
where α and λ are the absorption coefficient and wavelength of the incident photon respectively. The spectral dependence of the extinction coefficient is shown in Fig. 9. The values of the extinction coefficient increase with the exposure time of irradiation as given in Tables 1–4.


image file: c6ra03491h-f9.tif
Fig. 9 Variation of extinction coefficient (K) with incident photon energy of the as-prepared and laser irradiated thin films of (a) Se90S10, and (b) Se75Hg15S10.

3.4. Electrical studies

The IdV and IphV plots of Se90−xHgxS10 (x = 0, 15) were measured at room temperature and are shown in Fig. 10 and 11. These films display ohmic behaviour and both their dark and photocurrent increase with the duration of laser irradiation. This change is found to a greater extent in the case of the Hg doped Se–S alloy. Similar behaviours were also observed for Se90−xHgxS10 (x = 5, 10) (Fig not shown).
image file: c6ra03491h-f10.tif
Fig. 10 Variation of dark current with voltage for the as-prepared and laser irradiated thin films of (a) Se90S10, and (b) Se75Hg15S10.

image file: c6ra03491h-f11.tif
Fig. 11 Variation of photocurrent with voltage for the as-prepared and laser irradiated thin films of (a) Se90S10, and (b) Se75Hg15S10.

The dark conductivity of a chalcogenide semiconductor generally depends on the density and mobility of its charge carriers. In this study the dc conductivity (σdc) was estimated in the temperature range of 307–391 K at a constant voltage of 1.5 V. Fig. 12 displays the temperature dependent dc conductivity (σdc) of the as-prepared and laser irradiated thin films of Se90−xHgxS10 (x = 0, 5, 10, 15). The plots of ln[thin space (1/6-em)]σdc versus 1000/T are found to be straight lines which indicate that the conduction occurs through an activated process and obeys the Arrhenius relation38 as:

 
σdc = σ0[thin space (1/6-em)]exp[−ΔEdc/KT] (6)
where σ0 is the pre-exponential factor related to the material, ΔEdc is the activation energy, K is the Boltzmann constant and T is the temperature. The values of activation energy (ΔEdc) are calculated from the slope of ln[thin space (1/6-em)]σdc versus 1000/T and using eqn (6). The slope of the curve is estimated using linear fit. The calculated values of the activation energy (ΔEdc), dc conductivity (σdc) and the pre-exponential factor (σ0) are given in Tables 1–4. It is clearly found that the dc conductivity increases and the corresponding activation energy decreases with irradiation time as shown in Fig. 12. There is variation in the steady state photoconductivity (σph) of the investigated thin films with temperature, at an intensity of 3650 lx. The ΔEph value is estimated by the slope of Fig. 13 and its values follow the same trend as that of ΔEdc as shown in Tables 1–4. Both the dark dc conductivity and photoconductivity increase exponentially with temperature and this implies that conduction occurs through a thermally activated process. Further the conduction in amorphous semiconductors can occur in three different ways:38


image file: c6ra03491h-f12.tif
Fig. 12 Variation of dark dc conductivity (σdc) with 1000/T for the as-prepared and laser irradiated thin films of (a) Se90S10, and (b) Se75Hg15S10.

image file: c6ra03491h-f13.tif
Fig. 13 Variation of photo-conductivity (σph) with 1000/T for the as-prepared and laser irradiated thin films of (a) Se90S10, and (b) Se75Hg15S10.

(i) At low temperature, the conduction is due to thermally assisted tunneling between the states at the Fermi-level.

(ii) At intermediate temperature, the conduction is due to the excitation of charge carriers into the localized states of the band tails, the carriers can take part in transport by hopping between these localized states.

(iii) At higher temperature, carriers are excited into the extended states.

According to the Davis Mott model,38 the value of the pre-exponential factor (σ0), also called the Mott parameter, decides the electrical conduction mechanism of amorphous semiconductors. The value of the pre-exponential factor (σ0) for extended state conduction lies in the range of 103 to 104 S cm−1, and for hopping conduction in localized states, the value of σ0 is very small. In the present case, the value of σ0 is very small (100 to 10−2 S cm−1) and so the conduction of the investigated thin films is due to hopping in localized states. The temperature dependent steady state photoconductivity curve in amorphous semiconductors shows three regimes:38–40

(i) At low temperature, the photoconductivity is directly proportional to the generation rate ‘g’ and remains nearly constant with temperature.

(ii) At intermediate temperature, the photoconductivity increases with temperature by several orders of magnitude. In this regime, the rate of recombination is governed by the photo-generated carriers and the photoconductivity is directly proportional to gγ and is less than the dark dc conductivity.

(iii) At higher temperature the photoconductivity decreases with temperature and is proportional to the intensity.

The present study of temperature dependent photoconductivity follows the second regime as measurements have been taken in the intermediate range. From Fig. 14, it was found that the photosensitivity (σph/σdc) of the investigated thin films remains nearly constant with up to 10 min of laser irradiation, and after 15 min it increases with laser irradiation for all compositions of Se90−xHgxS10 (x = 0, 5, 10, 15).


image file: c6ra03491h-f14.tif
Fig. 14 Variation of photosensitivity with irradiation time for the as-prepared and laser irradiated thin films of Se90−xHgxS10 (x = 0, 5, 10, 15) at room temperature.

4. Discussion

The above results show the modification of the structural, optical and electrical properties of amorphous Se90−xHgxS10 (x = 0, 5, 10, 15) thin films by laser irradiation. Both structural and surface morphological analyses revealed the transition from an amorphous to crystalline phase after irradiation. However, due to the amorphous nature of the as-prepared thin films, there are dense defect states present in between the forbidden energy gap also known as ‘Urbach’s energy band’ whose density varies exponentially as one moves from valence band to conduction band edges. These defect states are annealed out after laser irradiation as confirmed by Urbach’s energy (see Tables 1–4) whose value decreases with irradiation for all compositions. The optical analysis also shows the reduction in the optical band gap with irradiation (see Tables 1–4). This reduction in the optical band gap was interpreted in terms of an increase in grain size, because it is one of the important factors which could affect the optical band. If the grain size increases by a few nm the optical band gap should decrease,41 which holds good in the present study. Previous studies have also shown a similar kind of trend between the optical band gap and grain sizes.31,42,43 The values of the absorption coefficient increased with irradiation for all compositions of Se90−xHgxS10, and lies in the range of 10−4 cm−1 before and after irradiation. A significant improvement was found in both the dark current and photo-current (see Fig. 10 and 11) after laser irradiation. This remarkable change is explained on the basis of dense defect states present near the valence and conduction bands of the as-prepared thin films. The defect states will trap the charge carriers, reducing the mobility range, and hence the current. However, after irradiation these defects states are annealed out, and the current in these films increases. Similar trends are also observed in the case of temperature dependent dark dc conductivity and photoconductivity measurements (see Fig. 12 and 13). This significant improvement in the values of absorption coefficient, dc conductivity, photoconductivity and photosensitivity makes these materials suitable for many optoelectronic devices. For example for solar cell applications the optimum band gap of a material is 1.5 eV for producing maximum efficiency. This study shows that the value of the optical band gap of Se–S reaches 1.66 eV (shown in Table 4) after the addition of 15% Hg and after 15 min laser irradiation, which is very close to the optimum band gap. Thus Se75Hg15S10 is a good material for solar cell applications. Similarly the other compositions also have uses for other optoelectronic device applications.

5. Conclusion

The present study demonstrates that thin films of Se90−xHgxS10 undergo an amorphous to crystalline phase transition when irradiated with a laser. This structural transformation has been analyzed by XRD, SEM and AFM. The surface morphological analysis revealed that the value of grain size increased after laser irradiation. The surface topographical results analyzed by AFM favour this enhancement of grain size after laser irradiation. Optical analysis shows a decrease in the optical band gap of Se90−xHgxS10 (x = 0, 5, 10, 15) after irradiation and the corresponding absorption coefficient increases with laser irradiation. Electrical analysis displays dark dc conductivity and photoconductivity enhancements with laser irradiation. It was also found that the value of activation energy decreases after irradiation. Such significant improvement in the values of absorption coefficient, optical band gap, photoconductivity etc. makes these materials suitable for many optoelectronic device applications.

Acknowledgements

Authors (S. A., M. Z.) are very thankful to the Department of Physics, Jamia Millia Islamia, New Delhi, India, for their support in this work and encouragement and also to Mrs Indra Sulania, IUAC New Delhi, India, for providing us AFM measurement facility in this research. The author, S. A., is thankful to the University Grants Commission (UGC) for the financial assistance.

References

  1. N. Yamada, Mater. Res. Soc. Bull., 1996, 21, 48 CAS.
  2. A. A. Al-Ghamdi, S. A. Khan, S. Al-Heniti, F. A. Al-Agel and M. Zulfequar, Curr. Appl. Phys., 2011, 11, 315–320 CrossRef.
  3. Y. Raviprakash, K. V. Bangera and G. K. Shivakumar, Curr. Appl. Phys., 2010, 10, 193 CrossRef.
  4. M. Ahmad, J. Kumar and R. Thangaraj, J. Non-Cryst. Solids, 2009, 355, 2345 CrossRef CAS.
  5. A. Ganjoo, K. Shimakawa, H. Kamiya, E. A. Davis and J. Singh, Phys. Rev. B: Condens. Matter Mater. Phys., 2000, 62, 14601 CrossRef.
  6. V. V. Poborchii, A. V. Kolobov and K. Tanaka, Appl. Phys. Lett., 1999, 74, 215 CrossRef CAS.
  7. G. Chen, H. Jain, S. Khalid, J. Li, D. A. Drabold and S. R. Elliott, Solid State Commun., 2001, 120, 149–153 CrossRef CAS.
  8. K. Takana, Phys. Rev. B: Condens. Matter Mater. Phys., 1998, 57, 5163 CrossRef.
  9. F. A. Al-Agel, Vacuum, 2011, 85, 892–897 CrossRef CAS.
  10. N. A. Hegab and H. M. El-Mallah, Acta Phys. Pol., A, 2010, 118, 637–642 CrossRef CAS.
  11. S. Song, N. Carlie, J. Boudies, L. Petit, K. Richardson and C. B. Arnold, J. Non-Cryst. Solids, 2009, 355, 2272–2278 CrossRef CAS.
  12. S. Ahmad, M. Ganaie, M. S. Khan, K. Asokan and M. Zulfequar, Radiat. Eff. Defects Solids, 2015, 170, 30–42 CrossRef CAS.
  13. V. I. Mikla and V. V. Mikla, Amorphous Chalcogenides, 2012, p. 1, ISBN: 978-0-12-388429-9 Search PubMed.
  14. S. Diamond and D. S. Weiss, Hand Book of Imaging Materials, 2nd edn, 2002, ch. 9, p. 329, ISBN: 0-8247-8903-2 Search PubMed.
  15. J. I. Pankove, Hydrogenated Amorphous Silicon, Academic press, 1984, vol. 21, ch. 5, p. 75, INC, p- 1, ISBN: 0-12-752150- x Search PubMed.
  16. S. Easton, Practical VerterinaryDignostic Imaging, 2nd edn, 2012, ch. 12, ISBN: 978-0-470-65648-8 Search PubMed.
  17. S. Abbaszadeh, K. S. Karim and V. Karanassios, IEEE Trans. Electr. Insul., 2013, 60, 880–883 CAS.
  18. S. Kasap, J. B. Frey, G. Belev, O. Tousignant, H. Mani, J. Greenspan, L. Laperriere, O. Bubon, A. Reznik and G. DeCrescenzo, Sensors, 2011, 11, 5112–5157 CrossRef CAS PubMed.
  19. S. O. Kasap and J. A. Rowlands, IEEE Proc. Cirt. Dev. Syst, 2002, 149, 85–96 CrossRef.
  20. M. Nasir and M. Zulfequar, J. Phys. Chem. Solids, 2013, 74, 1527–1532 CrossRef CAS.
  21. M. Ganaie and M. Zulfequar, J. Mater. Sci.: Mater. Electron., 2015, 26, 4816–4822 CrossRef CAS.
  22. M. Abkowitz, Polym. Eng. Sci., 1984, 24(14), 1149–1154 CAS.
  23. M. A. Alvi, Curr. Appl. Phys., 2013, 13, 474–478 CrossRef.
  24. F. A. Al-Agel, E. A. Al-Arfaz, F. M. Al-Marzouki, S. A. Khan, Z. H. Khan and A. A. Al-Ghamdi, Mater. Sci. Semicond. Process., 2013, 16, 884–892 CrossRef CAS.
  25. L. I. Maissel and R. Glang, Handbook of Thin Film Technology, McGraw-Hill, New York, 1980 Search PubMed.
  26. D. P. Gosain, T. Shimizu, M. Ohmura, M. Suzuki, T. Bando and S. Okano, J. Mater. Sci., 1991, 26, 3271 CrossRef CAS.
  27. S. Ahmad, K. Asokan and M. Zulfequar, Philos. Mag., 2015, 95(12), 1309–1320 CrossRef CAS.
  28. J. Tauc, Amorphous and liquid semiconductors, Plenum Press, New York, vol. 171, 1974 Search PubMed.
  29. F. Urbach, Phys. Rev., 1953, 92, 1324 CrossRef CAS.
  30. E. A. David and N. F. Mott, Philos. Mag., 1970, 22, 903 CrossRef.
  31. M. R. Balboul, Radiat. Meas., 2008, 43, 1360 CrossRef CAS.
  32. G. Saffarini, J. M. Saiter and H. Schmitt, Opt. Mater., 2007, 29, 1143 CrossRef CAS.
  33. F. A. Al-Agel, E. A. Al-Arfaj, F. M. Al-Marzouki, S. A. Khan and A. A. Al-Ghamdi, Prog. Nat. Sci., 2013, 23(2), 139–144 CrossRef.
  34. S. Ahmad, K. Asokan, M. S. Khan and M. Zulfequar, Philos. Mag., 2015, 95(22), 2385–2402 CrossRef CAS.
  35. J. Wu and Z. M. Wang, Quantum Dot Solar Cells, Springer, New York, Heidilberg, Dordrecht, London, 2014, ch. 2, p. 42, ISBN: 978-1-4614-8147-8 Search PubMed.
  36. H. Kurisu, T. Tanaka, T. Karasawa and T. Komatsu, Jpn. J. Appl. Phys., 1993, 32, 285–287 CrossRef CAS.
  37. L. Chieh-Ju, M. Ari, B. Uri, L. C. Marvin and A. P. Alivisatos, J. Chem. Phys., 2000, 5, 113 Search PubMed.
  38. Non-Crystalline Materials, ed. N. F. Mott and E. A. Davis, Clarendon, Oxford, 1979 Search PubMed.
  39. J. M. Marshall, C. Main and E. E. Owen, J. Non-Cryst. Solids, 1972, 8, 760 CrossRef.
  40. Electronic and structural Properties of Semiconductors, ed. P. G. LeComber and J. Mort, Academic, London, New York, 1973 Search PubMed.
  41. R. Sreekumar, R. Jayakrishan, C. Sudha Kartha, K. P. Vijay Kumar, S. A. Khan and D. K. Avasthi, J. Appl. Phys., 2008, 103, 023709 CrossRef.
  42. N. Choudhury, F. Singh and B. K. Sarma, Indian J. Pure Appl. Phys., 2012, 50, 325–328 CAS.
  43. A. I. Khudiar, M. Zulfequar and Z. H. Khan, Radiat. Eff. Defects Solids, 2009, 164(9), 551–560 CrossRef CAS.

This journal is © The Royal Society of Chemistry 2016
Click here to see how this site uses Cookies. View our privacy policy here.