Effect of ammonium groups on the properties of anion conductive membranes based on partially fluorinated aromatic polymers

Ahmed Mohamed Ahmed Mahmoudab, Ahmed Mohamed Mohamed Elsaghierb and Kenji Miyatake*a
aClean Energy Research Center, University of Yamanashi, 4-3 Takeda Kofu, Yamanashi 400-8510, Japan. E-mail: miyatake@yamanashi.ac.jp; Fax: +81-55-220-8707; Tel: +81-55-220-8707
bChemistry Department, Faculty of Science, Sohag University, 2425, Sohag, Egypt

Received 3rd February 2016 , Accepted 8th March 2016

First published on 10th March 2016


Abstract

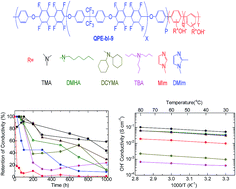
A series of anion exchange membranes (QPE-bl-9) based on a partially fluorinated hydrophobic segment and oligophenylene as scaffolds for ammonium cations were synthesized to evaluate the effect of the various ammonium groups derived from trimethyl amine (TMA), dimethyl hexyl amine (DMHA), methyl imidazole (MIm), dimethyl imidazole (DMIm), tributyl amine (TBA), and dicyclohexyl methyl amine (DCHMA) on the membrane properties. QPE-bl-9 membranes were well characterized by 1H NMR spectroscopy, in which all the peaks were assigned to the supposed structure. The TEM images of QPE-bl-9–TMA, –MIm, –DMIm and –DMHA membranes showed small hydrophilic/hydrophobic phase separated morphology (hydrophilic domains 1–3 nm). QPE-bl-9–TMA (1.6 mequiv. g−1) exhibited the highest hydroxide ion conductivity (101 mS cm−1 at 80 °C) among the tested membranes, followed by QPE-bl-9–DMHA (62 mS cm−1) and QPE-bl-9–DMIm (62 mS cm−1). The alkaline stability of the membranes was tested in 1 M KOH at 60 °C for 1000 h. QPE-bl-9–TMA exhibited the highest retention of the conductivity (58%), which was higher than that of the Tokuyama A201 anion exchange membrane (29%). The post stability test IR analyses suggested that the major degradation mechanism of the QPE-bl-9 membranes in alkaline solution involved the decomposition of the ammonium groups. The QPE-bl-9 membranes retained their mechanical stability after the stability test, as proved by DMA analyses.


Introduction

There has been an increasing demand for cleaner and better-performing energy conversion and storage systems. Fuel cells are one of the promising solutions, especially for electric vehicles, stationary and portable devices.1,2 In recent years, anion exchange membrane fuel cells (AEMFCs) have gained more attention due to the faster oxygen reduction reactions and less corrosion possibility of transition metals as electrocatalysts than those for proton exchange membrane fuel cells (PEMFCs).3,4 AEMs face the challenges of low ionic conductivities and chemical instability compared with PEMs. Therefore, highly conductive and chemically stable AEMs are in need for the practical applications of AEMFCs.

The chemical stability of AEMs depends not only on the cationic groups but also on the polymer main chains. A number of strategies have been proposed in the literature to explore stable cationic groups including ammonium,5 phosphonium,6 sulfonium,7 imidazolium,8 guanidinium,9 pyridinium,10 morpholinium,11 spiro-ammonium,12 and metal13 cations. Some are claimed to be stable under harsh conditions (e.g., concentrated alkaline solution) for substantial period of time, however, it seems that the stability of these cations is related with the polymer main chain structures. This complex situation makes the stability issues rather difficult to understand and often leads to different conclusions among different AEMs. In most cases, these cations were tethered with so-called engineering plastic polymers such as poly(phenylene oxide),14 polybenzimidazole,15 polyethylene,16 poly(ether ether ketone),17 polysulfone.18 Some of the other polymer designs have proved the effectiveness in improving the stability. Holdcroft et al. reported that hexamethyl-p-terphenylene based polybenzimidazole (HTM-PMBI-OH) achieved good chemical stability with no change in IEC and negligible nucleophilic displacement in 2 M KOD at 60 °C for 159 h.15 Fang et al. found that an AEM based on copolymer of 1-(4-vinylbenzyl)-3-methyl-imidazolium chloride ([VBMI]Cl) and styrene exhibited excellent stability in 10 M NaOH at 60 °C for 120 h.19 Hickner et al. found that polystyrene functionalized with benzyltrimethylammonium cations degraded at 231 h of the half-life when exposed to 20 equivalents of KOD at 80 °C. Poly(phenylene oxide) and poly(arylene ether sulfone) functionalized with the same cations degraded much faster (at 57.8 and 2.7 h, of the half-lives, respectively) probably because polar functional (ether, ketone, and sulfone) groups in the vicinity of the ammonium groups were more susceptible to the chemical attack by hydroxide ions.20 Hibbs et al. reported polyphenylene-based polymer with promising alkaline stability in strong alkaline conditions (4 M KOH at 90 °C over 14 days) especially when the polyphenylene contained hexamethylene spacer and trimethylammonium cations (5% loss of conductivity and no loss in IEC).21

More recently, we have developed partially fluorinated aromatic copolymer membranes containing oligophenylene moieties in the hydrophilic components (QPE-bl-9).22 QPE-bl-9 membrane with IEC = 2.0 mequiv. g−1 exhibited high hydroxide ion conductivity (138 mS cm−1 at 80 °C) and reasonable alkaline stability in 1 M KOH for 1000 h at 40 °C. The cationic group used in the preceding study was trimethylbenzyl ammonium group derived from trimethyl amine because of its easy synthesis. The aim of the present work is to search for optimum ammonium groups for the QPE-bl-9 membranes in terms of the ionic conductivity and alkaline stability. The oligophenylene rings as the hydrophilic components were functionalized with bulkier and/or π-conjugated ammonium groups. Properties comparison was carefully carried out including the post stability test analyses.

Materials and methods

Materials

Decafluorobiphenyl (DFBP), hexafluorobisphenol A (HFBPA), 4-chlorophenol (CP), 1,4-dichlorobenzene, 1,3-dichlorobenzene, bipyridine, dicyclohexylmethylamine (DCHMA), tributylamine (TBA), 1-methylimidazole (MIm), and 1,2-dimethylimidazole (DMIm) were purchased from TCI Inc. and used as received. Potassium carbonate, bis(1,5-cyclooctadiene)nickel(0) (Ni(cod)2), chloromethyl methyl ether (CMME), thionyl chloride (SOCl2), hydrochloric acid, potassium hydroxide, dimethyl sulfoxide (DMSO), N,N-dimethylformamide (DMF), anhydrous lithium bromide, and N,N-dimethylacetamide (DMAc) were purchased from Kanto Chemical Co. and used as received. 1,1,2,2-Tetrachloroethane (TCE) was purchased from Kanto Chemical Co. and dried over 4 Å molecular sieves (Kanto chemicals) before use. Zinc chloride tetrahydrofuran solution, 45% trimethylamine (TMA) aqueous solution, and dimethyl hexylamine (DMHA) were purchased from Sigma-Aldrich and used as received. 1,1,2,2-Tetrachloroethane-d2 (TCE-d2), dimethylsulfoxide-d6 with 0.03% TMS (DMSO-d6), and chloroform-d1 with 0.03% TMS (CDCl3) were purchased from Acros Organics and used as received. Tokuyama A201 AEM (IEC = 1.7 mequiv. g−1) was kindly supplied by Tokuyama Corp.

Synthesis of PE-bl-9

Oligomers 1 and DFBP-terminated telechelic oligomers 2 were synthesized according to the procedure described in the literature.5,22,23 A typical procedure for the copolymerization of 2 and dichlorobenzenes is as follows (X = 4, p[thin space (1/6-em)]:[thin space (1/6-em)]q[thin space (1/6-em)]:[thin space (1/6-em)]r = 1[thin space (1/6-em)]:[thin space (1/6-em)]2[thin space (1/6-em)]:[thin space (1/6-em)]8). A 100 mL round-bottomed flask equipped with mechanical stirrer under nitrogen atmosphere, was charged with oligomer 2 (0.60 g, 0.14 mmol), 1,4-dichlorobenzene (0.040 g, 0.27 mmol), 1,3-dichlorobenzene (0.16 g, 1.1 mmol), 2,2′-bipyridine (0.57 g, 3.6 mmol), and DMAc (20 mL). The mixture was heated at 80 °C to obtain a homogenous solution, to which Ni(cod)2 (1.0 g, 3.6 mmol) was added. After heating at 80 °C for 3 h, the mixture was cooled to room temperature and diluted with additional DMAc (10 mL). The mixture was poured dropwise into a large excess of diluted hydrochloric acid to precipitate a pale yellow powder. The crude product was washed with ultrapure water and methanol several times. Drying in vacuum oven at 60 °C provided PE-bl-9 in 92% yield.

Chloromethylation of PE-bl-9

A typical procedure for the preparation of CMPE-bl-9 (X = 4.17, p[thin space (1/6-em)]:[thin space (1/6-em)]q[thin space (1/6-em)]:[thin space (1/6-em)]r = 1[thin space (1/6-em)]:[thin space (1/6-em)]2.4[thin space (1/6-em)]:[thin space (1/6-em)]12.2) is as follows. A 100 mL round flask with a reflux condenser and a magnetic stirrer, was charged with PE-bl-9 (2.30 g, 0.53 mmol) and TCE (169 mL) under nitrogen atmosphere. The mixture was stirred to obtain a homogeneous solution, to which SOCl2 (12.34 mL), CMME (64.09 mL, 1.35 mol), and ZnCl2 (1.15 g, 8.46 mmol) were added. After the reaction at 80 °C for 24 h, the mixture was cooled to room temperature and poured dropwise into a large excess of methanol. The precipitated crude product was washed with hot methanol several times and dried in a vacuum oven at 60 °C overnight. The obtained CMPE-bl-9 (2.37 g) was dissolved in TCE (24 mL) and casted on to a flat glass plate. Drying the solution at 60 °C gave a membrane (50–100 μm thick).

Quaternization reactions

Two methods were carried out for the quaternization reactions.

(1) Membrane soaking in amine/ethanol solution (used for MIm, DMIm, DCHMA, and TBA): the CMPE-bl-9 membranes were immersed in 1.0 M of amines in ethanol (20 mL) at 60 °C for 48 h, washed with ethanol several times, and immersed in ethanol for 24 h to remove the excess amines. Then, the membranes were immersed in ultrapure water for 24 h prior to the ion conductivity measurements (Cl-form).

(2) Membrane soaking in amine aqueous solution (used for TMA and DMHA):

(a) In the case of TMA, CMPE-bl-9 membrane was immersed in 45% TMA aqueous solution at room temperature for 48 h. The obtained membrane was washed with diluted hydrochloric acid and ultrapure water, and dried at 60 °C in vacuum oven.

(b) In the case of DMHA, CMPE-bl-9 membrane was immersed in DMHA at 40 °C for 3 days. The obtained membrane was washed with diluted hydrochloric acid and ultrapure water, and dried at 60 °C in vacuum oven.

Ion exchange

The quaternized membranes were immersed in 1 M KOH aqueous solutions at 40 °C for 2 days to exchange the chloride ions to hydroxide ions. After the ion exchange, the membranes were washed with deionized water and stored in a closed vial containing deionized water.

Measurements

The prepared oligomers and polymers were characterized by 1H and 19F NMR spectra on a JEOL JNM-ECA/ECX500 using CDCl3, TCE-d2, or DMSO-d6 as a solvent and tetramethylsilane (TMS) as an internal reference. FT-IR spectra of the membranes were measured using JASCO FT/IR-6100. Molecular weights (Mw and Mn) were estimated via gel permeation chromatography (GPC) using a Shodex KF-805L or SB-803 column and a Jasco 805 UV detector with DMF containing 0.01 M lithium bromide as eluent and calibrated with standard polystyrene samples. For transmission electron microscopic (TEM) observation, the selected membranes were stained with tetrachloroplatinate ions by ion exchange of ammonium groups in 0.5 M potassium tetrachloroplatinate(II) aqueous solution, rinsed with deionized water, and dried in vacuum oven at 60 °C. The stained membranes were embedded in epoxy resin, cut into 50 nm thickness, and placed on a copper grid. Dynamic mechanical analysis (DMA) of the membranes was performed at 60% relative humidity (RH) in temperature range from room temperature to 95 °C at a heating rate of 1 °C min−1. Detailed procedures of these measurements were described in the literature.5

Determination of IEC values

Ion exchange capacities (IECs) were estimated from the 1H NMR spectra by the integral ratio of the methylene protons (8, 8′) relative to the sum of the aromatic protons (1, 2, 3, 4, 5, 6, 7, 9, and 10). IECs were also determined by Mohr titration method. About 50 mg of the membrane in hydroxide ion form was ion-exchanged to chloride ion form by immersing in 10% NaCl/4% HCl aqueous solution for 24 h and washed with deionized water. The membranes were immersed in 0.2 M NaNO3 for 24 h. NaNO3 solution including the membrane was titrated with 0.01 M AgNO3 in the presence of 1.6 mL of 0.25 M K2CrO4 as an indicator. Then, the membranes were recovered, washed with distilled water, dried in vacuum oven at 60 °C for 24 h, and weighed. The IEC was calculated from the equation: IEC (mequiv. g−1) = (molar amount of AgNO3 used for titration)/dry weight.

Water uptake and λ

The water uptake of the membranes in chloride ion form was measured by immersing the dry membrane samples in deionized water for 24 h, wiped quickly with a tissue paper to remove the surface water, and weighed immediately (Ww). The membranes were dried in vacuum oven at 80 °C overnight and weighed (Wd). The water uptake (WU, %) was calculated from the equation:
WU = (WwWd)/Wd × 100

The average number of absorbed water molecules per ammonium group, λ, was calculated from the measured WU and IEC from the equation:

λ = (WU/IEC × 18.015)

Conductivity measurements

Hydroxide ion conductivity of the membranes was measured in degassed, deionized water using AC impedance spectroscopy system (Solatron 1255B, Solatron Inc.). The corresponding resistances of the membranes were measured at 30, 40, 60 and 80 °C using a four-probe conductivity cell. The impedance plots were obtained in the frequency range from 1 to 105 Hz. The hydroxide ion conductivity (σ) was calculated from the equation, σ = L/RA, where L is the length between the inner electrodes (L = 1 cm), R is the resistance of the membranes, and A is the cross-sectional area of the membranes. The activation energies, Ea, were calculated from the slopes of Arrhenius plots (the logarithm of the conductivity versus 1000/T).

Stability test

The membranes in chloride ion form were immersed in deionized water for 24 h and the conductivity was measured as 0 h. Then, the membranes were immersed in 1 M KOH aqueous solution at 60 °C in a closed vial for 24, 48, 72, 96, 200, 300, 400, 500, 700, 1000 h. At the set time, the membranes were removed from the vial, washed and immersed in deionized water for 24 h prior to the hydroxide ion conductivity measurement.

Results and discussion

Synthesis of QPE-bl-9 with various ammonium groups

A series of quaternized copolymers, QPE-bl-9, based on partially fluorinated oligo(arylene ether) as a hydrophobic component and oligophenylene as a hydrophilic segments attached to a variety of ammonium groups, were successfully synthesized (Scheme 1). First, sequenced precursor copolymer, PE-bl-9, was prepared from oligomer 2 (Fig. S2) by Ullmann coupling copolymerization with 1,3-dichlorobenzene and 1,4-dichlorobenzene using Ni(cod)2 as a catalyst and DMAc as a solvent. The copolymerization reaction was achieved with feed ratio (X = 3–5, p[thin space (1/6-em)]:[thin space (1/6-em)]q[thin space (1/6-em)]:[thin space (1/6-em)]r = 1[thin space (1/6-em)]:[thin space (1/6-em)]2[thin space (1/6-em)]:[thin space (1/6-em)]8). The obtained copolymers were soluble in some organic solvents such as chloroform and DMF. The structure of the copolymers was confirmed by 1H and 19F NMR spectra (Fig. S3). The copolymers contained somewhat higher content of m-phenylene moieties than the targeted. Formation of high molecular weight copolymers was confirmed from GPC data (Fig. S4 and S5). Detailed characterization of the copolymers was reported in our previous paper.22
image file: c6ra03256g-s1.tif
Scheme 1 Synthesis of QPE-bl-9 with various ammonium groups.

The chloromethylated copolymers, CMPE-bl-9, were prepared via Friedel–Crafts chloromethylation reaction of PE-bl-9 with CMME (160 equiv. to phenylene rings in the oligophenylene segments) as a chloromethylating agent in the presence of SOCl2 (20 equiv. to phenylene rings) and ZnCl2 (1 equiv. to phenylene rings) in TCE at 80 °C for 24 h. The conditions were selected for shorter reaction time compared with our previous work, in which 5 days were needed to achieve the similar degree of chloromethylation.22 The chloromethylation reaction was selective and quantitative on the oligophenylene segments without unfavorable side reactions such as crosslinking. The GPC analyses showed high molecular weight CMPEs with no detectable degradation and side reactions (Fig. S5 and Table S1). The peak at longer retention time in PE-bl-9 was absent in CMPE-bl-9, suggesting that the purification process was effective for removing the lower molecular weight products (possible oligo(phenylene)s). The structure of CMPE-bl-9 was confirmed by 1H and 19F NMR spectra (Fig. S6). The broad peak at ca. 4.5 ppm in the 1H NMR spectrum was assigned to the methylene protons of the chloromethyl groups. The 19F NMR spectra did not show detectable changes between PE-bl-9 and CMPE-bl-9, suggesting that the fluorinated oligo(arylene ether) moieties were not chloromethylated. The degree of chloromethylation (DC) estimated from the 1H NMR spectra ranged from 0.23 to 0.87 chloromethyl groups per phenylene unit in the oligophenylene moieties. Casting CMPE-bl-9 solution in TCE provided transparent, colorless and bendable membranes.

The membranes were quaternized with various amines under different quaternization conditions depending on the molecular size, steric hindrance, and electronic structure of the amines. The tertiary amines investigated in this study included TMA as the smallest and the most common amine, DMHA with a pendant alkyl chain, MIm and DMIm as heterocyclic aromatics, and DCHMA and TBA as bulky and sterically hindered amines. First, we have optimized the quaternization reaction conditions for each amine (Table 1). The quaternization reaction was evaluated by the ion exchange capacity (IEC in mequiv. g−1) via titration, which was converted to the degree of quaternization (DQ) per phenylene unit in the oligophenylene moieties. CMPE-bl-9 was quaternized with TMA in aqueous solution and DMHA under neat (solvent free) conditions at the temperature depending on the amines. For TMA, room temperature was sufficient for reasonable degree of quaternization (DQ = 0.82). DMHA as larger and bulkier amine than TMA was not quaternized at room temperature. DQ was 0.52 even at 40 °C for DMHA. Polar solvents such as ethanol were used for the reaction, however, the DQ was comparable or lower than that under neat conditions (Table S2). In contrast, ethanol was effective as the solvent for the heterocyclic aromatic amines, MIm and DMIm (DMIm is a solid at room temperature), for the quaternization reaction at 60 °C to achieve 0.75 of DQ. Under the same conditions, however, DCHMA and TBA gave lower DQ (0.16 and 0.12, respectively). Changes in the copolymer composition did not help improve the quaternization reaction (Table S2). Many other attempts were carried out, such as changing the solvent and the stoichiometry, but were not so successful. Higher reaction temperature than 60 °C was not tried because of the possible degradation of the resulting ammonium groups.

Table 1 Quaternization conditions, IEC, WU and DQ of QPE-bl-9 membranes
CMPE-bl-9d Amine Temperature (°C) Solvent IECa (mequiv. g−1) DQb
a Determined by Mohr titration method.b Degree of quaternization (DQ) was calculated from the IEC.c No solvent was used.d Polymer compositions of CMPE-bl-9–A, B and E are indicated in Table S1.
A TMA r.t H2O 1.62 0.82
E DMHA 40 N/Sc 1.05 0.52
A MIm 60 EtOH 1.43 0.75
E DMIm 60 EtOH 1.38 0.75
B DCHMA 60 EtOH 0.20 0.16
B TBA 60 EtOH 0.15 0.12


The resulting quaternized copolymers, QPE-bl-9, were characterized by 1H NMR spectra. The 1H NMR spectra were measured for the copolymers in chloride ion form due to the poor solubility of the copolymers in hydroxide ion form. The conversion of the chloromethylene groups to the corresponding ammonium methylene groups was suggested, either by the shift of the methylene protons (8, 8′) from 4.5 ppm to 5.0–6.0 ppm for TMA, MIm and DMIm, or by the decrease of the methylene peak intensity for DMHA (Fig. S7–10). The chemical shift of the methylene protons was more pronounced in the cases of the heterocyclic aromatic ammonium groups (MIm and DMIm). QPE-bl-9–TBA and DCHMA were not soluble in any organic solvents even in the chloride ion forms, which prevented them from the NMR analyses. The characteristic peaks of each ammonium group were also confirmed. For QPE-bl-9–TMA, a singlet signal at 2.9 ppm was assigned to the methyl groups attached to the quaternary nitrogen atoms. For QPE-bl-9–MIm and QPE-bl-9–DMIm, the singlet peaks at 3.4 and 3.7 ppm, respectively, were assignable to the methyl groups attached to the imidazolium groups. The imidazolium protons were overlapped with the aromatic protons of the polymer main chains. The 1H NMR spectrum of QPE-bl-9–DMHA revealed a singlet signal at 2.9 ppm assignable to dimethyl groups, while protons for the hexyl groups were also detected at 0.9–2.4 ppm. We did not calculate the IECs from the 1H NMR spectra because the most peaks were broad and/or overlapped with other protons or the solvent. More accurate and reliable IECs were obtained by Mohr titration method as mentioned above.

Morphology

One of the effective approaches for achieving high hydroxide ion conductivity in AEMs is having interconnected ion channels associated with hydrophilic/hyrdrophobic phase separation. In this work, the phase-separated morphology was observed using the cross-sectional TEM images for QPE-bl-9–TMA, DMHA, DMIm, and MIm membranes with IEC values ranging from 1.02 to 1.60 mequiv. g−1 stained with tetrachloroplatinate ions (Fig. 1). The darker areas represent the hydrophilic domains containing ammonium tetrachloroplatinate groups and the brighter areas represent the hydrophobic domains. While these four QPE-bl-9 membranes showed phase separated morphology, their domain sizes differed. QPE-bl-9–DMHA exhibited slightly larger ionic clusters (ca. 2–3 nm in diameter) than those of QPE-bl-9–TMA (ca. 1.0–1.6 nm). The bulkier structure of DMHA groups was probably responsible for the formation of the larger ionic clusters. However, the ionic domains were somewhat in disorder and their connectivity seemed less efficient for QPE-bl-9–DMHA membrane. QPE-bl-9–DMIm and MIm membranes exhibited even smaller ionic clusters (ca. 0.7–1.0 nm), which were well-dispersed throughout the sight. It is considered that the flat imidazolium rings could stack themselves to cause such compact ionic domains.
image file: c6ra03256g-f1.tif
Fig. 1 TEM images of QPE-bl-9 membranes stained with tetrachloroplatinate ions. The IECs were 1.62 mequiv. g−1 (TMA), 1.02 mequiv. g−1 (DMHA), 1.05 mequiv. g−1 (DMIm), and 1.43 mequiv. g−1 (MIm).

Water uptake and anion conductivity

In order to investigate the effect of the ammonium groups on the membrane properties, water uptake was measured for QPE-bl-9–TMA, –DMHA, –MIm, –DMIm, –TBA, and –DCHMA membranes in chloride ion forms at 30 °C in water and was plotted as a function of IEC (Fig. 2a). As expected, the general trend was that the water uptake increased with increasing IECs for all series of the QPE-bl-9 membranes as a result of an increase in the hydrophilicity. QPE-bl-9–TMA membranes exhibited smaller water uptake than those of QPE-bl-9–MIm and DMIm membranes probably because of the smaller molecular size of TMA groups providing less free volume in the membrane. The water uptake was as high as 136% and 125% for –MIm (IEC = 1.43 mequiv. g−1) and DMIm (IEC = 1.38 mequiv. g−1), respectively, while that for –TMA was 76% (IEC = 1.62 mequiv. g−1). For QPE-bl-9–TBA and –DCHMA membranes, dependence of water uptake on IEC is not discussed because only low IEC membranes could be obtained as discussed above.
image file: c6ra03256g-f2.tif
Fig. 2 (a) Water uptake (WU) and (b) hydroxide ion conductivity of QPE-bl-9 membranes at 30 °C in water as a function of IEC. The maximum error in the conductivity was 2%.

Under the same conditions, the hydroxide ion conductivity was also measured and plotted as a function of IEC in Fig. 2b. Similar to the water uptake, the hydroxide ion conductivity increased with increasing IEC of the membranes. Despite its lower water uptake, QPE-bl-9–TMA membrane showed higher hydroxide ion conductivity than those of the other QPE-bl-9 membranes. The highest conductivity was 52 mS cm−1 at IEC = 1.62 mequiv. g−1. This conductivity was reasonable compared to the conductivities achieved in our previous work,22 taking into account the IEC values (22 mS cm−1 at 1.3 mequiv. g−1, 52 mS cm−1 at 1.8 mequiv. g−1, and 77 mS cm−1 at 2.0 mequiv. g−1). QPE-bl-9–DMHA and DMIm membranes were also highly conductive and these membranes showed a jump in the conductivity at a certain IEC value approximately higher than 1 mequiv. g−1. It is considered that the connectivity of ion conducting channels was improved around this IEC value. Such conductivity jump was not observed for QPE-bl-9–MIm membrane.

In Fig. 3 is re-plotted the hydroxide ion conductivity of the membranes at 30 °C as a function of number of water molecules absorbed per ammonium group (λ). QPE-bl-9–TMA membrane utilized the absorbed water molecules efficiently for hydroxide ion conduction as the high conductivity (52 mS cm−1) was achieved with low hydration number (λ = 26). The efficiency of water molecules for ion conduction was followed by QPE-bl-9–DMHA and –DMIm. These two membranes achieved high conductivity of 34 mS cm−1 at λ = 48 and 32 mS cm−1 at λ = 50, respectively. Tokuyama A201 membrane (IEC = 1.7 mequiv. g−1), a benchmark AEM, also showed good efficiency with high conductivity (30 mS cm−1) and low hydration number (λ = 22). The efficiency of water molecule for hydroxide ion conduction was similar for QPE-bl-9–TMA and Tokuyama A201 membranes taking their IEC values into account. The efficiency was low for the other membranes (QPE-bl-9–MIm, –TBA, and –DCHMA), and increase in λ did not contribute to improving the hydroxide ion conductivity.


image file: c6ra03256g-f3.tif
Fig. 3 Hydroxide ion conductivity of QPE-bl-9 membranes at 30 °C in water as a function of λ.

Fig. 4 shows the temperature dependence of the hydroxide ion conductivity of the QPE-bl-9 membranes in water. All membranes exhibited approximate Arrhenius-type temperature dependence of the conductivity up to 80 °C. QPE-bl-9–TMA with IEC = 1.62 mequiv. g−1 exhibited the highest conductivity (101 mS cm−1 at 80 °C), which was among the highest conductivities for aromatic copolymer-based AEMs with comparable IEC values (higher conductivity, 138 mS cm−1, was achieved with higher IEC = 2.0 mequiv. g−1 in our previous study22). For their relatively low IEC value, QPE-bl-9–DMHA (IEC = 1.02 mequiv. g−1) and –DMIm (IEC = 1.38 mequiv. g−1) membranes exhibited high hydroxide ion conductivities ranging from 32 to 62 mS cm−1. In contrast, QPE-bl-9–MIm with IEC = 1.43 mequiv. g−1 showed lower conductivity ranging from 10 to 19 mS cm−1 compared to those of the above-mentioned three membranes. Compared to Tokuyama A201 membrane whose conductivity ranged from 29 to 62 mS cm−1, QPE-bl-9–TMA was more conductive while QPE-bl-9–DMHA and DMIm were similar in the conductivity. The apparent activation energies (Ea) for the hydroxide ion conduction of the membranes were estimated from the slopes of the lines to be 11.7 kJ mol−1 for TMA, 11.6 kJ mol−1 for DMHA, 11.8 kJ mol−1 for MIm, 11.9 kJ mol−1 for DMIm, 14.6 kJ mol−1 for DCHMA, 13.0 kJ mol−1 for TBA, and 13.0 kJ cm−1 for Tokuyama A201. The Ea values were similar to those of our previous aromatic copolymer-based AEMs (11–14 kJ mol−1) suggesting that the differences in the ammonium groups do not practically affect the hydroxide ion conducting mechanism.5,22–24


image file: c6ra03256g-f4.tif
Fig. 4 Temperature dependence of the hydroxide ion conductivity of QPE-bl-9 membranes in water.

Alkaline and mechanical stability

The alkaline stability of the QPE-bl-9 membranes (in chloride ion form) was tested in 1 M KOH at 60 °C up to 1000 h and the change in the hydroxide ion conductivity was measured in water at 40 °C (Fig. 5). The hydroxide ion conductivity of all the membranes jumped in the first 24 h due to the ion exchange from chloride ion to more conductive hydroxide ion form. Then, the conductivity decreased gradually with the testing time. While the data contained certain errors due to the swelling of the membranes to change their thicknesses, it was concluded that QPE-bl-9–TMA exhibited the highest alkaline stability with the high ion conductivity (13.6 mS cm−1 and 20 mS cm−1 at IEC = 1.62 and 1.3 mequiv. g−1, respectively) after 1000 h. QPE-bl-9–DMHA also showed better stability than the other membranes.
image file: c6ra03256g-f5.tif
Fig. 5 Alkaline stability of QPE-bl-9 membranes at 60 °C (the conductivities at 40 °C in water are plotted as a function of testing time).

To understand better the alkaline stability of the membranes, the retention of the conductivity was plotted in Fig. 6, where the conductivity at each testing time was normalized using the maximum conductivity as 100%. The retention after 1000 h was 58% and 44% for TMA, 12% for DMHA, and 8% for DMIm, respectively. QPE-bl-9–MIm showed fast degradation within 24 h and retained only 3% of its maximum conductivity after 1000 h. QPE-bl-9–TBA and –DCHMA showed relatively high retention (23% and 11%, respectively) due to their low IEC values and thus low conductivities. Tokuyama A201 membrane was also tested under the same conditions and its ion conductivity and retention were 16.3 mS cm−1 and 29%, respectively, after 1000 h. The retention of the conductivity of QPE-bl-9–TMA was higher than that of Tokuyama A201 membrane.


image file: c6ra03256g-f6.tif
Fig. 6 Alkaline stability of QPE-bl-9 membranes at 60 °C (normalized conductivities at 40 °C in water are plotted as a function of testing time, where the maximum conductivities in Fig. 5 are defined as 100%).

For deeper discussion on the alkaline stability, the retention of the conductivities of QPE-bl-9 membranes after alkaline stability test are plotted as a function of the remaining conductivities after 1000 h (Fig. 7). QPE-bl-9–TMA showed the higher retention and higher remaining conductivity than those of the other membranes including Tokuyama A201. QPE-bl-9–DMHA and DMIm showed low remaining conductivity (4 mS cm−1 and 2 mS cm−1, respectively) and low retention after 1000 h (12% and 8%, respectively). QPE-bl-9–DCHMA and –TBA with bulkier ammonium groups were more or less similar to –DMHA and –DMIm. The results suggest that the trimethylammonium groups are the most promising for QPE-bl-9 membranes among the ammonium groups investigated.


image file: c6ra03256g-f7.tif
Fig. 7 The retention of hydroxide ion conductivity of QPE-bl-9 membranes after the alkaline stability test for 1000 h as a function of the remaining conductivity.

Since the post-test membrane was not completely soluble in organic solvents, NMR analyses were not available. FT-IR spectra were measured for QPE-bl-9–TMA and QPE-bl-9–MIm as the most and the least stable membranes and were compared before and after the alkaline stability test. As shown in Fig. 8a, the FT-IR spectrum of QPE-bl-9–TMA revealed only minor changes. Since the conductivity decreased, it is considered that the trimethylammonium groups were decomposed to some extent. The absorbance bands at 892 cm−1 assignable to C–N+ deformation vibration of the ammonium groups and at 1212 cm−1 assignable to C–N+ stretching vibration of aliphatic ammonium groups were lower in intensity for the post-test membrane than for the pristine membrane, supporting the above mentioned idea of the decomposition of the ammonium groups. The peak at 1609 cm−1 assignable to C–C stretching vibration of aromatic rings was slightly smaller for the post-test membrane than for the pristine membrane, suggesting minor degradation in the polymer main chain. On the other hand, the FT-IR spectrum of QPE-bl-9–MIm (Fig. 8b) showed major changes after the stability test. The changes included the disappearance of the peak at 1572 cm−1 assignable to in-plane asymmetric stretching vibration of the imidazole rings and the peak at 625 cm−1 assignable to out-of-plane bending vibration of the imidazole rings.25 Moreover, the lower intensity of the peak at 1212 cm−1 (C–N+ stretching vibration) indicates the degradation of the imidazolium rings and thus of the ammonium cations. The peak at 1609 cm−1 (C–C stretching vibration of aromatic rings) was very weak for the post-test membrane, suggesting the major degradation in the polymer main chain. Then, the post-test QPE-bl-9–DMHA membrane was also subjected to the IR analyses (Fig. 8c). Similar to QPE-bl-9–TMA, minor degradation in the polymer main chain was suggested by somewhat lower intensity of the peak at 1609 cm−1 assignable to C–C stretching vibration of the aromatic rings. The degradation of the ammonium groups was indicated by the lower intensity of the peak at 1212 cm−1 assignable to C–N stretching vibration of the aliphatic ammonium groups. The C–N+ stretching vibration could not be observed at 892 cm−1 for QPE-bl-9–DMHA membrane probably because of the overlapping with the larger peak at 829 cm−1. These changes in the IR spectra are well accountable for the changes in the conductivities and their retentions during the alkaline stability test.


image file: c6ra03256g-f8.tif
Fig. 8 FT-IR spectra of (a) QPE-bl-9–TMA, (b) QPE-bl-9–MIm and (c) QPE-bl-9–DMHA membranes before and after the stability test for 1000 h.

The mechanical stability of the QPE-bl-9 membranes was investigated through the dynamic mechanical analyses (DMA). The temperature dependence of the storage modulus (E′), loss modulus (E′′), and tan[thin space (1/6-em)]δ(E′′/E′) of the QPE-bl-9 membranes (in chloride or bicarbonate ion form) was measured at 60% RH (Fig. 9). The E′ and E′′ values were nearly constant for the pristine and post-test QPE-bl-9 membranes regardless of the different ammonium groups and IEC values. The results suggest that the DMA properties mainly reflect the main chain structure and that the main chain degradation in the alkaline stability test was not significant. This idea is not contradictory to the above mentioned conductivity and IR analyses, both of which implied that the decomposition of the ammonium groups were the major degradation modes for the QPE-bl-9 membranes. Nevertheless, the post-test QPE-bl-9–TMA and –DMHA membranes were less ductile and easier to break during the DMA measurements implying some main chain degradation.


image file: c6ra03256g-f9.tif
Fig. 9 DMA curves of QPE-bl-9 membranes at 60% RH as a function of temperature before and after the alkaline stability test.

Conclusions

Effect of the ammonium groups on the properties of anion exchange membranes has been investigated for aromatic copolymers containing oligophenylene as the hydrophilic component and partially fluorinated phenylene ether as the hydrophobic component (QPE-bl-9). Regardless of the differences in the ammonium groups, the QPE-bl-9 membranes exhibited similar phase-separated morphology based on the hydrophilic/hydrophobic differences in the polymer component. The size of the hydrophilic domains was in the order of bulky aliphatic ammonium groups (DMHA), small aliphatic ammonium groups (TMA), and flat imidazolium groups (MIm and DMIm). From the water uptake and hydroxide ion conductivity, it was concluded that QPE-bl-9–TMA utilized water molecules more efficiently (followed by –DMHA with a pendant hexyl group) than the other series of QPE-bl-9 membranes. The three membranes, QPE-bl-9–TMA (1.62 mequiv. g−1), –DMHA (1.02 mequiv. g−1) and –DMIm (1.38 mequiv. g−1), exhibited higher hydroxide ion conductivity than that of the benchmark Tokuyama A201 membrane (1.7 mequiv. g−1) taking the IEC values into account. The Ea values of the hydroxide ion conductivity in water were similar among those membranes and our previous aromatic copolymer-based AEMs (11–14 kJ mol−1), suggesting that the differences in the ammonium groups were unlikely to affect the ion conducting mechanism.

QPE-bl-9–TMA was the most stable among the tested groups in the alkaline stability test in 1 M KOH at 60 °C for 1000 h. The retention of the conductivity (58%) was higher than that of Tokuyama A201 (29%). Other QPE-bl-9 membranes showed the retention smaller than 12%. The post-test IR analyses revealed that the major degradation involved the decomposition of the ammonium groups, while minor main chain scission was also suggested. The mechanical stability tested by DMA analyses revealed that the E′ and E′′ values changed little after the alkaline stability test and were independent on the ammonium groups and IEC values. The results imply that the viscoelastic properties of QPE-bl-9 membranes mainly reflect the polymer main chain structure. From the present study, the trimethylammonium groups seem the most promising ammonium groups for QPE-bl-9 as AEMs.

Acknowledgements

This work was supported by CREST JST and by MEXT Japan through a Grant-in-Aid for Scientific Research (26289254). A. M. A. M. acknowledges the Egyptian Culture and Education Bureau for financial support.

Notes and references

  1. R. Borup, I. Meyers and P. Bryan, Chem. Rev., 2007, 107, 3904–3951 CrossRef CAS PubMed.
  2. H. Zhang and P. K. Shen, Chem. Soc. Rev., 2012, 41, 2382–2394 RSC.
  3. W. Xuemei, C. Wanting, Y. Xiaoming, H. Gaohong, W. Junjun, Z. Ying and Z. Xiaoping, J. Mater. Chem. A, 2014, 2, 12222–12231 Search PubMed.
  4. J. R. Varco and R. T. C. Slade, Fuel Cells, 2005, 5, 187–200 CrossRef.
  5. N. Yokota, H. Ono, J. Miyake, E. Nishino, K. Asazawa, M. Watanabe and K. Miyatake, ACS Appl. Mater. Interfaces, 2014, 6(19), 17044–17052 CAS.
  6. K. Noonan, K. Hugar, H. Kostalik, E. Lobkovsky, H. Abruna and G. Coates, J. Am. Chem. Soc., 2012, 134, 18161–18164 CrossRef CAS PubMed.
  7. B. Zhang, S. Gu, J. Wang, Y. Liu, A. Herring and Y. Yang, RSC Adv., 2012, 2, 12683–12685 RSC.
  8. B. Lin, H. Dong, Y. Li, Z. Si, F. Gu and F. Yang, Chem. Mater., 2013, 25, 1858–1867 CrossRef CAS.
  9. L. Liu, Q. Li, J. Dai, H. Wang, B. Jin and R. Bai, J. Membr. Sci., 2014, 453, 52–60 CrossRef CAS.
  10. J. Miyake, K. Fukasawa, M. Watanabe and K. Miyatake, J. Polym. Sci., Part A: Polym. Chem., 2014, 52, 383–389 CrossRef CAS.
  11. C. G. Morandi, R. Peach, M. H. Krieg and J. Kerres, J. Mater. Chem. A, 2015, 3, 1110–1120 CAS.
  12. T. H. Pham and P. Jannasch, ACS Macro Lett., 2015, 4, 1370–1375 CrossRef CAS.
  13. M. L. Disabb-Miller, Y. Zha, A. J. Declaro, M. Pawar, G. N. Tew and M. A. Hickner, Macromolecules, 2013, 46, 9279–9287 CrossRef CAS.
  14. J. Wang, H. Wei, S. Yang, H. Fang, P. Xu and Y. Ding, RSC Adv., 2015, 5, 93415–93422 RSC.
  15. A. G. Wright and S. Holdcroft, ACS Macro Lett., 2014, 3, 444–447 CrossRef CAS.
  16. M. Zhang, H. K. Kim, E. Chalcova, F. Mark, S. N. Lvov and T. C. M. Chung, Macromolecules, 2011, 44, 5937–5946 CrossRef CAS.
  17. X. Yang, S. Gu, G. He, X. Wu and J. Benziger, J. Power Sources, 2014, 250, 90–97 CrossRef.
  18. F. Zhang, H. Zhang and C. Qu, J. Mater. Chem., 2011, 21, 12744–12752 RSC.
  19. W. Li, J. Fang, M. Lv, C. Chen, X. Chi, Y. Yang and Y. Zhang, J. Mater. Chem., 2011, 21, 11340–11346 RSC.
  20. S. Nuñez and M. A. Hickner, ACS Macro Lett., 2013, 2, 49–52 CrossRef.
  21. M. R. Hibbs, J. Polym. Sci., Part B: Polym. Phys., 2013, 51, 1736–1742 CrossRef CAS.
  22. N. Yokota, M. Shimada, H. Ono, R. Akiyama, E. Nishino, K. Asazawa, J. Miyake, M. Watanabe and K. Miyatake, Macromolecules, 2014, 47, 8238–8246 CrossRef CAS.
  23. H. Ono, J. Miyake, B. Bae, M. Watanabe and K. Miyatake, Bull. Chem. Soc. Jpn., 2013, 86, 663–670 CrossRef CAS.
  24. M. Tanaka, K. Fukasawa, E. Nishino, S. Yamaguchi, K. Yamada, H. Tanaka, B. Bae, K. Miyatake and M. Watanabe, J. Am. Chem. Soc., 2011, 133, 10646–10654 CrossRef CAS PubMed.
  25. N. E. Heimer, R. E. Sesto, Z. Meng, J. S. Wilkes and W. R. Carpe, J. Mol. Liq., 2006, 124, 84–95 CrossRef CAS.

Footnote

Electronic supplementary information (ESI) available. See DOI: 10.1039/c6ra03256g

This journal is © The Royal Society of Chemistry 2016
Click here to see how this site uses Cookies. View our privacy policy here.