Design and development of an in situ synthesized layered double hydroxide structure of Fe-induced hydroxyapatite for drug carriers
Ayan Manna*a,
Sumit Pramanik*a,
Ashis Tripathya,
Zamri Radzib,
Ali Moradia,
Belinda Pingguan-Murphya and
Noor Azuan Abu Osman*a
aCentre for Applied Biomechanics, Department of Biomedical Engineering, Faculty of Engineering, University of Malaya, Kuala Lumpur – 50603, Malaysia. E-mail: ayanbabu@gmail.com; prsumit@gmail.com; prsumit@um.edu.my; azuan@um.edu.my; Fax: +603 7956 1378; Tel: +603 7967 5200
bDepartment of Paediatric Dentistry & Orthodontics, Faculty of Dentistry, University of Malaya, Kuala Lumpur – 50603, Malaysia
First published on 2nd March 2016
Abstract
Iron (Fe)-induced hydroxyapatite (HA) layered double hydroxides (LDH) with different concentrations of Fe (FH95 and FH85) were prepared by a novel in situ coprecipitation method. For the first time, LDH is intercalated with calcium cations (CaI2+) by producing Frenkel defects. The LDH structure was precisely characterized by thermogravimetric analysis and X-ray diffraction study. The exfoliation in the basal planes was also confirmed by high resolution transmission electron microscopy. Hydrophilicity and change in mass in vitro swelling in phosphate buffered saline (PBS) medium were characterized to check the wettability of the pellet samples in aqueous media. The morphological and elemental study of the carriers was done before and after aceclofenac (AF) drug loading by a field emission electron microscope. Interactions of AF with LDH drug carriers (FH85 and FH95) were studied by Fourier transforms infrared spectroscopy. The AF drug-release mechanism of these novel LDH carriers was diffusion. The AF drug loading efficiency and releasing criteria were found to be better in FH95 than the carrier FH85. The FH95 LDH carrier can store the AF drug and can release the drug in a controlled manner in aqueous medium of PBS under simulated body conditions. Furthermore, the newly developed LDH material is highly biocompatible as well as a potential drug carrier. Therefore, the developed LDH drug carrier could be a potential drug scavenger for non-steroidal anti-inflammatory drugs such as AF.
1. Introduction
The complete architecture, including morphology and chemical compositions of layered double hydroxides (LDH) is still quite complex. LDH is a kind of multifunctional material and hydrotalcite lamellar with exchangeable anions in the positive brucite-like interlayer. The general formula of LDH is [M2+M3+(OH)2]X+(Am−)x/m·nH2O where M2+ is a divalent cation, M3+ is a trivalent cation, and Am− is intercalated exchangeable anions or solvation molecules. The structure of LDH comprises octahedral M(OH)2 of brucite-like layers with an interlayer region containing charge compensating anions and solvation molecules.1 Partial substitution of M2+ into M3+ induces a positive charge in the layers. The induced positive charge is compensated by the presence of interlayer exchangeable anions. It has been used as a great scavenger of anions. LDH materials have widely been used as multifunctional materials, including flame retardant agents,2 catalytic support for hydrogenation and oxidation,3 differentiation of nuclear materials for waste management, and so on.4 However, they have not been properly explored in biomedical or biotechnological applications due to the lower biocompatibility of existing LDH materials. Recently, it has been attempted to use as potential biomolecules scavenger of deoxyribonucleic acid (DNA) in many advanced drug delivery and biotechnological applications owing to their special lamellar structures and colloidal stability.5,6 The drug carrier must have excellent binding interactions with organics, biomolecules or microorganisms and proper swelling, degradation or erosion properties.7,8 The calcium phosphates (CaPs) nanoparticles have widely been attracted to be a potential carrier of non-viral gene delivery for delivering plasmid DNA (pDNA) into cells.9–11 In this context, hydroxyapatite (HA), chemical formula of Ca(II)6Ca(I)4(PO4)6·(OH)2 is one of the best biocompatible CaPs ceramics,12,13 has excellent ability to adsorb biomolecules,14 organics and biopolymers.11,15–19 Recently, HA has also shown good ion exchange properties20,21 and excellent binding ability with drugs or prodrugs.22 However, no work has been explored with complete success on synthesis and characterization of LDH structure using HA till date. Furthermore, pure HA doesn't have LDH structure. Therefore, it must be induced with some other trivalent cations. In this regard, trivalent cation of iron (Fe3+) could possibly be used to produce LDH structure of HA.2 Iron oxides, including hematite (Fe2O3) functionalized with organic or inorganic materials have also been used as biocompatible nanoparticles (NPs) for magnetic resonance imaging (MRI) applications.23–25 However, the iron oxide NPs always have to be coated with some magnetically inert suitable ligands for sending it to the target organs. In this instance, HA would be most suitable coating material since it has high affinity to biomolecules. At the same time, the trivalent cation of iron (Fe3+) can also able to induce in the hexagonal structure of HA to influence the LDH structure that will be extremely useful for multifunctional applications including drug delivery since iron uptake can easily be done by apatite material by octahedral co-ordinations with the oxygen atoms.12,25,26Aceclofenac (AF), chemical formula of C16H13Cl2NO4 (2-(2-(2-((2,6-dichlorophenyl)amino)phenyl)acetyl)oxyacetic acid), a non-steroidal anti-inflammatory drug (NSAID), has widely been used as higher inflammatory drug.27 It inhibits the secretion of cyclooxygenase-2 (COX-2) enzyme, which is responsible for inflammation and pain. The aceclofenac has widely been used for the treatment of ankylosing spondylitis, rheumatoid arthritis and osteoarthritis.28,29 However, it exhibits limited and variable oral bioavailability owing to its poor solubility in water, gastric fluids, and many body fluids. Thus, its oral absorption and dissolution rates are poor.30 Therefore, it needs significant enhancement of solubility in aqueous medium for increasing bioavailability. Plenty of techniques such as microemulsions,31–33 micronization,28,33 cyclodextrin complexation,34 use of surfactants and solubilizers,35 solid dispersion in water soluble and dispersible carriers,36 use of salts, prodrugs and polymorphs which exhibit high solubility,37 and self-emulsifying micro- and nano-dispersed systems38–40 have been used to enhance the solubility, dissolution rate, loading efficiency, bioavailability and essentially drug release rate kinetics of this poorly soluble drug till date. However, no method could able to improve the controlled drug release properties, such as solubility and the loading efficiency successfully at physiological condition.41,42
Therefore, the main objective of this study is to develop a suitable novel functional biocompatible LDH material as excipient for potential drug delivery scavenger. The present study aims to develop a LDH structured material of Fe induced HA. It's physical structure will be characterized and the potential properties will be evaluated by an in vitro drug releasing as well as biocompatibility studies. The drug will be modified with proper organic solvent to disperse homogeneously in the novel scavenger and dissolve easily it in aqueous media by enhancing the solubility and drug release rate of a poor water soluble drug at in vitro physiological conditions for large scale industrial use. Therefore, the prediction of diffusion mechanism of the novel functional LDH carriers of Fe-induced HA synthesized by in situ co-precipitation for the modified AF is explored in the present study.
2. Experimental
2.1. Synthesis of Fe-induced hydroxyapatite LDH carrier
The raw materials involved in this study were calcium oxide (CaO), orthophosphoric acid (H3PO4) and ferric oxide (Fe2O3) supplied by Fisher Scientific (M), were used without any further treatment. Pristine hydroxyapatite with acicular, crystalline, and nano-sized structure was synthesized using chemical precipitation technique as reported previously.43 The probable reaction of pristine HA is shown in reaction (1). The volume ratio 2![[thin space (1/6-em)]](https://www.rsc.org/images/entities/char_2009.gif) :
:![[thin space (1/6-em)]](https://www.rsc.org/images/entities/char_2009.gif) 1 (v/v) of 0.893 M CaO and 0.755 M H3PO4 was used to produce pristine HA. Using an in situ coprecipitation technique, a precursor of CaO and Fe2O3 was prepared in 200 ml volume of distilled water and was stirred constantly at 600 rpm using a magnetic stirrer (Thermo-Line) at 50 °C. The proper amounts of CaO and Fe2O3 were selected to determine the percentage of iron (Fe) that would be induced in HA for two different LDH carriers, carrier-1 and carrier-2. A separate aqueous solution of H3PO4 was prepared using continuous stirring at 600 rpm by magnetic stirrer at 25 °C. The 0.094 M and 0.028 M of Fe2O3 were dry mixed separately with 0.893 M CaO to prepare the two different carriers, namely carrier-1 which was expected to have 85 wt% HA (denoted as FH85) and carrier-2 which was expected to have 95 wt% HA (denoted as FH95), respectively. Both Fe2O3 mixed CaO solutions were titrated separately with 2
1 (v/v) of 0.893 M CaO and 0.755 M H3PO4 was used to produce pristine HA. Using an in situ coprecipitation technique, a precursor of CaO and Fe2O3 was prepared in 200 ml volume of distilled water and was stirred constantly at 600 rpm using a magnetic stirrer (Thermo-Line) at 50 °C. The proper amounts of CaO and Fe2O3 were selected to determine the percentage of iron (Fe) that would be induced in HA for two different LDH carriers, carrier-1 and carrier-2. A separate aqueous solution of H3PO4 was prepared using continuous stirring at 600 rpm by magnetic stirrer at 25 °C. The 0.094 M and 0.028 M of Fe2O3 were dry mixed separately with 0.893 M CaO to prepare the two different carriers, namely carrier-1 which was expected to have 85 wt% HA (denoted as FH85) and carrier-2 which was expected to have 95 wt% HA (denoted as FH95), respectively. Both Fe2O3 mixed CaO solutions were titrated separately with 2![[thin space (1/6-em)]](https://www.rsc.org/images/entities/char_2009.gif) :
:![[thin space (1/6-em)]](https://www.rsc.org/images/entities/char_2009.gif) 1 (v/v) of 0.755 M H3PO4 for the two different carriers such as carrier-1 (FH85) and carrier-2 (FH95). The 100 ml H3PO4 aqueous solution was then added drop-wise into the prepared precursors of CaO–Fe2O3 with a dropping rate of 1.7 ml min−1 at 25 °C with a constant stirring of 800 rpm using magnetic stirrer. The pH of the mixture during titration was kept in between 9.5 and 11.5 in order to minimize the formation of other phases of phosphate such as octacalcium phosphate, dicalcium phosphate, and tricalcium phosphates. After 1 h of titration, the mixture was vigorously stirred at 1200 rpm for 6 h at 50 °C on magnetic stirrer to make sure that the two solutions were reacted completely. In order to get the LDH of Fe-induced HA in powder form, excess water of the homogenous solution was evaporated without any filtration at 120 °C for 6 h in hot plate, and then it was dried in the oven (Memmet, Naluri Scientific) at 80 °C for 16 h. Whereas, to get the HA in powder form, the homogenous solution was filtered using filter paper to separate the precipitation and excess water, and then the sample was dried in the oven for 16 h at 80 °C. The probable reaction of this coprecipitation method to prepare LDH of Fe-induced HA is depicted in reaction (2). It indicates that CaI2+ ions of HA are replaced by Fe3+ ions of Fe2O3. The loosely bound free CaI2+ ions are indicated in the reaction (2) by small dotted-line. The substitute Fe3+ ion is similar to the M3+ cation, which is generally located in the conventional LDH materials.1
1 (v/v) of 0.755 M H3PO4 for the two different carriers such as carrier-1 (FH85) and carrier-2 (FH95). The 100 ml H3PO4 aqueous solution was then added drop-wise into the prepared precursors of CaO–Fe2O3 with a dropping rate of 1.7 ml min−1 at 25 °C with a constant stirring of 800 rpm using magnetic stirrer. The pH of the mixture during titration was kept in between 9.5 and 11.5 in order to minimize the formation of other phases of phosphate such as octacalcium phosphate, dicalcium phosphate, and tricalcium phosphates. After 1 h of titration, the mixture was vigorously stirred at 1200 rpm for 6 h at 50 °C on magnetic stirrer to make sure that the two solutions were reacted completely. In order to get the LDH of Fe-induced HA in powder form, excess water of the homogenous solution was evaporated without any filtration at 120 °C for 6 h in hot plate, and then it was dried in the oven (Memmet, Naluri Scientific) at 80 °C for 16 h. Whereas, to get the HA in powder form, the homogenous solution was filtered using filter paper to separate the precipitation and excess water, and then the sample was dried in the oven for 16 h at 80 °C. The probable reaction of this coprecipitation method to prepare LDH of Fe-induced HA is depicted in reaction (2). It indicates that CaI2+ ions of HA are replaced by Fe3+ ions of Fe2O3. The loosely bound free CaI2+ ions are indicated in the reaction (2) by small dotted-line. The substitute Fe3+ ion is similar to the M3+ cation, which is generally located in the conventional LDH materials.1| 5CaO + 3H3PO4 → Ca5(PO4)3OH + 4H2O | (1) |
| 10CaO + 6H3PO4 + δFe2O3 → (2δCaI2+)⋯Ca10−2δFe2δ(PO4)6(OH)2 + 8H2O + 3δO2− | (2) |
2.2. Loading of aceclofenac in the prepared LDH carrier
The aceclofenac (C16H13Cl2NO4) raw drug supplied by Sigma Aldrich was first homogeneously dissolved at a concentration 2 mg ml−1 in chloroform (CHCl3) with shaking for 20 min to modify the drug surface for improving the drug-carrier binding. Then the surface modified drug solution was added separately to the different carrier powders with a ratio of 120 mg ml−1 (drug![[thin space (1/6-em)]](https://www.rsc.org/images/entities/char_2009.gif) :
:![[thin space (1/6-em)]](https://www.rsc.org/images/entities/char_2009.gif) sample = 1
sample = 1![[thin space (1/6-em)]](https://www.rsc.org/images/entities/char_2009.gif) :
:![[thin space (1/6-em)]](https://www.rsc.org/images/entities/char_2009.gif) 60 (w/w)) in microtubes and then, they were kept for 24 h at 25 °C for completing the adsorption of drug. The drug loaded carrier samples were then used for drug releasing study. The probable drug-loaded compound after aceclofenac drug adsorption in the Fe-induced HA is depicted in reaction (3). It indicates that replaced free CaI2+ ions can make weak or ionic bond with OH or Cl groups of aceclofenac drug and the OH group of HA can form hydrogen bond with the NH group of aceclofenac. The replaced loosely bound free CaI2+ ions are indicated in the reaction (3) with small dotted line. Therefore, the drug loaded compound can release drug with controlled manner by hydrolysis in a suitable environment.
60 (w/w)) in microtubes and then, they were kept for 24 h at 25 °C for completing the adsorption of drug. The drug loaded carrier samples were then used for drug releasing study. The probable drug-loaded compound after aceclofenac drug adsorption in the Fe-induced HA is depicted in reaction (3). It indicates that replaced free CaI2+ ions can make weak or ionic bond with OH or Cl groups of aceclofenac drug and the OH group of HA can form hydrogen bond with the NH group of aceclofenac. The replaced loosely bound free CaI2+ ions are indicated in the reaction (3) with small dotted line. Therefore, the drug loaded compound can release drug with controlled manner by hydrolysis in a suitable environment.
 | (3) |
2.3. Characterizations
The crystallographic phase analysis of the powder samples was determined by using X-ray diffractometer (model: Empyrean, make: PANalytical BV) using CuKα radiation source of wave length λ = 1.54056 Å at room temperature. This test was done with a step scan of 0.002° and scan speed of 0.4° min−1. The crystallite size (D) was obtained using Debye Scherer expression eqn (4).44
 | (4) |
Thermogravimetric analysis (TGA) was performed to monitor the thermal stability of the samples using thermogravimetric analyzer (model: TGA/SDTA 851e Ultra Microbalance, make: Mettler Toledo). This test was done at temperature between 35 and 1000 °C in nitrogen atmosphere using a constant heating rate of 10 °C min−1.
The surface morphology of the samples was analysed by field emission scanning electron microscope (FESEM) (model: AURIGA, make: Carl ZEISS) with secondary electron scattering. The powder samples were sprinkled on aluminium stubs and examined without any further coating. The energy dispersive X-ray (EDX) analysis was performed using the detector equipped with FESEM.
Layer structure morphology of the two LDH samples (FH85 and FH95) was analysed by high resolution transmission scanning electron microscope (TEM) (model: LEO-Libra 120, make: Carl ZEISS AG).
Hydrophilicity of pellet samples, which were isostatically cold-compacted at 200 MPa, was determined using the static contact angle analysis by using sessile drop method45 in water contact angle (WCA) analyzer (model: OCA 15EC, make: Dataphysics). The syringe of this analyser was driven by motor at 25 °C with the drop volume set at 2 μl of distilled water. Hydrophilicity refers to the physical property of a material, which attracts aqueous substance easily. The material would be considered as highly hydrophilic when its WAC becomes as low as 90°.46 At least three similar specimens were tested for each sample to get the standard deviation (SD).
Swelling weight change test was performed on the compact pellet samples to determine the potentiality of the materials as drug delivery substance. This test was assayed in vitro by observing the weight change of the specimens after the immersion in phosphate buffer saline (PBS) of pH 7.6 at 37.4 °C for various periods of time in an incubator (LSI-3016, Labtech).47,48 Dry-weight of three pellets from each material was taken separately before immersing in the PBS solution. Then, wet-weights of the swelled pellets were taken at different selected time points such as 1, 3, 5, 10, 20, 30, 40, 50 and 60 min. The average and SD values were calculated from the three pellets for each time point. The change in swelling mass was calculated with respect to the initial dry-weight of the respective pellet.
Attenuated total reflectance-Fourier transform infrared (ATR-FTIR) spectrometer (model: FTIR-ATR 400, make: Perkin Elmer) was used to determine the molecular changes upon adding Fe2O3 into HA. The test was carried out on liquid form by dissolving the AF drug loaded FH85 and FH95 (drug![[thin space (1/6-em)]](https://www.rsc.org/images/entities/char_2009.gif) :
:![[thin space (1/6-em)]](https://www.rsc.org/images/entities/char_2009.gif) carrier = 1
carrier = 1![[thin space (1/6-em)]](https://www.rsc.org/images/entities/char_2009.gif) :
:![[thin space (1/6-em)]](https://www.rsc.org/images/entities/char_2009.gif) 60 (w/w)) in chloroform with a concentration 120 mg ml−1 and the data were recorded in the wavenumber range of 400–4000 cm−1 at a resolution of 4 cm−1. The drug content in liquid solution of each drug loaded carrier was 3.3% (w/v) for the FTIR study.
60 (w/w)) in chloroform with a concentration 120 mg ml−1 and the data were recorded in the wavenumber range of 400–4000 cm−1 at a resolution of 4 cm−1. The drug content in liquid solution of each drug loaded carrier was 3.3% (w/v) for the FTIR study.
In vitro drug releasing kinetic assay is extremely important before conducting any in vivo study. In vitro AF drug releasing assay was employed on both the drug loaded carriers separately in a freshly prepared standard PBS solution. The drug loaded materials were dispersed in the 1.2 ml PBS of pH 7.6 at 37.4 °C and 50 rpm in a shaking incubator (LSI-3016, Labtech) for upto 1 h. The concentration of the released drug in the solution was measured at time points of 0, 20, 30, 40, 50, and 60 min using ultraviolet-visible (UV-Vis) spectrophotometer (Cary 50 Probe, Varian). The 1.2 ml of the drug loaded carrier solution was added to 1.8 ml PBS and placed in a quartz cuvette (volume of 3 ml) to test in UV-Vis light in the wavelength range from 200 to 800 nm. A known concentration of only aceclofenac drug sample was assayed to evaluate the concentrations of released drug from the carriers at different time points with respect to its highest peak wavelength (λmax) at 275 nm.49 A freshly prepared PBS solution was tested as blank for all the samples. All data in drug releasing assays were average of three measurements at every time point for each sample.
To evaluate the potentiality of our best drug loaded carrier sample as biocompatible, an in vitro cell culture study was carried out on the human dermis fibroblast (HDF) cells which were harvested and isolated from the unused skin by outgrowth method according to our previous studies.15,50 The HDF cells of concentration 2 × 10⁴ cells per ml were prepared for cell proliferation tests of the FH95 and its drug loaded pellet (AF-FH95) scaffold (Φ 10 mm × 2 mm) samples as FH95 has shown best drug release property. All the samples including control (Thermanox™, specially made treated plastic coverslips for cell culture) were washed with 70% alcohol, followed by phosphate-buffered saline (PBS) at pH = 7.4 and then sterilized at 120 °C for 20 min in an autoclave (Omega 121/134, Prestige Medical) before seeding the HDF cells. The sterilized samples were rapidly soaked in 80 μl of freshly prepared chondrogenic Dulbecco's modification of Eagle's medium (DMEM) (Cellgro Mediatech) in 24-well plate and then incubated at 37 °C, 5% CO2 and 95% relative humidity (RH) environments for 24 h. In the present study, the thermanox was used as positive control culture (thermanox with cell) and one pellet scaffold of each sample was used as blank or negative control (scaffold without cell). The 20 μl of prepared concentration of HDF cells were successively seeded on the soaked surface of each scaffold and placed in CO2 incubator for 3 h to adhere the cells with the scaffolds' surfaces. Thereafter, 200 μl freshly prepared DMEM was added to the cell adhered scaffolds and kept in the CO2 humidified incubator for 7 days to assess the proliferated cellular activity of each specimen at the time points day-1, day-3 and day-7. The cultured medium was changed at every even day.
Then, a quantitative study was employed to check the cell proliferation using DNA-assay at three time points such as day-1, day-3 and day-7. At least five identical scaffolds were subjected to papain digestion for DNA-assay. The each specimen was digested in 1 ml of papain digest buffer (contained 0.01 M L-cysteine, 0.01 M Na2EDTA, and 0.125 mg ml−1 papain in 0.1 M sodium phosphate buffer) and incubated for overnight at 65 °C with intermittent agitations. Then, only the digested solution part was analysed for DNA containing using Hoechst 33258 dye (0.1 μl ml−1 in TEN buffer) with calf thymus DNA (Sigma-aldrich) as the standard. Plate reading was performed at a particular excitation (∼355 nm)/emission (∼460 nm) wavelength in a microplate reader (FLUOstar Optima, BMG Labtech). The DNA result was statistically analysed by One-way ANOVA at 95% confidence, which indicates the variance p > 0.05 for insignificant and p ≤ 0.05 significant.
A qualitative analysis was carried out to check the cell viability of the FH95 LDH and drug loaded AF-FH95 by live–dead cell assay using confocal laser scanning microscope (CLSM) (Leica TCS SP5 II). LIVE/DEAD® Viability/Cytotoxicity Kit obtained from Invitrogen, UK comprises of calcein-AM (4 mM in anhydrous dimethyl sulfoxide (DMSO)) and ethidium homodimer-1 (2 mM DMSO/H2O of 1![[thin space (1/6-em)]](https://www.rsc.org/images/entities/char_2009.gif) :
:![[thin space (1/6-em)]](https://www.rsc.org/images/entities/char_2009.gif) 4 (v/v)). Two dyes such as calcein AM (live strain, 1 μl) and ethidium homodimer-1 (dead strain, 2.5 μl) were mixed with 1 ml pre-heated PBS (at 38 °C for 16 h). The presence of live cells was distinguished in CLSM through green fluorescence due to staining of cytoplasm of live cells with calcein-AM, which possesses intracellular esterase activity. The existence of dead cells was discriminated by bright red fluorescence because of the nucleic acids of the dead cells stained by EthD-1 followed through defining damaged cell membrane. The cell seeded pellets were immersed briefly into 1 ml of dye solution, diluted with calcein-AM and ethidium homodimer-1 strains and incubated for 45 minutes at 37 °C in CO2 incubator. Thereafter, the stained samples were subjected to acquire CLSM.
4 (v/v)). Two dyes such as calcein AM (live strain, 1 μl) and ethidium homodimer-1 (dead strain, 2.5 μl) were mixed with 1 ml pre-heated PBS (at 38 °C for 16 h). The presence of live cells was distinguished in CLSM through green fluorescence due to staining of cytoplasm of live cells with calcein-AM, which possesses intracellular esterase activity. The existence of dead cells was discriminated by bright red fluorescence because of the nucleic acids of the dead cells stained by EthD-1 followed through defining damaged cell membrane. The cell seeded pellets were immersed briefly into 1 ml of dye solution, diluted with calcein-AM and ethidium homodimer-1 strains and incubated for 45 minutes at 37 °C in CO2 incubator. Thereafter, the stained samples were subjected to acquire CLSM.
3. Results and discussion
3.1. Determination of LDH structure by TGA
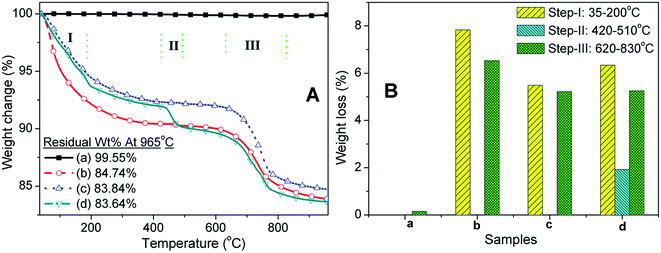
TGA is employed to identify the different amount of iron oxide content with HA for two different carriers. The weight change with increasing temperature for pristine as well as the carriers all the samples is depicted in Fig. 1A and the weight losses at three different steps for all the samples are depicted in Fig. 1B. The residual weight percentages (wt%) at the 965 °C for commercial Fe2O3, carrier-1, and carrier-2, and pristine HA was found as 99.55, 84.74, 83.84 and 83.64%, respectively (see Fig. 1A). This residual weight indicates the higher degradation of HA compared to commercial Fe2O3. The amounts of HA present in the carrier-1 (FH85) and carrier-2 (FH95) were calculated to nearly 85 and 95 wt%, respectively according to the previous reports.51,52 In other words, the induced iron oxide content present in the carrier-2 (FH95) and carrier-1 (FH85) would be 5 and 15 wt%, respectively. There was no noticeable weight change shown by Fe2O3 (see plot ‘a’ in Fig. 1A). However, HA clearly showed three-step weight losses such as step-I (up to 200 °C), step-II (between 420 and 510 °C) and step-III (between 620 and 830 °C) with the amount of 6.34, 1.92 and 5.25 wt%, respectively. The significant weight loss in the step-I is attributed to removal of adsorbed water and molecular hydroxyl (OH−) ions.43,53,54 The molecular anion is one of the most exchangeable anions in structure of apatite materials. Therefore, presence of molecular OH− anion in the developed carriers is a humbled indication of LDH structure. The weight loss in step-II is related to the phase change by loosing of Ca2+ ions from HA (see curve-d in Fig. 1A). Further, this loss was compensated after addition of Fe2O3 in HA for both the carrier materials (see curves b and c in Fig. 1A). It clearly indicates that the part of the CaI2+ ions was substituted by the Fe3+ ions. Another pronounced weight loss in step-III is attributed to the transformation of HPO42− from PO43− ions, dehydroxylation of remained molecular OH− and removing of carbon dioxide (CO2), which was adsorbed from the atmosphere.55–57 The step-III reaction would lead to form calcium deficient apatite at higher temperature.58–60 On the other hand, FH95 and FH85 showed only two step thermal degradation: step-I (7.83 and 5.49 wt%, respectively) and step-III (5.22 and 6.53 wt%, respectively) as clearly revealed in Fig. 1B. In contrast, FH00 showed no or neglected weight loss (<0.1%). The residual wt% present at end of the step-III indicates the incorporation of iron oxide in the HA structure and it increases with the increasing of Fe2O3 incorporation from 0.028 mole (in FH95) to 0.094 mole (in FH85) fractions.3.2. Determination of LDHs structure by XRD
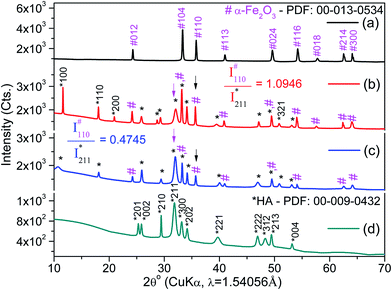
The XRD patterns of pristine Fe2O3, HA, and based on their two nanocarriers are depicted in Fig. 2. The XRD peaks of virgin apatite and commercial Fe2O3 were resembled closely with the XRD patterns of synthetic or natural HA43,56 and α-Fe2O3,61 respectively. The high intensity ratio at (110) plane of Fe2O3 ( ) to (211) plane of HA (IHA211) for FH85 of 1.0946 (see Fig. 2b) compared to FH95 of 0.4745 (see Fig. 2c) in dictates the more amount of Fe was induced in the HA for the carrier FH85. It is also strongly supported by our TGA study. The average crystallite sizes in α-Fe2O3 and pristine HA are calculated as 72.5 and 13.4 nm, respectively using eqn (4). However, the average crystallite sizes due to peaks of α-Fe2O3 and pristine HA are calculated as 72.5 and 13.5 nm for FH85 and 54.4 and 15.4 nm for FH95. The larger particle size of α-Fe2O3 compared to the HA was also seen in FESEM morphological study in Fig. 3.
The inter planer distance, d-spacing, for a significant (100) plane was found to be decreased with increasing of the Fe content in HA from FH95 (8.1585 Å) to FH85 (7.6248 Å) which was not clearly shown by our pristine HA but both the value were lower than the standard HA (8.1700 Å) according to PDF No. 00-009-0432. The contraction of d-spacing in [100] direction (in ‘a’-axis) clearly indicates that the Fe3+ ion, which has lower atomic radius compared to Ca2+ ion,62 has been incorporated at place of CaI2+ in the HA structure. This Fe3+ ion is similar to the M3+ ion generally present in the conventional LDH materials. On the other hand, the d-spacing for the basal planes (002) was found as 3.4132, 3.4416, and 3.4489 Å for pristine HA, FH95 and FH85, respectively. The d-spacing in the 002 direction (in c-axis) increases with increasing the Fe content in HA from FH95 to FH85 which are noticeably greater than pristine HA (3.4132 Å) at crystallite level. The spacing between the planes will also be confirmed at particle level by TEM study. This result clearly implies that replaced CaI2+ cations by the Fe3+ ions are occupied in between the basal planes (002) and exfoliate or expand the d-spacing in [002] direction. This exfoliation in basal planes is a clear proof of LDH formation for Fe-induced HA carriers.6 Therefore, for the first time, it clearly reveals that LDH is intercalated with free calcium cations (CaI2+) by producing Frankel defects. These substituted CaI2+ cations would allow the anions of foreign drug molecules or nucleic acids easily.
3.3. Morphological analysis
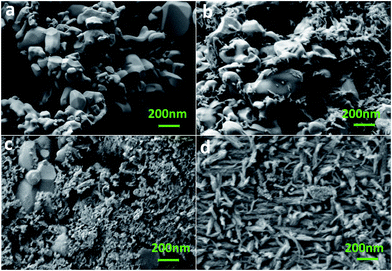
FESEM images of the α-Fe2O3, FH85, FH95, and HA powder samples are depicted in Fig. 3a–d, respectively. Morphological analysis has revealed that the average particle size of α-Fe2O3 was several times bigger than HA particle. This result strongly supports our XRD study. The α-Fe2O3 particles are spheroidal in shape of size 60–600 nm with an average size of 345.3 nm (see Fig. 3a). On the other hand, the HA particles of diameter 20–30 nm (average 26.8 nm) are acicular in shape with aspect ratio of 8–10 (see Fig. 3d). In both the LDH carriers, FH85 and FH95 it has been found that the HA particles are deposited on the α-Fe2O3 particles (see Fig. 3b and c). Since presence of HA in the carrier FH95 is more compared to the carrier FH85, the smaller size HA particles have more prone to be grown on the α-Fe2O3 particles. The growth of HA on the α-Fe2O3 particle surfaces is homogeneous in the carrier FH95, may help it to get proper binding with the drug molecules more easily. This homogeneous surface also can be confirmed by WCA measurement with highest wettability in the carrier FH95.EDX result depicted in Fig. 4 of the α-Fe2O3, FH85, FH95, and HA indicates the presence of different elements such as Ca, P, O, and Fe in both the LDH materials. It also indicates that the Fe content in the FH85 and FH95 2.2 at% and 0.8 at% is equivalent to 14.5 wt% and 5.3 wt% of Fe2O3 which strongly supports our TGA result. It can be noted that the Ca/P molar ratio is found to be decreased from FH95 (Ca/P = 1.64) to FH85 (Ca/P = 1.61) samples compared to the pure HA (Ca/P = 1.68) as the iron content was increased. It implies that more amounts of CaI2+ ions were substituted by Fe3+ ions with increasing Fe content in HA. Thus, it proves that both Ca2+ and Fe3+ ions are present in the newly developed LDH structured FH85 and FH95 carrier materials.
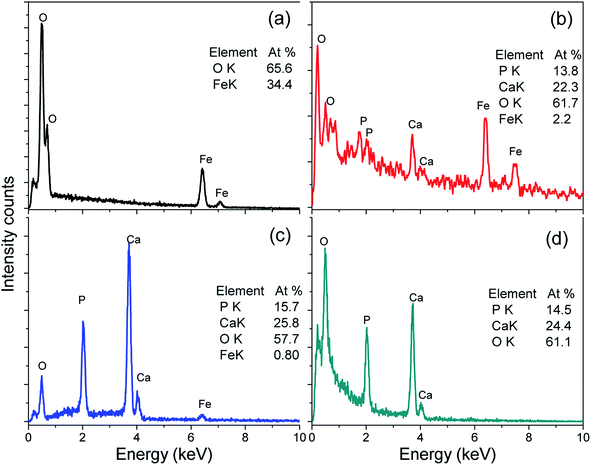 | ||
| Fig. 4 EDX spectra of (a) α-Fe2O3, (b) FH85, (c) FH95, and (d) HA. Note: both calcium and iron are present in the LDH structured FH85 and FH95; Ca/P ratio in both the carriers is lower than pure HA. | ||
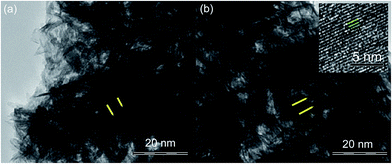
The layered structures in particle level for both the FH85 and FH95 LDH materials have been clearly observed in the transmission electron micrographs at higher magnification in Fig. 5. The layers with spacing between the planes was 0.4–4 nm. This minimum layer spacing (0.4 nm) is also higher the basal d-spacing of pure HA as found in our XRD study. This exfoliated basal spacing is well enough to deliver foreign biomolecules including drugs such as AF.63
3.4. Water contact angle test – superhydrophilic
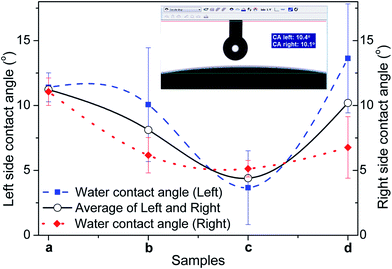
Fig. 6a–d represent the WCA values of the α-Fe2O3, FH85, FH95, and HA pellet samples, respectively. The inset image in Fig. 4 depicts a typical WCA measurement with left and right sides on a pellet sample. All the WCA values are much lower than 90°, indicate their super hydrophilic property. The WCA values of both the LDH carriers are noticeably lower than α-Fe2O3 and HA samples. It clearly indicates that the wettability of the carriers has been increased after induction of Fe in HA. The highest wettability of FH95 indicates that it would be highly responsible to make proper interface with the drug molecules in aqueous medium being present in the drug loaded scavengers.3.5. Drug release into PBS solutions
Swelling weight change of the α-Fe2O3, FH85, FH95, and HA at selected time point are depicted in Fig. 7. The commercial α-Fe2O3 has shown lowest swelling property (see Fig. 7a). All sample reached to the saturation at 10 to 20 min. It has been observed that the LDH carrier FH95 has highest rate of swelling as well as highest swelling weight change value. This result strongly supports our WCA study where FH95 had shown lowest WCA or highest wettability.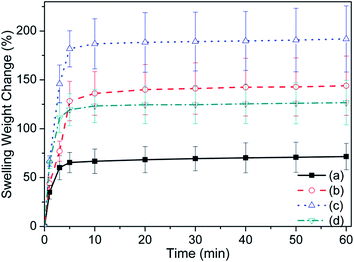 | ||
| Fig. 7 Swelling weight change of the samples (a) α-Fe2O3, (b) FH85, (c) FH95, and (d) HA increases with swelling time. | ||
3.6. Drug-carrier interaction by FTIR
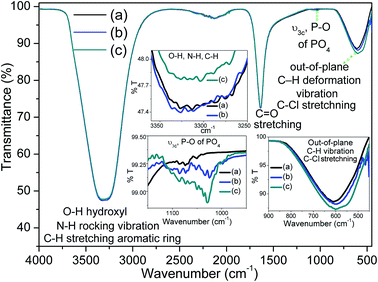
FTIR spectroscopy was used to study the drug loading property of the carrier. The aceclofenac drug modified with chloroform is depicted in Fig. 8a. A large brad peak around 3650–2800 cm−1 attributed to hydroxyl (OH), N–H rocking vibration, C–H stretching from aromatic ring of AF drug. The characteristic band became more broaden owing to overlapping of these peaks. A sharp long peak near 1642 cm−1 and broad small peak near 860–460 cm−1 indicate the C![[double bond, length as m-dash]](https://www.rsc.org/images/entities/char_e001.gif) O stretching and out-of-plane C–H vibration and 1,2 di-substituted C–Cl stretching from AF drug.64 All these peaks also resembled with other study.28,34,49 The drug loaded carriers FH85 and FH95 are also shown in Fig. 8b and c, respectively. A very small sharp peak near 1030 cm−1 found only in the two carriers FH85 and FH95 associated with ν3a P–O vibration from PO4, which is expectedly present in HA.43,65,66 Apparently, most of the peaks of both drug loaded carriers are very similar to the AF drug because all the samples were tested being dissolved in chloroform. However after precise analyses (see the insets in Fig. 8), it has been found that the carrier FH95 has higher transmittance peak value owing to ν3a P–O vibration from PO4 indicates the presence of higher amount of HA in comparison to the carrier FH85. Further, the higher peak value due to out-of-plane C–H vibration and C–Cl stretching from AF drug shown by the drug loaded FH95 indicates that higher amount of loaded drug is carried compared to the other drug loaded carrier FH85. On the other hand, lower peak value near 3650–2800 cm−1 attributed to hydroxyl (OH) for the FH95 carrier strongly indicates the more amount of anion exchanges has been occurred with the loaded drug which was already predicted for this LDH carrier from our TGA analysis. Since this peak is quite shifted to right (lower wavenumber) side, it also indicates that FH95 has more ability to form hydrogen bond (drug–H–N⋯H–O–HA) between the N–H group of AF drug and OH of HA.
O stretching and out-of-plane C–H vibration and 1,2 di-substituted C–Cl stretching from AF drug.64 All these peaks also resembled with other study.28,34,49 The drug loaded carriers FH85 and FH95 are also shown in Fig. 8b and c, respectively. A very small sharp peak near 1030 cm−1 found only in the two carriers FH85 and FH95 associated with ν3a P–O vibration from PO4, which is expectedly present in HA.43,65,66 Apparently, most of the peaks of both drug loaded carriers are very similar to the AF drug because all the samples were tested being dissolved in chloroform. However after precise analyses (see the insets in Fig. 8), it has been found that the carrier FH95 has higher transmittance peak value owing to ν3a P–O vibration from PO4 indicates the presence of higher amount of HA in comparison to the carrier FH85. Further, the higher peak value due to out-of-plane C–H vibration and C–Cl stretching from AF drug shown by the drug loaded FH95 indicates that higher amount of loaded drug is carried compared to the other drug loaded carrier FH85. On the other hand, lower peak value near 3650–2800 cm−1 attributed to hydroxyl (OH) for the FH95 carrier strongly indicates the more amount of anion exchanges has been occurred with the loaded drug which was already predicted for this LDH carrier from our TGA analysis. Since this peak is quite shifted to right (lower wavenumber) side, it also indicates that FH95 has more ability to form hydrogen bond (drug–H–N⋯H–O–HA) between the N–H group of AF drug and OH of HA.
3.7. Drug-carrier interaction particle morphology
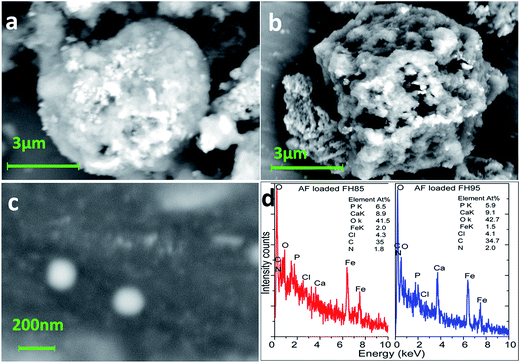
FESEM images of drug loaded carriers FH85, FH95 and AF drug particles are depicted in Fig. 9a–c, respectively. It has been found that drug loaded FH95 carrier particle has much rougher surface and pores compared to drug loaded FH85 carrier particle. It indicates that the more AF drug particles are bound with the FH95 carrier compared to FH85. The nanomedicine drug particles of size less than 100 nm (see Fig. 9c) can pass easily through the 200–500 nm pores of the FH95 carrier (see Fig. 9b) whereas most of the drug particles might be trapped by the higher concentration of Fe in the carrier FH85 and thus they are mainly adsorbed on the surface (see Fig. 9a). EDX result depicted in Fig. 9d reveals all the expected elements except hydrogen present in the aceclofenac (AF) drug loaded FH85 and FH95 LDH samples. It also indicates that the stoichiometric ratio (Ca/P = 1.67) of the HA was impeded significantly due to the substitution of Ca2+ ions by Fe3+ ions in the FH85 (Ca/P = 1.37) and FH95 (Ca/P = 1.54) LDH that might form weak bonding with the AF drug molecules. This result also partially supports the formation of LDH structure of FH85 and FH95 materials. Presence of AF drug was also significantly shown by the EDX analysis, which strongly supports the FESEM study.3.8. Drug release kinetic study
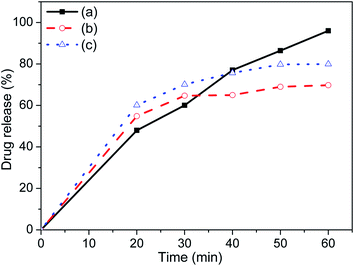
The UV-Vis absorption of known concentration aceclofenac drug with surface modified by chloroform was tested in PBS solution to get curve (see Fig. 10), which would be used as standard to measure the concentration of the drug release from the two carriers. The in vitro drug release (%) was calculated using drug concentration (Ct) in mg ml−1 present in the solution at a measured time (t) with respect to initial concentration (C0) used at time t = 0. It shows that both the carriers have better drug releasing ability up to 40 min compared to the without using any carrier as shown in Fig. 11. The drug releasing rate is higher and 60–70% release up to 30 min and it becomes saturated within 50 min for both the carrier. The amount of drug release with the same time and rate of drug release in this study is also significantly higher that other study.28 In comparison to FH85, the FH95 has faster and higher releasing properties which is extremely important inflammatory drug like aceclofenac. The drug releasing was still increasing after 60 min without carrier. It indicates the LDH carriers have better controlled released property.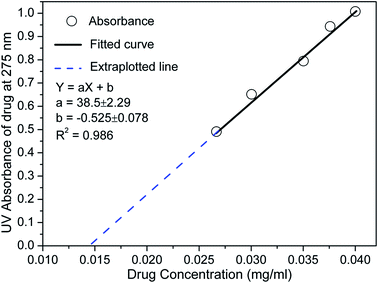 | ||
| Fig. 10 Absorbance with known concentration aceclofenac drug with surface modified by chloroform in PBS solution at their maxima of λmax ≈ 275 nm. | ||
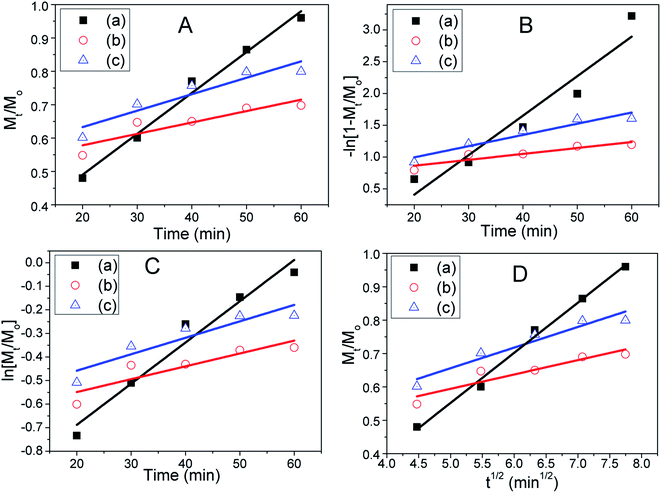
The drug release mechanism is analysed with kinetic study using four different model equations to ascertain the kinetic modelling of drug release as reported elsewhere.6 The data are fitted to zero order, pseudo first order, first order, and Higuchi model equations as depicted in Fig. 12A–D, respectively.6,34,49,67,68 The employed kinetic models and parameters of the fitted equations are illustrated in Table 1. The zero order kinetic depends on the ratio of drug amount (Mt) present in the solution at a measured time (t) to initial amount (mg) of drug (Mo) whereas “first order kinetic” depends on the logarithm of ratio of Mt to Mo. Higher linear correlation coefficient or regression values indicate better possibility of the predicted mechanism. Since the regression (R2) value of these drug loaded carriers is much closer to 1 in “zero order” kinetic compared to “first order”, this kinetic is more prone to be process independent. Further, it has been found that the regression values are closest to the 1 in Higuchi kinetic model, which strongly suggests that our drug release kinetic mainly follows surface diffusion or intraparticle diffusion mechanism.6,34,49,69 The Frenkel defects of this LDH material determined by our XRD study may take an important role to diffuse the drug particles faster. There is very lower possibility to follow the “pseudo first order” kinetic model since their R2 values are very poor.
| Kinetic model and parameter | Aceclofenac (AF) drug ± standard deviation (SD) | FH85 ± SD | FH95 ± SD |
|---|---|---|---|
| Zero order model: Mt/Mo ∞ Kot | |||
| Slope (K0) | 0.0122 ± 0.0008 | 0.0034 ± 0.0009 | 0.0049 ± 0.001 |
| Intercept | 0.2456 ± 0.0341 | 0.5099 ± 0.0386 | 0.5343 ± 0.0439 |
| Regression (R2) | 0.9829 | 0.7663 | 0.8435 |
![[thin space (1/6-em)]](https://www.rsc.org/images/entities/char_2009.gif) |
|||
| Pseudo first order model: −ln(1 − Mt/Mo) ∞ K2t | |||
| Slope (K2) | 0.0621 ± 0.0098 | 0.0093 ± 0.0022 | 0.0176 ± 0.0029 |
| Intercept | −0.8319 ± 0.4146 | 0.6777 ± 0.0924 | 0.6439 ± 0.1243 |
| Regression (R2) | 0.9078 | 0.8125 | 0.8980 |
![[thin space (1/6-em)]](https://www.rsc.org/images/entities/char_2009.gif) |
|||
| First order model: ln(Mt/Mo) ∞ K1t | |||
| Slope (K1) | 0.0175 ± 0.0019 | 0.0054 ± 0.0016 | 0.0069 ± 0.0016 |
| Intercept | −1.0383 ± 0.0818 | −0.6579 ± 0.0662 | −0.5976 ± 0.0683 |
| Regression (R2) | 0.9531 | 0.7376 | 0.8164 |
![[thin space (1/6-em)]](https://www.rsc.org/images/entities/char_2009.gif) |
|||
| Higuchi model: Mt/Mo ∞ KHt0.5 | |||
| Slope (KH) | 0.1503 ± 0.0070 | 0.0429 ± 0.0096 | 0.0618 ± 0.0099 |
| Intercept | −0.1996 ± 0.0444 | 0.3794 ± 0.0606 | 0.3468 ± 0.0628 |
| Regression (R2) | 0.9913 | 0.8271 | 0.9044 |
Drug loading efficiency (η%) was calculated using the eqn (5).68 At particular time points such as 20, 50 and 60 min, the drug loading efficiency was found to be 73, 66 and 65 for drug loaded FH85 carrier, and 70, 60 and 60 for drug loaded FH95 carrier, respectively. This result indicates that efficiency of the drug loaded FH95 carrier has greater efficiency than that of FH85.
 | (5) |
3.9. In vitro biocompatibility study
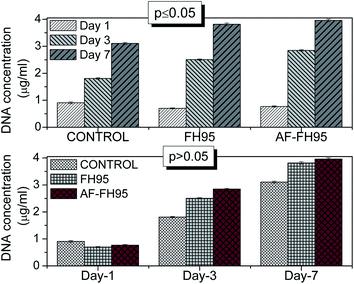
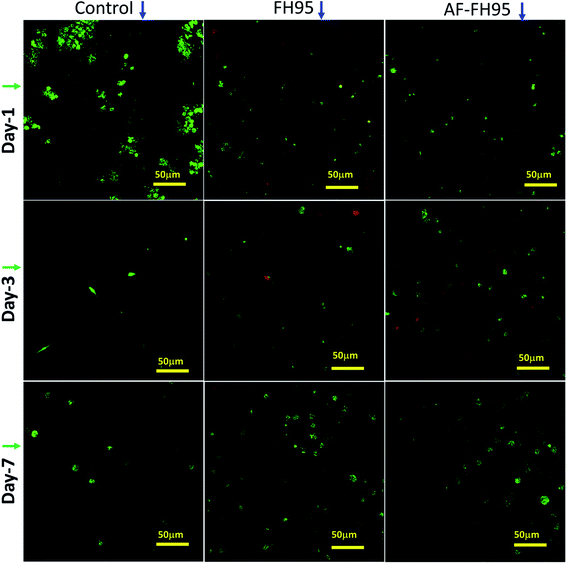
In order to evaluate the potential application of the newly developed LDH material as potential drug scavenger, an in vitro biocompatibility study has been performed on HDF cells. The DNA-assay result quantitatively indicates that the total number of DNA is significantly (p ≤ 0.05) increased with increasing the time point from day-1 to day-7 (see Fig. 13) for all the three samples. However, the amount of DNA is insignificant (p > 0.05) within a particular time point among the samples. This result clearly indicates that both FH95 and drug loaded (AF-FH95) LDH samples have similar type cell proliferation properties.The confocal micrographs of the samples indicate the quantitative live–dead cell present in the specimen (see Fig. 14). Number of green cells increases with cell culture time points from day-1 to day-7. This result supports our DNA-assay. It can be seen that the number of green cells present in the FH95 (see 2nd column in Fig. 14) and AF-FH95 (see 3rd column in Fig. 14) samples are larger than our positive control thermanox (see 1st column in Fig. 14). Furthermore, the number of green (live) cells is more or in other words, number of red (dead) cells is less in drug loaded LDH carrier (AF-FH95) compared to bare LDH carrier (FH95). This result is obtained might be owing to the influence of diffused drugs from the drug loaded carrier. Therefore, the biocompatibility study indicates that the newly developed LDH material is highly biocompatible as well as potential for drug carrier.
4. Conclusions
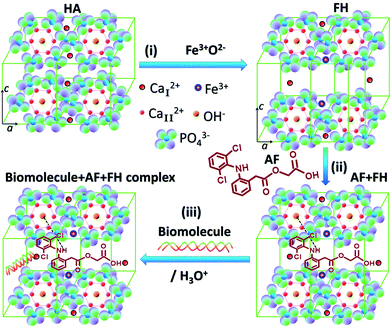
LDH of Fe-doped HA has successfully synthesized by in situ co-precipitation method. The TGA result has showed that both LDH carrier materials with different concentration of Fe content i.e., 5 wt% in FH95 and 15 wt% in FH85 have exchangeable OH− anions, which are generally situated at 0.06–0.94 of c-axis.13 Interestingly, first time this study showed that LDH material can also have cations (Ca2+) at the intercalated layer position as confirmed by XRD analysis in addition to the hydroxyl (OH−) and phosphate (PO43−) groups, which are already present as Am− anions. This free substituted Ca2+ cation would facilitate much attraction to anions from the foreign molecules. The exfoliation (0.4 nm) of intercalated layers in the basal direction of the LDH carries has been confirmed by HRTEM study. The important conclusion of the whole study is depicted in the Fig. 15. The first step of Fig. 15 depicts that the CaI2+ of HA molecules are substituted by Fe3+ ions. This is the first time we unveil that the LDH structure of HA is intercalated with cations (CaI2+) by producing Frenkel defects owing to influence of Fe3+ ions. Then, the second step in Fig. 15 shows that the electronegative parts of a drug molecule are intercalated in LDH structure and formed hydrogen bond with OH and ionic bond with the replaced Ca2+ cation of the drug carrier (FH85 or FH95). The third step of Fig. 15 indicates the drug releasing mechanism, which can be attributed either by hydrolysis (in this study) and/or by reaction with some other biomolecules.The in vitro drug releasing kinetics indicates that our newly developed biocompatible LDH carrier materials pursued surface diffusion or intra-particle diffusion mechanism as they followed Higuchi model. The Frenkel defects of these novel LDH materials, which have been inferred from the XRD analysis, might have taken an important role to diffuse the drug particles faster. The amount and drug released rate is considerably higher than other study.6,28,49 The AF drug loading efficiency and releasing criteria are better in the carrier FH95 compared to FH85. Therefore, we have reported that the LDH carrier FH95 of Fe-induced HA has ability to store the AF drug and controlled release in aqueous medium of PBS and under simulated body conditions, indicating its promising drug carrying properties for non-steroidal drugs. Furthermore, the newly developed LDH material is highly biocompatible as well as potential drug carrier.
Acknowledgements
This study was supported by UM/MOHE/HIR grant (Project numbers: D000014-16001).References
- Q. Wang and D. O'Hare, Chem. Rev., 2012, 112, 4124–4155 CrossRef CAS PubMed
.
- C. Jiao, X. Chen and J. Zhang, J. Fire Sci., 2009, 1–15 Search PubMed
.
- J. Feng, Y. He, Y. Liu, Y. Du and D. Li, Chem. Soc. Rev., 2015, 44, 5291–5319 RSC
.
- Y. Watanabe, T. Ikoma, H. Yamada, G. W. Stevens, Y. Moriyoshi, J. Tanaka and Y. Komatsu, J. Am. Ceram. Soc., 2010, 93, 1195–1200 CrossRef CAS
.
- J.-H. Choy, S.-Y. Kwak, Y.-J. Jeong and J.-S. Park, Angew. Chem., 2000, 39, 4041–4045 CrossRef
.
- Z. Gu, A. C. Thomas, Z. P. Xu, J. H. Campbell and G. Q. Lu, Chem. Mater., 2008, 20, 3715–3722 CrossRef CAS
.
- I. Yacoby, H. Bar and I. Benhar, Antimicrob. Agents Chemother., 2007, 51, 2156–2163 CrossRef CAS PubMed
.
- A. Tzur-Balter, Z. Shatsberg, M. Beckerman, E. Segal and N. Artzi, Nat. Commun., 2015, 6, 6208 CrossRef CAS PubMed
.
- E. V. Giger, J. Puigmartí-Luis, R. Schlatter, B. Castagner, P. S. Dittrich and J.-C. Leroux, J. Controlled Release, 2011, 150, 87–93 CrossRef CAS PubMed
.
- D. Olton, J. Li, M. E. Wilson, T. Rogers, J. Close, L. Huang, P. N. Kumta and C. Sfeir, Biomaterials, 2007, 28, 1267–1279 CrossRef CAS PubMed
.
- D. Lee, K. Upadhye and P. N. Kumta, Mater. Sci. Eng., B, 2012, 177, 289–302 CrossRef CAS
.
- C.-H. Hou, S.-M. Hou, Y.-S. Hsueh, J. Lin, H.-C. Wu and F.-H. Lin, Biomaterials, 2009, 30, 3956–3960 CrossRef CAS PubMed
.
- M. I. Kay, R. A. Young and A. S. Posner, Nature, 1964, 204, 1050–1052 CrossRef CAS PubMed
.
- Y. Han, X. Wang, H. Dai and S. Li, ACS Appl. Mater. Interfaces, 2012, 4, 4616–4622 CAS
.
- S. Pramanik, F. Ataollahi, B. Pingguan-Murphy, A. A. Oshkour and N. A. A. Osman, Sci. Rep., 2015, 5, 9806 CrossRef CAS PubMed
.
- D. Wahl and J. Czernuszka, Eur. Cells Mater., 2006, 11, 43–56 CAS
.
- L. C. Palmer, C. J. Newcomb, S. R. Kaltz, E. D. Spoerke and S. I. Stupp, Chem. Rev., 2008, 108, 4754–4783 CrossRef CAS PubMed
.
- J. Wang, W. Qin, X. Liu and H. Liu, RSC Adv., 2013, 3, 11132–11139 RSC
.
- S. Pramanik, B. Pingguan-Murphy and N. A. Abu Osman, Sci. Technol. Adv. Mater., 2012, 13, 043002 CrossRef
.
- J. F. Cawthray, A. L. Creagh, C. A. Haynes and C. Orvig, Inorg. Chem., 2015, 54, 1440–1445 CrossRef CAS PubMed
.
- U. Allenstein, S. Selle, M. Tadsen, C. Patzig, T. Höche, M. Zink and S. G. Mayr, ACS Appl. Mater. Interfaces, 2015, 7, 15331–15338 CAS
.
- K. Hochdörffer, K. Abu Ajaj, C. Schäfer-Obodozie and F. Kratz, J. Med. Chem., 2012, 55, 7502–7515 CrossRef PubMed
.
- E. Locatelli, L. Gil, L. L. Israel, L. Passoni, M. Naddaka, A. Pucci, T. Reese, V. Gomez-Vallejo, P. Milani and M. Matteoli, Int. J. Nanomed., 2012, 7, 6021 CAS
.
- E. Taboada, R. Solanas, E. Rodriguez, R. Weissleder and A. Roig, Adv. Funct. Mater., 2009, 19, 2319–2324 CrossRef CAS
.
- K. Gross, R. Jackson, J. Cashion and L. Rodriguez-Lorenzo, Eur. Cells Mater., 2002, 3, 114–117 Search PubMed
.
- E. Bauminger, S. Ofer, I. Gedalia, G. Horowitz and I. Mayer, Calcif. Tissue Int., 1985, 37, 386–389 CrossRef CAS PubMed
.
- A. K. Shah and S. A. Agnihotri, J. Controlled Release, 2011, 156, 281–296 CrossRef CAS PubMed
.
- P. D. Chaudhari, P. S. Uttekar, U. S. Desai and D. Pawar, Am. J. Pharm. Tech. Res., 2013, 3, 877–899 CAS
.
- E. Legrand, Expert Opin. Pharmacother., 2004, 5, 1347–1357 CrossRef CAS PubMed
.
- K. P. Chowdary and A. Sandhya Rani, Int. J. Pharma Sci. Res., 2011, 2, 124–129 CAS
.
- R. R. Shah, C. S. Magdum, S. S. Patil and N. S. Niakwade, Iran. J. Pharm. Res., 2010, 9, 5 CrossRef CAS
.
- V. Andrés-Guerrero, M. Zong, E. Ramsay, B. Rojas, S. Sarkhel, B. Gallego, R. de Hoz, A. I. Ramírez, J. J. Salazar, A. Triviño, J. M. Ramírez, E. M. del Amo, N. Cameron, B. de-las-Heras, A. Urtti, G. Mihov, A. Dias and R. Herrero-Vanrell, J. Controlled Release, 2015, 211, 105–117 CrossRef PubMed
.
- F. Shakeel, W. Ramadan and S. Shafiq, J. Bioequivalence Bioavailability, 2009, 1, 39–43 CAS
.
- K. Dua, K. Pabreja, M. Ramana and V. Lather, J. Pharm. BioAllied Sci., 2011, 3, 417 CrossRef CAS PubMed
.
- J. D. Modi and J. K. Patel, Int. J. Pharm. Pharm. Sci., 2011, 1, 6–12 Search PubMed
.
- K. Senthilkumar and Y. Sirisha, Int. J. Pharma Bio Sci., 2011, 2, 70–76 CAS
.
- A. H. Vadher, J. R. Parikh, R. H. Parikh and A. B. Solanki, AAPS PharmSciTech, 2009, 10, 606–614 CrossRef CAS PubMed
.
- S. R. Uppugalla, M. Rathnanand, P. Srinivas, K. Deepak, A. Kumar and S. Priya, J. Chem. Pharm. Res., 2011, 3, 280–289 CAS
.
- P. Patil, V. Patil and A. Paradkar, Acta Pharm., 2007, 57, 111–122 CrossRef CAS PubMed
.
- A. A. Date and M. Nagarsenker, Int. J. Pharm., 2007, 329, 166–172 CrossRef CAS PubMed
.
- A. Dabbagh, B. J. J. Abdullah, N. H. Abu Kasim, H. Abdullah and M. Hamdi, Int. J. Hyperthermia, 2015, 1–11 Search PubMed
.
- K. Kompany, E. H. Mirza, S. Hosseini, B. Pingguan-Murphy and I. Djordjevic, Mater. Lett., 2014, 126, 165–168 CrossRef CAS
.
- S. Pramanik and K. K. Kar, Int. J. Adv. Manuf. Tech., 2013, 66, 1181–1189 CrossRef
.
- P. Kamalanathan, S. Ramesh, L. T. Bang, A. Niakan, C. Y. Tan, J. Purbolaksono, H. Chandran and W. D. Teng, Ceram. Int., 2014, 40, 16349–16359 CrossRef CAS
.
- J. Rotta, R. Á. Ozório, A. M. Kehrwald, G. M. de Oliveira Barra, R. D. d. M. C. Amboni and P. L. M. Barreto, Mater. Sci. Eng., C, 2009, 29, 619–623 CrossRef CAS
.
- Y. Yuan and T. R. Lee, in Surf. Sci. Tech., Springer, 2013, pp. 3–34 Search PubMed
.
- C. Soundrapandian, B. Sa and S. Datta, AAPS PharmSciTech, 2009, 10, 1158–1171 CrossRef CAS PubMed
.
- F. M. Helaly and M. S. Hashem, J. Encapsulation Adsorpt. Sci., 2013, 3, 65–70 CrossRef
.
- S. Jana, S. Manna, A. K. Nayak, K. K. Sen and S. K. Basu, Colloids Surf., B, 2014, 114, 36–44 CrossRef CAS PubMed
.
- A. Moradi, F. Ataollahi, K. Sayar, S. Pramanik, P. P. Chong, A. A. Khalil, T. Kamarul and B. Pingguan-Murphy, J. Biomed. Mater. Res., Part A, 2016, 104, 245–256 CrossRef PubMed
.
- S. Pramanik, Ph.D. Thesis, Indian Institute of Technology (IIT), Kanpur, 2011
.
- K. K. Kar and S. Pramanik, US8652373 B2, February 18, 2014
.
- M. Salarian, W. Z. Xu, Z. Wang, T.-K. Sham and P. A. Charpentier, ACS Appl. Mater. Interfaces, 2014, 6, 16918–16931 CAS
.
- C.-J. Liao, F.-H. Lin, K.-S. Chen and J.-S. Sun, Biomaterials, 1999, 20, 1807–1813 CrossRef CAS PubMed
.
- A. A. White, I. A. Kinloch, A. H. Windle and S. M. Best, J. R. Soc., Interface, 2010, 7, S529–S539 CrossRef CAS PubMed
.
- S. Pramanik, B. Pingguan-Murphy, J. Cho and N. A. A. Osman, Sci. Rep., 2014, 4, 5843 CAS
.
- P. N. Kumta, C. Sfeir, D.-H. Lee, D. Olton and D. Choi, Acta Biomater., 2005, 1, 65–83 CrossRef PubMed
.
- C. Combes and C. Rey, Acta Biomater., 2010, 6, 3362–3378 CrossRef CAS PubMed
.
- T. I. Ivanova, O. V. Frank-Kamenetskaya, A. B. Kol'tsov and V. L. Ugolkov, J. Solid State Chem., 2001, 160, 340–349 CrossRef CAS
.
- A. Ito, S. Nakamura, H. Aoki, M. Akao, K. Teraoka, S. Tsutsumi, K. Onuma and T. Tateishi, J. Cryst. Growth, 1996, 163, 311–317 CrossRef CAS
.
- R. Han, W. Li, W. Pan, M. Zhu, D. Zhou and F.-s. Li, Sci. Rep., 2014, 4, 7493 CrossRef CAS PubMed
.
- R. Shannon, Acta Crystallogr., Sect. A: Cryst. Phys., Diffr., Theor. Gen. Crystallogr., 1976, 32, 751–767 CrossRef
.
- Z. Rezvani and M. Akbari, New J. Chem., 2015, 39, 5189–5196 RSC
.
- S. Jana, S. A. Ali, A. K. Nayak, K. K. Sen and S. K. Basu, Chem. Eng. Res. Des., 2014, 92, 2095–2105 CrossRef CAS
.
- K. Donadel, M. Laranjeira, V. L. Gonçalves, V. T. Fávere, J. C. De Lima and L. H. Prates, J. Am. Ceram. Soc., 2005, 88, 2230–2235 CrossRef CAS
.
- M. Jevtić, M. Mitrić, S. Škapin, B. Jančar, N. Ignjatović and D. Uskoković, Cryst. Growth Des., 2008, 8, 2217–2222 Search PubMed
.
- G. Zhang, W. Guan, H. Shen, X. Zhang, W. Fan, C. Lu, H. Bai, L. Xiao, W. Gu and W. Shi, Ind. Eng. Chem. Res., 2014, 53, 5443–5450 CrossRef CAS
.
- S. C. Yan, Z. S. Li and Z. G. Zou, Langmuir, 2010, 26, 3894–3901 CrossRef CAS PubMed
.
- J.-H. Yang, Y.-S. Han, M. Park, T. Park, S.-J. Hwang and J.-H. Choy, Chem. Mater., 2007, 19, 2679–2685 CrossRef CAS
.
| This journal is © The Royal Society of Chemistry 2016 |

