Enhanced anode performance of manganese oxides with petal-like microsphere structures by optimizing the sintering conditions

Wei Yua, Xiaojian Jiang*c, Fanhui Mengd, Zhonghua Zhange, Houyi Maa and Xizheng Liu*b
aKey Laboratory of Colloid and Interface Chemistry of State Education Ministry, School of Chemistry and Chemical Engineering, Shandong University, Jinan 250100, P. R. China
bTianjin Key Laboratory of Advanced Functional Porous Materials, School of Materials Science and Engineering, Tianjin University of Technology, Tianjin 300384, P. R. China. E-mail: xzliu@tjut.edu.cn
cXiamen Products Quality Supervision & Inspection Institute, Xiamen 361004, P. R. China. E-mail: 13869135108@163.com
dTianjin Lishen Battery Joint-stock Co. LTD, Tianjin 300384, P. R. China
eKey Laboratory for Liquid–Solid Structural Evolution and Processing of Materials, Ministry of Education, Shandong University, Jinan 250061, P. R. China

Received 2nd February 2016 , Accepted 29th March 2016

First published on 31st March 2016


Abstract

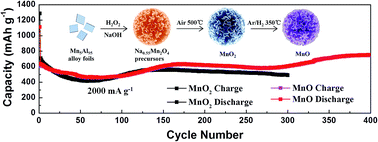
Herein, the rational design and synthesis of manganese oxides (MnO2 and MnO) have been achieved and both of them show petal-like microsphere structures. As anodes for LIBs, MnO exhibits a higher capacity of 751.4 mA h g−1 after 400 cycles (492.7 mA h g−1 for MnO2 after 300 cycles) at 2000 mA g−1.

Rechargeable lithium ion batteries (LIBs) have gained great market success in portable devices, electric vehicles, smart grids etc., due to their high energy density, high power density and low cost.1–4 Recently, transition metal oxides (MxOy, M = Mn,5,6 Fe,7,8 Co,9,10 etc.) have become promising alternatives for graphite as anodes due to their high reversible capacities.11,12 Among them, manganese oxides have attracted more attention because of the natural abundance, low cost and environmental benignity.13,14 However, the volume expansion during lithiation/delithiation usually leads to performance fading and prohibits their practical applications.15 Materials have usually been designed into micro/nano structures to enhance the electrochemical performance because the unique structure can provide more active sites for Li storage and transfer, shorten Li diffusion distance, as well as supply the high accommodation ability towards the volume expansion.16 Tremendous efforts have been paid on the fabrications of manganese oxides based electrode materials with different morphology and structural optimation.17 Deng et al. synthesized porous Mn2O3 microspheres by morphology-controlled decomposition of spherical MnCO3 precursors, showing a specific capacity of 796 mA h g−1 at 100 mA g−1 after 50 cycles.18 Yue et al. synthesized hollow MnO2, Mn3O4 and MnO nanospheres with 637, 820, and 1050 mA h g−1 at 500 mA g−1 after 150 cycles, respectively.19 Su et al. assembled hierarchical Mn2O3 hollow microspheres by solvent-thermal method, exhibiting a capacity of 580 mA h g−1 at 500 mA g−1 after 140 cycles.20 We have also built porous MnOx microspheres through a dealloying method with capacity of 757 mA h g−1 at 500 mA g−1 after 100 cycles.21 From the above results, besides the material morphology, the oxidation states of manganese in the electrode composites also have profound effects on the electrochemical performance. To fully understand the effect of Mn oxidation states on the reaction mechanism and electrochemical performance, it is highly urgent to distinguish it from the effect of material morphology and implement the controllable synthesis of manganese oxides. Since the similar energy level of Mn 3d orbitals, the oxidation state of Mn in the fabricated oxides can be easily disturbed by the synthesis conditions. Thus, it is still a challenge to rationally design and synthesize manganese oxide with an expected valence state.

In addition, manganese oxides are often synthesized by co-precipitation,22 hydrothermal,23 and template method,24 etc. These methods usually need surfactants, templates or heating (occasionally cold bath), and dealloying method, known as etching active species selectively from an alloy, has many advantages such as no surfactant assistance, mild conditions, convenience and rapid fabrication so that it attracts a wide spread attention in many fields such as catalysis and electrochemistry.25–27

In this work, we have prepared petal-like MnO2 and MnO microspheres using the same flower-like micro/nano-structure precursors by carefully optimizing the sintering conditions. The final products maintain the original morphology of the precursors, which provides good models for the study of Mn oxidation states effects. As anodes of LIBs, the MnO microspheres show better cycling and rate performance as a capacity of 751.4 mA h g−1 after 400 cycles at a current density of 2000 mA g−1. To disclose the performance improvement mechanism, the cycled electrodes have also been carefully studied.

The Na0.55Mn2O4 precursors were synthesized using a dealloying method as reported in our previous work,21 whose XRD pattern was shown in Fig. S1. Petal-like MnO2 microspheres were synthesized by heating the precursors at 500 °C for 2 h in air (temperature increasing rate of 1 °C min−1). The corresponding MnO microspheres were obtained by sintering the as-prepared MnO2 at 350 °C for 5 h in Ar/H2 at the same heating rate.

To understand the thermal decomposition routes of the Na0.55Mn2O4 precursors, TGA was performed in the temperature range of 30–700 °C at an increasing rate of 10 °C min−1 in flowing air (Fig. S2). The weight loss under 130 °C is due to the loss of absorbed and crystal water. The second weight loss step between the temperature of 130 and 536 °C is associated with the decomposition of Na0.55Mn2O4 precursors into MnO2. When the temperature is higher than 536 °C, the MnO2 transforms into Mn2O3 by releasing O2.28 This result provides the guideline for optimizing the sintering conditions.

The crystal structure and phase composition of fabricated materials were identified by XRD as shown in Fig. 1a. The body-centered tetragonal α-MnO2 phase (JCPDS no. 44-0141) was confirmed after first calcination at 500 °C (1 °C min−1) in air. Further calcining MnO2 in Ar/H2 at 350 °C for 5 h, the XRD patterns can be indexed as face-centered cubic MnO (JCPDS no. 07-0230). The diffraction peaks located at 34.91°, 40.547°, 58.722°, 70.176° and 73.793° can be indexed to the (111), (200), (220), (311) and (222) planes. The strong and sharp peaks indicate good crystallinity of the obtained MnO. HRTEM shown in Fig. 1b provides further insights into the structure information. The observed fringes correspond to the interplanar distance of 2.56 Å, indicating the (111) plane of MnO. XPS spectra were performed to study the elemental oxidation states. As the survey spectrum shown in Fig. 1c, it can be clearly seen that the sharp peaks of Mn and O indicate the high purity of material. From the high-resolution spectrum (Fig. 1d), the binding energies of Mn 2p1/2, Mn 2p3/2 are 652.8 and 641.3 eV, which demonstrate the +2 valence state of Mn in this material.29 The fabricated MnO2 was also subjected to HRTEM and XPS to further confirm the valence state. As shown in Fig. S3, the interplanar distance of 4.89 Å is associated with the (200) plane of MnO2. The two broad peaks centered at 654.2 and 642.3 eV are consistent with the oxidation state of +4 in MnO2.19,30


image file: c6ra03065c-f1.tif
Fig. 1 XRD patterns of MnO2 and MnO microspheres (a); HRTEM image (b), XPS spectra: survey spectrum (c) and high-resolution Mn 2p peaks spectrum (d) of MnO microspheres.

The morphology of the Na0.55Mn2O4 precursor, fabricated MnO2 and MnO is shown in Fig. 2. Before heat process, the Na0.55Mn2O4 precursors exhibit as hierarchical flowers-like micro/nano structures with a diameter of 1–2 μm which are composed of numerous nanosheets (Fig. 2a–c). After sintering at 500 °C (heating rate of 1 °C min−1) for 2 h in air, the nanosheets become slightly rough albeit the original flower morphology remains (Fig. 2d–f). The nanosheets composed microspheres turn into rod-like structures by changing the temperature increasing rate to 5 °C min−1 (Fig. S4a–c). The flower-like structures can not be maintained. Besides, with the temperature rise, partial MnO2 transforms into Mn2O3 together with the morphology changes (Fig. S4d–f). By further processing the MnO2 at 350 °C (1 °C min−1) for 5 h in Ar/H2, MnO was obtained and the morphology remains, as shown in Fig. 2g–i. Nitrogen adsorption–desorption isotherms and pore distribution curves of MnO2 and MnO are displayed in Fig. S5. The surface area, pore diameter and pore volume are 29.386 m2 g−1, 19.679 nm and 0.2556 cm3 g−1 for MnO2, and 29.289 m2 g−1, 19.648 nm and 0.2508 cm3 g−1 for MnO, respectively. The BET results are almost the same, revealing that MnO2 and MnO keep the same basic structures.


image file: c6ra03065c-f2.tif
Fig. 2 SEM images of precursor (a), MnO2 (d) and MnO (g) microspheres. TEM images of precursor (b and c), MnO2 (e and f) and MnO (h and i) microspheres.

Scheme of the synthesis process of manganese oxides with varied oxidation states at different sintering conditions is illustrated in Fig. 3. Flower-like precursors are synthesized through a dealloying method in the presence of H2O2 by the electrolyte-species-solid mechanism.21 After sintering at different conditions, the Na0.55Mn2O4 precursors transform into manganese oxides with different morphology and composition. Table 1 summarizes the heat processing conditions and species of final products. MnO2 is obtained by sintering the precursor at 500 °C for 2 h in air. The primary morphology can be preserved with a heating rate of 1 °C min−1. By further heat processing at 350 °C (1 °C min−1) for 5 h in Ar/H2, it turns into MnO with original flower-like structure. The porous MnOx microspheres (mixture of MnO and Mn3O4) are obtained by sintering the precursors at 300 °C for 5 h in Ar/H2.21 Therefore, the precise control of heat processing temperature and heating rate is the key to target synthesis of manganese oxides with certain oxidation state and morphology.


image file: c6ra03065c-f3.tif
Fig. 3 Scheme of the synthesis process of petal-like manganese oxides with varied oxidation states at different sintering conditions.
Table 1 Comparisons of MnO2/MnO petal-like microspheres and porous MnOx microspheres
Mn-based anode materials Sinter-ing step(s) Sintering conditions Morphology changes Phase Ref.
Porous MnOx micro-spheres 1 Ar/H2, 300 °C, 5 h, 5 °C min−1 Flower-like precursors → porous microspheres MnO & Mn3O4 21
MnO2/MnO petal-like micro-spheres 2 1st air, 500 °C, 2 h, 1 °C min−1 Remain unchanged MnO2 This work
2nd Ar/H2, 350 °C, 5 h, 1 °C min−1 Remain unchanged MnO This work


The accurate synthesis of MnO2 and MnO with the same morphology provides good opportunity to investigate the correlations of Li storage properties and Mn oxidation states. The prepared materials were fabricated into coin cells to study the electrochemical performance. Fig. 4a illustrates the CV curves of the MnO2 microsphere electrodes at the scanning rate of 0.1 mV s−1 in the range of 0.05–3.0 V. For the first cycle, a broad cathodic peak at 1.4–0.8 V (highlighted by arrow) could be corresponded to the reduction of MnO2 to Mn2+, while the appearance of an irreversible reduction peak at 0.11 V indicates the reduction of Mn2+ to Mn and the formation of layer.6 In the anodic sweep, two peaks at 1.23 V and 2.36 V (highlighted by arrow) could be attributed to the oxidation of Mn0 to Mn2+ and Mn2+ to Mn4+, respectively.6 Cathodic peak at 0.11 V in the subsequent cycles shifts positively, until 0.32 V in the 5th cycle. The increase of reduction potential can be ascribed to the structure reconstruction because of the formation of amorphous Li2O and Mn.6 The equation of total conversion reaction can be written as:11,30

 
MnO2 + 4Li+ + 4e ↔ Mn + 2Li2O (1)


image file: c6ra03065c-f4.tif
Fig. 4 CV curves of MnO2 (a) and MnO (b) microspheres at a scan rate of 0.1 mV s−1 between 0.05 and 3.0 V. (c) Discharge/charge profiles of MnO microspheres at 500 mA g−1 between 0.01 and 3.0 V. (d) The 100th discharge/charge profiles of MnO2, MnO and porous MnOx microspheres at a current density of 500 mA g−1 between 0.01 and 3.0 V. Cycling performance at a current density of 2000 mA g−1 (e) and rate capabilities at various current densities (100, 200, 500, 1000 mA g−1) (f) for MnO2 and MnO microspheres between 0.01 and 3.0 V.

The corresponding CV curves of MnO are shown in Fig. 4b. In the first cycle, the main irreversible cathodic peak at ∼0.1 V corresponds to the reduction of Mn2+ to Mn0 and the formation of SEI layer.13,31 Then cathodic peak shifts to 0.43 V from the 2nd cycle, indicating the irreversible phase transformation because of the formation of Li2O and Mn.13,31 In the anodic sweep, one main oxidation peak at 1.27 V can be attributed to the oxidation of Mn0 to Mn2+,13 and a weak oxidation peak at 2.16 V can be corresponded to the decomposition of the polymer/gel film on the surface of SEI layer at high oxidation potential (above 2.0 V).24,31 The total reaction can be described as:22,32

 
MnO + 2Li+ + 2e ↔ Mn + Li2O (2)

Both of the two samples show stable CV performance from the 4th cycle and almost overlap well with each other, demonstrating a good electrochemical reversibility and structural stability.

The electrochemical lithium storage properties of MnO2 and MnO microspheres are evaluated by galvanostatic discharge/charge performance in the voltage range of 0.01–3 V. The discharge/charge profiles of the MnO microspheres at a current density of 500 mA g−1 (Fig. 4c) exhibit a discharge capacity of 1094.1 mA h g−1 with a coulombic efficiency of 69.9% in the first cycle. This low coulombic efficiency is associated with the irreversible formation of a SEI layer.33 During the first lithiation process, the main plateau is at about 0.3 V, which is associated with the conversion of MnO to Mn, the formation of SEI layer and decomposition of electrolyte. It increases to 0.5 V from the second cycle. The main charge plateau is at about 1.25 V. The discharge and charge plateaus are well coincident with cathodic and anodic peaks in CV curves (Fig. 4b).

For clear comparison, Fig. 4d summarizes the discharge/charge profiles of MnO2, MnO and porous MnOx microspheres at the 100th cycle. At a current density of 500 mA g−1, the discharge capacities are 832.9, 921.4 and 757 mA h g−1, respectively. The petal-like MnO microspheres materials exhibit the highest reversible capacity and the best stability. To detailed study the structure stability during discharge/charge process, XRD patterns of MnO2 and MnO at different discharge and charge states (fresh electrode, half-discharged, full-discharged, half-charged and full-charged) were performed as shown in Fig. S6. After discharge–charge for one cycle, MnO can return to the original crystalline state, which is solid evidence that MnO is more stable than MnO2 as anodes. The fully charged samples have been subjected to SEM to investigate their morphology changes after charging as shown in Fig. S7. The morphology of MnO remained better than MnO2, which mainly due to less volume expansion (MnO2 + 4Li+ + 4e ↔ Mn + 2Li2O, MnO + 2Li+ + 2e ↔ Mn + Li2O).

The cycling performance of MnO2 and MnO at high discharge/charge current density has also been investigated as shown in Fig. 4e. At a current density of 2000 mA g−1, it is found that the first discharge and charge capacities of MnO microspheres are 1114.1 and 607.5 mA h g−1, respectively, with a coulombic efficiency of 54.5%. After a decreasing period, the capacity then increases after 50 cycles, which is a common phenomenon in transition metal oxides anodes. It could be ascribed to the reversible growth of a polymeric gel-like film at low voltage,19,34,35 proposed by Tarascon's group. Furthermore, the gradual activation of transition metal oxides anodes also leads to the rising trend of capacity with cycling.36 This phenomenon has also been observed in the case of MnO2 microspheres. After finishing this activation process, the capacities of MnO and MnO2 begin to decrease after 150 cycles. But differently, the specific capacity of MnO increases after 300 cycles. This could be attributed to the electrochemical milling effect of transition-metal oxides, and once the powderization appears, Li+ can diffuse faster into MnO.35 As we all know, the powderization can also lead to capacity fading because of the tremendous volume expansion. However, the capacity rising trend of MnO exactly suggests that MnO could remain a more stable structure than MnO2 after successive discharge/charge cycles, due to less volume expansion (MnO2 + 4Li+ + 4e ↔ Mn + 2Li2O, MnO + 2Li+ + 2e ↔ Mn + Li2O). It is inspiring that at a high current density of 2000 mA g−1, the MnO microspheres can still deliver a specific capacity as high as 751.4 mA h g−1 (after 400 cycles), while the reversible capacity is 492.7 mA h g−1 (after 300 cycles) for MnO2 microspheres under the same test condition. Remarkably, the specific capacity of MnO (751.4 mA h g−1) is comparable to the theoretical capacity (756 mA h g−1). This is possibly because MnO nanocrystallizes with reaction and charges store on the surface of the MnO electrodes, so it exhibits good electrochemical properties. Similar phenomenon that specific capacity is comparable to (or exceed) the theoretical capacity has been reported earlier in other nanoporous anode materials.37,38

The rate performance of the MnO2 and MnO microspheres is shown in Fig. 4f. When tested at 100, 200, 500 and 1000 mA g−1, the average reversible capacities are 920, 890, 800 and 690 mA h g−1 for the MnO microspheres, respectively, which are higher than the MnO2 microspheres (920, 850, 710 and 570 mA h g−1). After the current density goes back to 100 mA g−1, capacities of 854.6 mA h g−1 and 1133.1 mA h g−1 after 50 cycles are regained for MnO2 and MnO microspheres, respectively.

Electrochemical impedance spectroscopy (EIS) of the MnO2 and MnO microspheres electrodes were carried out after various cycles in the frequency range of 100 kHz to 0.01 Hz (Fig. S8). Each of the Nyquist plots generally consists of a semi-circle at high frequency related to the charge transfer resistance (Rct) and a slope line at low frequency which is related to Warburg impedance (Zw), corresponding to the diffusion of lithium ions into the bulk electrode. It can be clearly seen that the Warburg tails of MnO are larger than 45°, indicating deviation to capacitor, which greatly contributed to the high rate and stable cycling performance of MnO electrode.10,39–41

The morphology of the active materials was also characterized after cycles. Fig. 5 shows SEM and TEM images of the MnO2 and MnO microsphere electrodes after 100 discharge/charge cycles at 500 mA h g−1. It can be seen that microsphere structures have been maintained, while the original nanosheets collapse into a large number of floccus nanoparticles interweaved with each other, indicating the petal-like microspheres can highly accommodate volume expansion over continuous Li insertion/extraction processes. It is believed that the changes of the morphology are due to the recrystallization resulted from the conversion reaction mechanism (MnOx + 2xLi+ + 2xe ↔ Mn + xLi2O). Another explanation is called electrochemical milling effect of transition-metal oxides, which means the bulk particles of the transition-metal oxides anodes degrade into nanoparticles after lithiation.35 Emphatically, though the MnO2 and MnO nanosheets collapse, the smaller nanoparticles and the porosity in the microspheres are deduced to ensure extremely good electrochemical properties as well.21


image file: c6ra03065c-f5.tif
Fig. 5 SEM (a) and TEM (b and c) images of the MnO2 microsphere electrodes after 100 cycles at 500 mA g−1. SEM (d) and TEM (e and f) images of the MnO microsphere electrodes after 100 cycles at 500 mA g−1.

Conclusions

Manganese oxides with different oxidation states (MnO2 and MnO) with the same petal-like microsphere structures have been fabricated by optimizing the sintering conditions. Both of the materials have been studied as anodes for LIBs. The reversible capacities of the petal-like MnO2 and MnO microspheres are 832.9 and 921.4 mA h g−1 at 500 mA g−1 after 100 cycles, respectively. Even at a high current density of 2000 mA g−1, the MnO microspheres can still deliver a specific capacity of as high as 751.4 mA h g−1 after 400 cycles. The enhanced performance of MnO2 and MnO could be ascribed to the micro/nano structures. The better performance of MnO is originated from the good matching of volume expansion tolerability and the petal structures. The electrochemical performance of manganese oxides can be rationally tuned by controlling the oxidation states of Mn through optimizing the sintering conditions.

Acknowledgements

This work was supported by the National 973 Program Project of China (2012CB932800), the National Science Foundation of China (51171092, 21203111). X. Liu also acknowledges the Natural Science Foundation of Tianjin and the Fundamental Research Funds of Shandong University.

Notes and references

  1. J. Cabana, L. Monconduit, D. Larcher and M. R. Palacin, Adv. Mater., 2010, 22, E170–E192 CrossRef CAS PubMed.
  2. Y. Q. Wang, L. Gu, Y. G. Guo, H. Li, X. Q. He, S. Tsukimoto, Y. Ikuhara and L. J. Wan, J. Am. Chem. Soc., 2012, 134, 7874–7879 CrossRef CAS PubMed.
  3. G. Zhou, F. Li and H.-M. Cheng, Energy Environ. Sci., 2014, 7, 1307–1338 CAS.
  4. B. Scrosati and J. Garche, J. Power Sources, 2010, 195, 2419–2430 CrossRef CAS.
  5. L. Li, C. Nan, J. Lu, Q. Peng and Y. Li, Chem. Commun., 2012, 48, 6945–6947 RSC.
  6. J. Chen, Y. Wang, X. He, S. Xu, M. Fang, X. Zhao and Y. Shang, Electrochim. Acta, 2014, 142, 152–156 CrossRef CAS.
  7. A. Brandt and A. Balducci, J. Power Sources, 2013, 230, 44–49 CrossRef CAS.
  8. S. Bhuvaneswari, P. M. Pratheeksha, S. Anandan, D. Rangappa, R. Gopalan and T. N. Rao, Phys. Chem. Chem. Phys., 2014, 16, 5284–5294 RSC.
  9. S. Abouali, M. Akbari Garakani, B. Zhang, H. Luo, Z.-L. Xu, J.-Q. Huang, J. Huang and J.-K. Kim, J. Mater. Chem. A, 2014, 2, 16939–16944 CAS.
  10. D. Wang, Y. Yu, H. He, J. Wang, W. Zhou and H. D. Abruna, ACS Nano, 2015, 9, 1775–1781 CrossRef CAS PubMed.
  11. A. L. M. Reddy, M. M. Shaijumon, S. R. Gowda and P. M. Ajayan, Nano Lett., 2009, 9, 1002–1006 CrossRef CAS PubMed.
  12. C. He, S. Wu, N. Zhao, C. Shi, E. Liu and J. Li, ACS Nano, 2013, 7, 4459–4469 CrossRef CAS PubMed.
  13. Y. Xia, Z. Xiao, X. Dou, H. Huang, X. Lu, R. Yan, Y. Gan, W. Zhu, J. Tu, W. Zhang and X. Tao, ACS Nano, 2013, 7, 7083–7092 CrossRef CAS PubMed.
  14. R.-C. Lee, Y.-P. Lin, Y.-T. Weng, H.-A. Pan, J.-F. Lee and N.-L. Wu, J. Power Sources, 2014, 253, 373–380 CrossRef CAS.
  15. J. Wang, N. Yang, H. Tang, Z. Dong, Q. Jin, M. Yang, D. Kisailus, H. Zhao, Z. Tang and D. Wang, Angew. Chem., Int. Ed., 2013, 52, 6417–6420 CrossRef CAS PubMed.
  16. B. Zhang, Y. Zhang, Z. Miao, T. Wu, Z. Zhang and X. Yang, J. Power Sources, 2014, 248, 289–295 CrossRef CAS.
  17. Y. Deng, L. Wan, Y. Xie, X. Qin and G. Chen, RSC Adv., 2014, 4, 23914–23935 RSC.
  18. Y. Deng, Z. Li, Z. Shi, H. Xu, F. Peng and G. Chen, RSC Adv., 2012, 2, 4645–4647 RSC.
  19. J. Yue, X. Gu, L. Chen, N. Wang, X. Jiang, H. Xu, J. Yang and Y. Qian, J. Mater. Chem. A, 2014, 2, 17421–17426 CAS.
  20. H. Su, Y. F. Xu, S. C. Feng, Z. G. Wu, X. P. Sun, C. H. Shen, J. Q. Wang, J. T. Li, L. Huang and S. G. Sun, ACS Appl. Mater. Interfaces, 2015, 7, 8488–8494 CAS.
  21. X. Jiang, Y. Wang, L. Yang, D. Li, H. Xu and Y. Ding, J. Power Sources, 2015, 274, 862–868 CrossRef CAS.
  22. X. Sun, Y. Xu, P. Ding, G. Chen, X. Zheng, R. Zhang and L. Li, J. Power Sources, 2014, 255, 163–169 CrossRef CAS.
  23. S. Wang, Y. Ren, G. Liu, Y. Xing and S. Zhang, Nanoscale, 2014, 6, 3508–3512 RSC.
  24. W. Zhu, H. Huang, W. Zhang, X. Tao, Y. Gan, Y. Xia, H. Yang and X. Guo, Electrochim. Acta, 2015, 152, 286–293 CrossRef CAS.
  25. C. Xu, Y. Li, F. Tian and Y. Ding, ChemPhysChem, 2010, 11, 3320–3328 CrossRef CAS PubMed.
  26. C. Xu, R. Wang, Y. Zhang and Y. Ding, Nanoscale, 2010, 2, 906–909 RSC.
  27. X. Lang, L. Zhang, T. Fujita, Y. Ding and M. Chen, J. Power Sources, 2012, 197, 325–329 CrossRef CAS.
  28. Z. Bai, B. Sun, N. Fan, Z. Ju, M. Li, L. Xu and Y. Qian, Chem.–Eur. J., 2012, 18, 5319–5324 CrossRef CAS PubMed.
  29. Y. Sun, X. Hu, W. Luo, F. Xia and Y. Huang, Adv. Funct. Mater., 2013, 23, 2436–2444 CrossRef CAS.
  30. Y. Li, Q. Zhang, J. Zhu, X.-L. Wei and P. K. Shen, J. Mater. Chem. A, 2014, 2, 3163–3168 CAS.
  31. B. Sun, Z. Chen, H.-S. Kim, H. Ahn and G. Wang, J. Power Sources, 2011, 196, 3346–3349 CrossRef CAS.
  32. H. Liu, Z. Li, Y. Liang, R. Fu and D. Wu, Carbon, 2015, 84, 419–425 CrossRef CAS.
  33. Q. Hao, J. Wang and C. Xu, J. Mater. Chem. A, 2014, 2, 87–93 CAS.
  34. S. Grugeon, S. Laruelle, L. Dupont and J. M. Tarascon, Solid State Sci., 2003, 5, 895–904 CrossRef CAS.
  35. C. Chen, N. Ding, L. Wang, Y. Yu and I. Lieberwirth, J. Power Sources, 2009, 189, 552–556 CrossRef CAS.
  36. J.-S. Do and C.-H. Weng, J. Power Sources, 2005, 146, 482–486 CrossRef CAS.
  37. W. J. H. Borghols, M. Wagemaker, U. Lafont, E. M. Kelder and F. M. Mulder, J. Am. Chem. Soc., 2009, 131, 17786–17792 CrossRef CAS PubMed.
  38. X. Wang, D. Liu, Q. Weng, J. Liu, Q. Liang and C. Zhang, NPG Asia Mater., 2015, 7, e171 CrossRef CAS.
  39. C. Yuan, L. Hou, L. Shen, D. Li, F. Zhang, C. Fan, J. Li and X. Zhang, Electrochim. Acta, 2010, 56, 115–121 CrossRef CAS.
  40. R. Ding, L. Qi and H. Wang, J. Solid State Electrochem., 2012, 16, 3621–3633 CrossRef CAS.
  41. X. Shen, D. Mu, S. Chen, B. Wu and F. Wu, ACS Appl. Mater. Interfaces, 2013, 5, 3118–3125 CAS.

Footnote

Electronic supplementary information (ESI) available: Experiment details; TGA curve; HRTEM; XPS; TEM; XRD results. See DOI: 10.1039/c6ra03065c

This journal is © The Royal Society of Chemistry 2016