DOI:
10.1039/C6RA03031A
(Paper)
RSC Adv., 2016,
6, 46806-46812
Stable isotope labeling to study the nitrogen metabolism in microcystin biosynthesis†
Received
2nd February 2016
, Accepted 11th April 2016
First published on 25th April 2016
Abstract
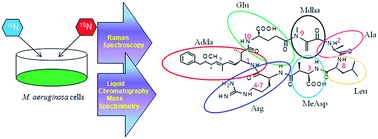
Cyanobacterial blooms have occurred frequently in the surface waters of the world, posing a potential threat to humans and ecosystems due to their toxic secondary metabolite, microcystin. Genetic tools cannot easily explain the biosynthesis of MC in specific strains due to the iterative nature of MC production and environmental factors. In this study, the fully 15N-labeled MC-LR was biosynthesized successfully in Microcystis aeruginosa by in vivo stable isotopic enrichment. The biosynthesis and metabolic flux of MC-LR were explored through Raman spectroscopy and liquid chromatography-mass spectrometry (LC-MS). The results showed that the essential amino acids that were incorporated into MC-LR were all labeled by 15N. The Raman spectra revealed that most of the bands in 6th cell transfer MC-LR were shifted to lower wavenumbers due to the substitution by the heavier isotope 15N. MS indicated that fully 15N-labeled Arg and MC-LR were the dominant species from the 2nd and 6th cell transfer M. aeruginosa, respectively. Through MS–MS fragmentation analysis, Adda was the first unit to be synthesized, followed by Ala, MeAsp, Arg, Leu, Mdha and Glu. These results provide new evidence and an ideal tool to explore the biosynthesis of MC-LR in the specific strain of M. aeruginosa.
Introduction
Global climate change and human activities are expected to promote the occurrence of cyanobacterial blooms over the next several years.1 As one of the most widespread environmental and social problems, blooms in the aquatic system diminish water quality and pose a potential threat to humans and ecosystems. Many genera of cyanobacteria are widely known to produce microcystin (MC), a toxic secondary metabolite. And Microcystis is the predominant producer in freshwater systems.2,3 Over 80 variants of microcystin have been identified, where microcystin–leucine–arginine (MC-LR) is the most common and harmful.4,5 MC is considered to inhibit protein phosphatase, disrupt formation of the cytoskeleton and promote oxidative stress in liver tissues, indicating a potential threat of liver cancer with chronic exposure.6 In addition, MC can accumulate in an aquatic system due to its relatively stable structure. Hence, due to the increasing public health concerns on MC, the World Health Organization (WHO) has recommended a guideline value of 1 μg L−1 MC-LR in drinking water.7 However, a long-term observation showed that the MC concentration in Lake Taihu (China), the third largest lake in China, ranged from 1.01 to 7.86 μg L−1 with a mean value of 2.97 ± 0.94 μg L−1 during the years of 2003 to 2013.8 And the daily intake of the fisherman near Lake Chaohu (China) ranged from 2.2 to 3.9 μg MC-LReq in July, 2009.9 Therefore, a better understanding of the synthesis of MC in Microcystis is critical if public health organizations and environmental protection agencies are to successfully monitor and block the formation of MC.
The biosynthesis of MC, explored from two strains of Microcystis aeruginosa (M. aeruginosa), is non-ribosomally conducted by peptide synthetases, polyketide synthases and tailoring enzymes encoded by the MC synthetase gene cluster.10,11 It is presumed that Adda is initially formed with phenylacetate as the starter unit.10 The gene cluster response for the biosynthesis of MC has been sequenced and characterized.10,12 In addition, with real-time polymerase chain reaction (PCR), selected MC synthetase genes, mcyA, mcyB and mcyE have been used for the monitoring of the relative abundance of MC-producing cells in M. aeruginosa blooms.13–15 Although the genetic tool is excellent for determining MC biosynthesis, it is difficult to generalize the whole biosynthesis in specific strains due to the iterative nature of MC production.16 Moreover, some environmental factors are involved in enhancing or repressing the expression of the mcy gene, leading to an increase or decrease in MC production, respectively.17,18
The stable isotope labeling technique has been used in metabolic flux analysis, which has been applied in proteins19 and more recently to hexapeptides.20 Through the use of stable carbon isotopes, Moore et al.11 reported the biosynthesis of Adda and MeAsp units of MC-LR in M. aeruginosa PCC 7820. In addition, Sano et al.21 corrected the LC-MS analyses of MC using 15N-labeled MC extracted from M. aeruginosa cultured in Na15NO3-containing medium. More recently, the effects of ammonia, alanine and urea on the cell growth and MC production of M. aeruginosa were investigated using 15N-labeled ammonia, alanine and urea.22,23 However, these results mainly focused on the influence of labeled substrates on MC production and the biosynthesis of partial units consisting of MC. To our knowledge, the complete biosynthesis of MC in a specific strain of M. aeruginosa, and laboratory or commercial MC compounds with full isotopic labels are limited.
Nitrogen has been considered as one of the essential constituents for algae growth and MC formation. Laboratory and field studies have demonstrated that M. aeruginosa has a particular affinity to ammonia for algae require less energy to assimilate ammonia than the oxidized forms of nitrogen.24,25 Furthermore, ammonia can facilitate the synthesis of MC in toxic strains of M. aeruginosa.26 However, the labeled nitrogen metabolic pathway in the essential amino acids incorporated in MC has not been reported. Besides, Raman spectroscopy provides a unique spectral fingerprint for any polarizable molecule, which can easily identify the difference between the variant amino acids in different MC.27 Hence, in this study, the full 15N-labeled MC-LR was biosynthesized for the first time. And confirmation of the MC-LR biosynthesis and exploration of ammonia metabolic flux in M. aeruginosa were analysed through Raman spectroscopy and LC-MS. The distributions of the stable nitrogen isotope in MC-LR and specific amino acids in M. aeruginosa were determined.
Materials and methods
Cultivation of M. aeruginosa
M. aeruginosa FACHB-905 was obtained from the Institute of Hydrobiology, Chinese Academy of Science (Wuhan, China). Every 25 days, 300 mL of the mother cell suspension was transferred into 300 mL of BG11 medium in a 1 L flask. The components of the BG11 medium are shown in Table S1.† NaNO3 was replaced by 15NH4Cl (CIL Inc., USA) as the sole nitrogen source in the BG11 medium. M. aeruginosa was cultivated under a light intensity of 55 μmol of photons m−2 s−1 at 25 °C in a constant temperature incubator.
Extraction of MC-LR and amino acids
After freezing and thawing repeatedly, the mixtures were filtered using a 0.45 μm microfiber filter. 20 mL of the solution was concentrated using a Visiprep Solid Phase Extraction (SPE) Vacuum Manifold (Supelco, Bellefontem, PA, USA) with 500 mg of ENVI™-18 (reversed phase packing made of a silica-based gel), with a surface volume of 6 mL and an average pore diameter of 60 angstroms. Prior to extraction, conditioning was carried out with 100% methanol and deionized water. The SPE cartridge was washed with 10% methanol and eluted with 80% methanol to extract MC-LR. The extracted solution was reconstituted with 0.8 mL of methanol. Then the sample was purified using HPLC (1525, Waters, USA) by collecting the waste liquor at the MC-LR retention time as shown in Fig. S1.† The separation column was an Agilent ZORBAX SB-C18 (5 μm × 4.6 mm × 250 mm). The mobile phase comprised methanol and phosphate buffer (0.05 mol L−1, pH = 3). The flow rate was 1 mL min−1 with a methanol to phosphate buffer ratio of 0.55
:
0.45 (v/v).
Free amino acids were extracted from M. aeruginosa by removing the precipitate as described previously28 with a minor modification. The algal cells were harvested by centrifugation at 5000g for 10 min at 4 °C. Then the cells were washed three times with ultrapure water to ensure that the cells were clean prior to freezing and thawing. After pre-treatment by methanol precipitation to remove protein, the supernatant was filtered through a 0.22 μm syringe filter for analysis.
Analytical methods
The purified MC-LR was dissolved with de-ionized water after vacuum drying. 2 μL of MC-LR at 1 mg L−1 (standard) and 1 mg L−1 (sample) was transferred onto a calcium fluoride (CaF2) substrate and air-dried. Raman spectra were recorded with a customized Raman-activated cell sorting (RACS) system, which has been described in detail elsewhere.29 All spectra were obtained with a laser power on the sample of 3.22 mW, 10 s exposure time, two accumulations and a 100× magnifying objective for observation. The measurement was performed at room temperature. The extracted MC-LR was further identified and semi-quantified using LC-MS (Surveyor Plus LC-LTQ, Thermo fisher, USA) with a symmetric C18 column (2.1 mm × 150 mm × 5 μm, Waters, USA). The mobile phase consisted of 5% acetonitrile and acetonitrile, both containing 0.1% formic acid with a linear gradient as shown in Table S2.† The isotope patterns of MC-LR were determined using a MS equipped with an electrospray ionization (ESI) source operated in positive ion mode with a m/z range from 300–2000. MS/MS analysis was used to confirm the specific position of 15N-labels in the 6th cell transfer MC. The collision energy was 35 eV. The extracted amino acids were separated by LC-MS (6430, Agilent, USA) with the same symmetric C18 column. The mobile phase was a mixture of 0.1% formic acid and methanol with a linear gradient as shown in Table S3.† The isotope patterns of the amino acids were determined using a MS equipped with an electrospray ionization (ESI) source operated in positive ion mode with a m/z range from 20–500.
Results
Isotope labeling free amino acids
The free amino acids incorporated in MC-LR, glutamate (Glu), aspartate (Asp), arginine (Arg) and leucine (Leu) in the 6th cell transfers M. aeruginosa as well as their standards were identified using LC-MS. Fig. 1(a) shows the LC-MS spectra of the standards for Arg, Glu, Asp and Leu from top to bottom, the colors of which are consistent with those of the corresponding LC peaks. In the 6th cell transfer M. aeruginosa the retention times of the extracted Arg, Glu, Asp and Leu from M. aeruginosa were the same as those of the standards of the corresponding amino acids (shown in Fig. 1(b)). In addition, the molecular weights of Glu, Asp and Leu in the 6th cell transfer M. aeruginosa were one Da larger than those in the standards of the corresponding amino acids. This means that the light atoms of 14N in these amino acids are substituted with heavier isotopes of 15N. For Arg, the molecular weight of the sample was 178.2 rather than 174.2 (the normal value). As shown in Fig. 2(a), the relative abundances of M + 1, M + 2, M + 3 and M + 4 in the 1st cell transfer of Arg were 28%, 40%, 16% and 36% higher than those of natural Arg. The isotope pattern relative abundances in the 2nd and 3rd cell transfers were similar, with 100% relative abundance of M + 4. In the 4th cell transfer, the relative abundances of M + 1, M + 2, M + 3 and M + 4 were 15%, 65%, 100% and 90%, respectively. In the 5th and 6th cell transfers of Arg, the relative abundances of M to M + 3 decreased quickly along with the relative abundance of M + 4 returning 100%. This indicated that, as expected, the essential amino acids that are incorporated in MC were all labeled by 15N.
 |
| Fig. 1 LC-MS of free amino acid incorporated MC (a) standards and (b) in the 15N-labeled NH4Cl cultured M. aeruginosa in the 6th cell transfer (the retention times of M2 and M3 are the same; M1, M2, M3 and M4 represent the molecular weight of Arg, Glu, Asp and Leu, respectively). | |
 |
| Fig. 2 Relative abundances of the isotope patterns for (a) 15N-labeled MC-LR and (b) Arg in different cell transfers of M. aeruginosa (1st transfer: black, 2nd transfer: red, 3rd transfer: blue, 4th transfer: dark cyan, 5th transfer: pink and 6th transfer: olive). | |
Raman spectra of MC-LR
The Raman spectra of MC-LR for the standard and the 6th cell transfer MC-LR are shown in Fig. 3. The overall spectral change revealed that most of the bands in the 6th cell transfer MC-LR were shifted to lower wavenumbers due to substitution of the heavier isotope 15N. From the related Raman peaks listed in Table S4,† the amide I band of the MC-LR standard was detected as a sharp peak at 1644 cm−1, which reduced to a lower wavenumber of 1620 cm−1 in the 6th cell transfer MC-LR. Similarly, the peak at 1259 cm−1, ascribed to the stretch of amide III, red-shifted to 1249 cm−1. And the stretch of the asymmetric Arg N–C–N and vibration of the Arg C–N–H side chain with a wavenumber of 1452 cm−1 shifted to 1440 cm−1 affected by 15N incorporation. The above observations indicated that the substitution of light N-atoms in the stretches of C–N and N–H correspond to the amide II and amide III spectral bands with the heavier isotope.
 |
| Fig. 3 Raman spectra of (a) MC-LR standard and (b) 15N-labeled MC-LR in the 6th cell transfer M. aeruginosa. | |
Isotope pattern of MC-LR
In order to confirm the results of the Raman analysis, the isotope patterns of MC-LR in six cell transfers M. aeruginosa by LC-MS are shown in Fig. 2(b). The figure shows that the MS result of MC-LR including M, M + 1, M + 2 and M + 3 in the 1st cell transfer shows no obvious 15N incorporation compared with natural MC-LR. The MS of M + 6 to M + 10 could be detected by LC-MS in the 1st cell transfer MC-LR, indicating that 15N-labeled NH4Cl was used as the nitrogen source in the biosynthesis of MC-LR. The isotope pattern in the 2nd cell transfer MC-LR showed that the relative abundances of M + 1, M + 2, M + 3, M + 4 and M + 5 were 16%, 19%, 19.6%, 15% and 18%, higher than those in the natural MC-LR. The relative abundances in the isotope pattern of the 3rd cell transfer MC-LR decreased with increasing molecular weight, similarly to that seen in the 2nd cell transfer. The isotope pattern in the 4th cell transfer MC-LR changed significantly. Compared with the 3rd cell transfer, the relative abundances of M + 2, M + 3, M + 4 and M + 5 decreased along with an increase of M + 6, M + 7, M + 8, M + 9 and M + 10. Furthermore, the relative abundance of M + 8 was 100% indicating that the 15N8-MC-LR had been synthesized successfully. For the 5th cell transfer MC-LR, the most notable feature was that the relative abundances of M to M + 5 were all lower than 10%. M + 9 rather than M + 8 reached a relative abundance of 100%, showing that the 15N9-MC-LR was the dominant species in the 15N-labeled MC-LR. As expected, the relative abundance of M + 10 reached 100% in the 6th cell transfer MC-LR, which demonstrated that the 15N10-MC-LR was synthesized successfully. And the relative abundances of M to M + 6 were all lower than 10%, with abundances of 23%, 50% and 69% for M + 7, M + 8 and M + 9, respectively.
The 15N-labeled sequence in MC-LR
As shown in Fig. 2(b), 15N10-MC-LR was synthesized successfully in the 6th cell transfer MC-LR. To confirm the specific position of 15N-labels in the 6th cell transfer MC, MS–MS fragmentation analysis was performed with parent ions m/z = 995.5, 996.5, 997.5, 998.5, 999.5, 1000.5, 1001.5, 1002.5, 1003.5, 1004.5 and 1005.5 (Fig. S2–S12†). For the parent ion m/z = 995.5 in natural MC-LR, peaks at m/z = 599, 470, 553, 710, 866, 865 and 924 were consistent with the structures of [MeAsp–Arg–Adda + H/Arg–Adda–Glu + H]+, [Ala–Leu–MeAsp–Arg + H]+, [Mdha–Ala–Leu–MeAsp–Arg + H]+, [Adda–Glu–Mdha–Ala–Leu + H]+, [Arg–Adda–Glu–Mdha–Ala–Leu + H]+, [Mdha–Ala–Leu–MeAsp–Arg–Adda + H]+ and [Leu–MeAsp–Arg–Adda–Glu–Mdha + H]+, respectively.30 Fig. 4(a) shows the MS–MS of the parent ion m/z = 996.5, which was one more Da than the parent ion m/z = 995.5. The main peaks of m/z = 600, 711 and 867 were consistent with the structures of [MeAsp–Arg–Adda + H + 15N/Arg–Adda–Glu + H + 15N]+, [Adda–Glu–Mdha–Ala–Leu + H + 15N]+ and [Arg–Adda–Glu–Mdha–Ala–Leu + H + 15N]+. This result indicated that the first 15N was labeled in the Adda residue. Similarly, the main peaks for 15N2-labeled MC-LR demonstrated that the Ala residue was the second labeled position shown in Fig. S4.† For the major ion m/z = 998.5 shown in Fig. S5,† in 15N3-labeled MC-LR, the main peaks were m/z = 601, 472, 555, 868 and 926. This demonstrated that the third 15N-labeled atom was located in the MeAsp residue. The peak variants of m/z = 602, 473 and 870 in 15N4-labeled MC-LR demonstrated that the fourth assimilated 15N was the Arg residue. Through the main MS–MS analysis of the major ions m/z = 1000.5, 1001.5 and 1002.5 shown in Fig. S7–S9,† the 15N-labeled positions were the Leu, Mdha, and Glu residues, respectively. For the major ions m/z = 1003.5, 1004.5 and 1005.5 shown in Fig. S10–S12† the peak variants of m/z = 604, 475, 559, 873 or 931 demonstrated that the three 15N were labeled in the Arg residue. And Fig. 4(b) suggested that the peak in the m/z range from 867 to 875 was due to the substitution of light N-atoms by 15N. Hence, the possible sequence of 15N-MC-LR residues was Adda, Ala, MeAsp, Arg-N, Leu, Mdha, Glu, and Arg.
 |
| Fig. 4 MS-MS spectra of the mass-to-charge ratios (m/z) (a) 996.5 and (b) 1005.5 in the 15N10-MC-LR in M. aeruginosa. | |
Discussion
The biosynthesis of MC in M. aeruginosa is dependent on the presence of mcy genes from the MC synthetase gene complex. The genes are bidirectionally transcribed via a central promoter between mcyA and mcyD. NtcA (global nitrogen regulator) DNA binding proteins were confirmed in this central regulatory region of the mcy cluster.31 In addition, MC, as an N-rich compound containing 10 N atoms per molecule, could represent up to 2% of the dry weight of Microcystis.32 These results suggested that nitrogen played a role in the control of MC biosynthesis. And the biosynthesis of MC may be influenced by the different forms of nitrogen.22,23 In addition, previous results indicated positive relationships between nitrogen supply, MC production and MC content in M. aeruginosa.33 And ammonia could facilitate the synthesis of MC in toxic strains of M. aeruginosa, which were more responsive to ammonia than non-toxic strains.32 Collos and Harrison34 observed that M. aeruginosa could grow optimally with an ammonia concentration of 2.5 mM and tolerate a concentration of 13 mM. In this study, the decrease of ammonia concentration during cultivation was almost consistent with the growth of the cells (Fig. S13†), which indicated that M. aeruginosa could assimilate ammonia to support growth. Given that MC-produced M. aeruginosa has greater ammonia requirements, mitigation of toxic algae bloom should be preferentially targeted by the reduction of ammonia.
Raman spectroscopy could provide a unique spectral fingerprint for the polarizable molecules. It has been used for the identification and quantitation of MC-LR as well as differentiation of its component amino acids.35 Recently, a stable isotope-labeled Raman technique was used to analyze microbial communities and explore metabolic pathways in vivo based on the fact that the vibrational frequency will be reduced and the corresponding Raman bands will red-shift when light atoms in the molecular vibration are substituted with heavier isotopes.36,37 However, due to a lack of stable isotopically labeled MC-LR, so far stable isotope probing combined with Raman spectroscopy has not been mentioned. In this study, the fully 15N-labeled MC-LR has been biosynthesized successfully in M. aeruginosa by in vivo stable isotopic enrichment. By substituting 14N with 15N in MC-LR, the Raman bands of 1644, 1259 and 1452 cm−1 reduced to 1620, 1249 and 1440 cm−1, respectively. It’s an ideal tool for identifying the nitrogen metabolism in vivo using stable isotope labeling. However, this could not indicate how much of the heavy isotope had been involved in the algal biochemistry and how much of their sequence had been incorporated in MC-LR. Hence, LC-MS-MS analysis with higher sensitivity was selected to confirm the results of the Raman analysis and gain further information about 15N-labeled MC-LR.
Through LC-MS-MS analysis, Yan et al.22 cultured a strain of M. aeruginosa and found that ammonia was incorporated into the Arg residue in MC-LR. However, the MC biosynthesis in M. aeruginosa PCC7806 analyzed by genetic tools indicated that Adda was the first unit to be synthesized, followed by Glu, Mdha, Ala, Leu, MeAsp and Arg.12 Furthermore, Wu et al.23 indicated that either Ala or Leu was the first labeled unit with the last incorporated residue of Mdha in the biosynthesis of MC-LR when 15N-labeled urea was the sole nitrogen source. In this study, Adda was the first labeled residue, which was in accordance with the genetic analysis. Then Ala, MeAsp, Arg-N, Leu, Mdha and Glu, Arg in MC-LR were labeled in sequence. These results showed that the culture conditions indeed influenced the MC-LR biosynthesis at the individual strain level. As the previous research showed, the transcriptional promoters of mcyA and mcyD in M. aeruginosa were dependent on light intensity, making MC production difficult to predict on short time-scales.38 Furthermore, Beversdorf et al.39 concluded that the presence of MC genes (e.g. mcyA, mcyE) is not a good indicator of toxins in the environment.
Conclusions
Although genetic tools are excellent for determining the biosynthesis of MC, it is difficult to generalize the biosynthesis of MC in specific strains due to the iterative nature of MC production and specific environmental factors. In the present study, it is the first report that fully 15N-labeled MC-LR was biosynthesized successfully in M. aeruginosa by in vivo stable isotopic enrichment. The biosynthesis of 15N-labeled essential amino acids, such as Arg, was quicker than that of MC-LR. The results indicated that the sequence of 15N-labeled units could be influenced by algal species and nitrogen forms. And this result provided new evidence for a different biosynthesis route for MC-LR in the specific strain of M. aeruginosa. In addition, this result suggested that stable isotopes can be an ideal tool for understanding the biosynthesis of MC-LR.
Acknowledgements
We thank Dr Shu-Xia Huang at the State Key Laboratory of Biological Fermentation Engineering of Beer, Tsingtao Brewery Co., Ltd for her constructive discussion. This work is supported by the National Natural Science Foundation of China (No. 51108443, No. 51478453) and Applied Basic Research Foundation of Qingdao City (No. 14-2-4-45-jch, No. 14-2-4-21-jch). The authors also acknowledge the support of the Taishan Scholar Program of Shandong Province and Youth Innovation Promotion Association, CAS.
References
- H. W. Paerl and V. J. Paul, Water Res., 2012, 46, 1349 CrossRef CAS PubMed.
- J. M. Rinta-Kanto, A. J. Ouellette, G. L. Boyer, M. R. Twiss, T. B. Bridgeman and S. W. Wilhelm, Environ. Sci. Technol., 2005, 39, 4198 CrossRef CAS PubMed.
- S. Singh, P. K. Rai, R. Chau, A. K. Ravi, B. A. Neilan and R. K. Asthana, Water Res., 2015, 69, 131 CrossRef CAS PubMed.
- S. C. Wang, Z. Z. Geng, Y. Wang, Z. H. Tong and H. Q. Yu, Environ. Sci. Technol., 2012, 46, 3442 CrossRef CAS PubMed.
- A. M. Hotto, M. F. Satchwell, D. L. Berry, C. J. Gobler and G. L. Boyer, Harmful Algae, 2008, 7, 671 CrossRef CAS.
- J. R. Schmidt, S. W. Wilhelm and G. L. Boyer, Toxins, 2014, 6, 3354 CrossRef CAS PubMed.
- WHO, Health Criteria and other supporting Information, Guidelines for Drinking Water Quality, World Health Organization, Geneva, Switzerland, 2nd edn, 1998 Search PubMed.
- K. Shi, Y. Zhang, H. Xu, G. Zhu, B. Qin, C. Huang, X. Liu, Y. Zhou and H. Lv, Environ. Sci. Technol., 2015, 49, 6448 CrossRef CAS PubMed.
- J. Chen, P. Xie, L. Li and J. Xu, J. Toxicol. Sci., 2009, 108, 81 CrossRef CAS PubMed.
- E. Dittmann, B. A. Neilan, M. Erhard, H. von Döhren and T. Börner, Mol. Microbiol., 1997, 26, 779 CrossRef CAS PubMed.
- R. E. Moore, J. L. Chen, B. S. Moore, G. M. L. Patterson and W. W. Carmichael, J. Am. Chem. Soc., 1991, 113, 5083 CrossRef CAS.
- D. Tillett, E. Dittmann, M. Erhard, H. von Döhren, T. Börner and B. A. Neilan, Chem. Biol., 2000, 7, 753 CrossRef CAS PubMed.
- T. Yoshida, Y. Yuki, S. Lei, H. Chinen, M. Yoshida, R. Kondo and S. Hiroishi, Microbes Environ., 2003, 18, 16 CrossRef.
- R. Kurmayer and T. Kutzenberger, Appl. Environ. Microbiol., 2003, 69, 6723 CrossRef CAS PubMed.
- J. Vaitomaa, A. Rantala, K. Halinen, L. Rouhiainen, P. Tallberg, L. Mokelke and K. Sivonen, Appl. Environ. Microbiol., 2003, 69, 7289 CrossRef CAS PubMed.
- G. Christiansen, J. Fastner, M. Erhard, T. Börner and E. Dittmann, J. Bacteriol., 2003, 185, 564 CrossRef CAS PubMed.
- J. S. M. Pimentel and A. Giani, Appl. Environ. Microbiol., 2014, 80, 5836 CrossRef PubMed.
- M. Kaebernick, B. A. Neilan, T. Borner and E. Dittmann, Appl. Environ. Microbiol., 2000, 66, 3387 CrossRef CAS PubMed.
- M. Taubert, C. Voqt, T. Wubet, S. Kleinsteuber, M. T. Tarkka, H. Harms, F. Buscot, H. H. Richnow, M. von Bergen and J. Seifert, ISME J., 2012, 6, 2291 CrossRef CAS PubMed.
- S. Schloß, I. Wedell, M. Koch, S. Rohn and R. Maul, Food Chem., 2015, 177, 61 CrossRef PubMed.
- T. Sano, H. Takagi, K. Nagano, M. Nishikawa and K. Kaya, Anal. Bioanal. Chem., 2011, 399, 2511 CrossRef CAS PubMed.
- Y. Yan, R. Dai, Y. Liu, J. Gao and X. Wu, World J. Microbiol. Biotechnol., 2015, 31, 763 CrossRef CAS PubMed.
- X. Wu, Y. Yan, P. Wang, L. Ni, J. Gao and R. Dai, Bioresour. Technol., 2015, 181, 72 CrossRef CAS PubMed.
- P. W. Lehman, K. Marr, G. L. Boyer, S. Acuna and S. J. The, Hydrobiologia, 2013, 718, 141 CrossRef CAS.
- X. Liu, X. H. Lu and Y. W. Chen, Harmful Algae, 2011, 10, 337 CrossRef CAS.
- J. H. Ha, T. Hidaka and H. Tsuno, Environ. Sci. Technol., 2009, 43, 812 CrossRef CAS PubMed.
- R. A. Halvorson and P. J. Vikesland, Environ. Sci. Technol., 2011, 45, 5644 CrossRef CAS PubMed.
- X. Mao, P. Liu, S. He, J. Xie, F. Kan, C. Yu, Z. Li, C. Xue and H. Lin, Appl. Biochem. Biotechnol., 2013, 171, 1240 CrossRef CAS PubMed.
- Y. Ji, Y. He, Y. Cui, T. Wang, Y. Wang, Y. Li, W. Huang and J. Xu, Biotechnol. J., 2014, 9, 1512 CrossRef CAS PubMed.
- D. G. Bourne, G. J. Jones, R. L. Blakeley, A. Jones, A. P. Neqri and P. Riddles, Appl. Environ. Microbiol., 1996, 62, 4086 CAS.
- H. P. Ginn, L. A. Pearson and B. A. Neilan, Appl. Environ. Microbiol., 2010, 76, 4362 CrossRef CAS PubMed.
- W. D. Timothy, J. H. Matthew, M. Alejandra, G. Jennifer, O. D. Celia, L. B. Dianna and J. G. Christopher, Aquat. Microb. Ecol., 2010, 61, 149 CrossRef.
- P. T. Orr, G. J. Jones and G. B. Douglas, Mar. Freshwater Res., 2004, 55, 277 Search PubMed.
- Y. Collos and P. J. Harrison, Mar. Pollut. Bull., 2014, 80, 8 CrossRef CAS PubMed.
- R. A. Halvorson, W. Leng and P. J. Vikesland, Anal. Chem., 2011, 83, 9273 CrossRef CAS PubMed.
- . Noothalapati and S. Shigeto, Anal. Chem., 2014, 86, 7828 CrossRef PubMed.
- H. Muhamadali, M. Chisanga, A. Subaihi and R. Goodacre, Anal. Chem., 2015, 87, 4578 CrossRef CAS PubMed.
- B. A. Neilan, L. A. Pearson, J. Muenchhoff, M. C. Moffitt and E. Dittmann, Environ. Microbiol., 2013, 15, 1239 CrossRef CAS PubMed.
- L. J. Beversdorf, S. D. Chaston, T. R. Miller and K. D. McMahon, PLoS One, 2015, 10, e0125353 Search PubMed.
Footnote |
† Electronic supplementary information (ESI) available: Supporting information includes Table S1 (components of BG11 medium), Tables S2 and S3 (gradient elution of HPLC) and Fig. S1 (HPLC chromatograms of MC-LR); Table S4 (Raman spectra) and Fig. S2–S12 (MS/MS spectra of 15N-MC); Table S5 (MS–MS parent ion and daughter ions); Fig. S13 (growth curve of 15N-labeled MA and variants of ammonia). See DOI: 10.1039/c6ra03031a |
|
This journal is © The Royal Society of Chemistry 2016 |
Click here to see how this site uses Cookies. View our privacy policy here.