A colorimetric and fluorometric investigation of Cu(II) ion in aqueous medium with a fluorescein-based chemosensor

Reena V. Rathod, Smritilekha Bera, Man Singh and Dhananjoy Mondal*
School of Chemical Sciences, Central University of Gujarat, Gandhinagar-382030, India. E-mail: dhananjoym@yahoo.com; Fax: +91-79-23260076; Tel: +91-79-23260210

Received 1st February 2016 , Accepted 21st March 2016

First published on 23rd March 2016


Abstract

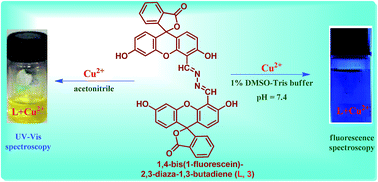
As a selective colorimetric and fluorometric chemosensor, a novel fluorescein-based Schiff base (FNSB), 1,4-bis(1-fluorescein)-2,3-diaza-1,3-butadiene (L, 3) exhibits efficient binding for Cu2+ ion in water and allows naked-eye detection as a result of the formation of a 1[thin space (1/6-em)]:[thin space (1/6-em)]1 copper–ligand complex. The complexations of Cu2+ ion due to molecular interaction with 3 resulted in a rapid change in color from colorless to deep yellow with a characteristic change in the UV-vis absorption to a longer wavelength by 130 nm in acetonitrile and significant quenching of the fluorescence intensity (∼2.5 fold for Cu2+ ion) with maxima at 519 nm in 1% DMSO–Tris buffer solution at physiological pH (7.4). The detection limit of Cu2+ ion in acetonitrile is found to be 20 μM by UV spectroscopy, whereas in aqueous solution, the limit is reduced to 1.25 μM by fluorescence spectroscopy.


In recent times, the toxicity of environmental pollutants containing metal ions is a problem that has received global attention due to its critical effects on physiology, ecology, evolution, nutrition, and the environment.1 In this respect, there is an immense need for detection and identification of metal ions in aqueous solution for environmental monitoring and biomedical science, ensuring the regular functioning of ecosystems, health and humanity. It has been found that the involvement of specific concentrations of metal ions is essential in a number of biological processes.2 In particular, copper plays a pivotal role in different biological processes, such as iron absorption, haemopoiesis, and various enzyme-catalyzed and redox reactions.3 A neural copper concentration on the order of 0.1 mM is required in the body and brain for biological processes; however, higher concentrations cause vomiting, lethargy, increased blood pressure and respiratory rates, acute hemolytic anemia, liver damage, neurotoxicity, and neurodegenerative diseases.4,5 Furthermore, copper ions can disrupt natural ecosystems due to their adverse effects on microorganisms.6 Thus, there is an upsurge of interest in the development of selective and reliable detection methods for the qualitative and quantitative analysis of metal ions. In this perspective, chemosensors are of great importance to chemistry, biology, and medicine because they allow rapid detection of different compounds in living organisms and the environment.2

Colorimetric and fluorometric chemosensors are of particular interest; they have distinct advantages in terms of sensitivity, selectivity, response time, real time analysis and easy operation. To date, several molecular design strategies have been exploited to develop chemosensors for the selective recognition of different species on the basis of different host–guest interactions, such as hydrogen-bonding, electrostatic forces, metal-receptor coordination, hydrophobic interactions and van der Waals forces;7 however, effective sensors with good compound selectivity, solvent specificity and detection limits are rare.

Recently, several fluorophores based on boron–dipyrromethene (BODIPY), naphthalene, pyrene, anthraquinone, coumarin, xanthane, rhodamine and fluorescein, which are effective either in the UV or visible/near IR regions, have been studied.8 Among these, fluorescent chemosensors for Cu(II)-selective detection were reported and have been used with some success in biological applications.9 However, poor water solubility and selectivity makes these sensors unsuitable for environmental and cellular applications. To address these limitations, water soluble fluorescein-based chemosensors are significant due to their intrinsic advantages of high quantum yield and absorption and emission maxima in the visible region compared to other organic dyes.10,11

In addition to the signaling unit of a fluorophore, a built-in Lewis base receptor, i.e., a Schiff base receptor with N-donor atoms in the imine group and the O-donor of the phenol as a recognition center, can coordinate to a cation as a Lewis acid, affording stable complexes with various transition metals.12a–e Thus, the presence of amines/imines in the receptor plays a key role in establishing electronic communication between fluorophores and analytes.12f–g

Many methods have been used to detect metal ions, including fluorescence spectroscopy, UV-vis absorption, atomic absorption, ICP emission spectroscopy, and voltammetry. Amongst these, UV-vis absorption and fluorescence emission spectroscopy are attractive approaches because of their high sensitivity, facile operation, and widespread availability of equipment for analysis. As a result, fluorescent chemosensor molecules have been designed and synthesized for metal ion detection, in some cases yielding enhanced (turn-on) fluorescence signals and quenched (turn-off) signals13,14 at low concentrations for use as fluorescence turn-on/off sensors.

In this contribution, we report a new assay for the detection of Cu2+ ion using a fluorescein-based Schiff base (FNSB), 1,4-bis(1-fluorescein)-2,3-diaza-1,3-butadiene (3), as a highly selective colorimetric and fluorometric chemosensor in organic solvent as well as in aqueous solution at physiological pH (7.4). Indeed, the inherent ability15 of Cu2+ ion to quench fluorescence over other quenching metal ions (Hg2+, Ni2+, Pb2+, and Ag+) has been exploited to develop a selective fluorescence quenching sensor.

Though numerous ligands have been reported in the literature for selective detection of Cu2+ in organic solvents,9 and a few can be used in aqueous medium,9v ligands are rarely found to be active both in organic and aqueous media.9w Fortunately, our synthesized imine-functionalized fluorescein-based ligand 3, which is obtained in a two-step reaction from naturally occurring, inexpensive fluorescein with moderate to good yield, selectively binds Cu2+ in both organic and aqueous media without affecting its specificity or selectivity over other cations.

Several factors, such as high quantum yield, the absorption and emission maxima of fluorescein, and the participation of the Schiff base as a recognition unit for coordination to a metal cation as a Lewis acid, were considered in the design of the fluorescein-derived Schiff base ligand. In addition to the above parameters, pH, as an exogenous factor, affected the chromogenic behavior (i.e. the selectivity and sensitivity) of the receptor. Generally, fluorescein exists in a fluorescent ring opened carboxylic acid form and in a non-fluorescent ring closed lactone form, and this equilibrium is very sensitive to the pH of the solution (Fig. 1).16 Thus, the pH-tunable sensitivity of fluorescein can be used to sense changes in a local environment by monitoring its ring opening and closing equilibrium, in addition to other spectroscopic effects, to detect metal ions in industrial and commercial pollutants.17 In this regard, the development of a water-soluble fluorescein-derived Schiff base fluorophore for the tunable detection of Cu2+ ion in aqueous solution at physiological pH is an attractive and challenging approach.


image file: c6ra03021a-f1.tif
Fig. 1 UV-vis absorbance of ligand 3 in various solvents at 2.5 × 10⁻⁵ M concentration.

Experimental section

General information and methods

All materials were obtained from commercial suppliers and were used without further purification. All solvents were dried according to standard methods prior to use. All solvents used in the optical spectroscopic studies were either HPLC or spectroscopic grade, and all reactions were monitored by TLC analysis on aluminium plates pre-coated with silica gel 60 F254. Column chromatographic purifications were carried out on silica gel (200–400 mesh size). NMR spectra were measured on a Bruker Avance instrument. The 1H NMR (500 MHz) chemical shifts are given in ppm relative to the internal reference TMS. The 13C NMR (125 MHz) chemical shifts are given using CDCl3, MeOH-d4 and DMSO-d6 as the internal standards. ESI-MS data were recorded on an Agilent Q-TOF MicroTM LC-MS mass spectrometer. Fluorescence excitation and emission spectra were obtained using an Edinburgh Instruments Xenon-900 spectrofluorophotometer. UV-vis absorption spectra were recorded on a Spectro 2060+ UV-visible spectrophotometer.

Synthesis of 1,4-bis(1-fluorescein)-2,3-diaza-1,3-butadiene (3)

Scheme 1 illustrates the two step synthesis of the fluorescein-derived Schiff base (FNSB), 1,4-bis(1-fluorescein)-2,3-diaza-1,3-butadiene (3), as a cationic ligand (L). The Reimer–Tiemann reaction of fluorescein (1) with chloroform in alkaline aqueous methanolic solution at 55 °C produced fluorescein monoaldehyde (2)18 in 24 to 28% yield. The appearance of a peak at 10.63 ppm in the 1H NMR spectrum (Fig. SI 1), the C–H stretching of –CHO due to Fermi coupling at 2928 and 2853 cm−1, and the C[double bond, length as m-dash]O stretching at 1727 cm−1 in the FTIR spectra (Fig. SI 6) confirmed the functionalization of fluorescein with an aldehyde group by the Reimer–Tiemann reaction. The Schiff base formation was performed by a reaction between fluorescein monoaldehyde and a slight excess of hydrazine hydrate in ethanol at 90 °C, affording the final 1,4-bis(fluorescein)-2,3-diaza-1,3-butadiene (3) in 35% yield. The appearance of a mass peak at m/z = 717.1558 for [M + H]+ in the mass spectra (Fig. SI 5), the disappearance of the aldehyde peak at 10.63 ppm in the 1H NMR spectra, C–H stretching at 2928 and 2853 cm−1 and C[double bond, length as m-dash]O stretching at 1727 cm−1 in the FTIR spectra (Fig. SI 6) indicate the formation of Schiff base 3 from aldehyde 2 with hydrazine hydrate (Scheme 1).
image file: c6ra03021a-s1.tif
Scheme 1 Synthesis of 1,4-bis(1-fluorescein)-2,3-diaza-1,3-butadiene (3) as a cationic ligand.

Spectral studies

The selectivity, binding and stoichiometry of the complex system were also determined by NMR and mass spectroscopy. The NMR and mass spectroscopy data support 1[thin space (1/6-em)]:[thin space (1/6-em)]1 ligand-to-metal complex formation (Fig. SI 7 and 8) with a change of the binding constant in the fluorogenic response of ligand 3 in the presence of varying concentrations of Cu2+, indicating the formation of a 1[thin space (1/6-em)]:[thin space (1/6-em)]1 ligand-to-metal complex (by Job plot (Fig. 13), NMR, and MS) with an association constant of 2.23 × 10⁴ M−1 (Fig. 12). The conversion of L to L–Cu2+ (i.e. 1[thin space (1/6-em)]:[thin space (1/6-em)]1 L[thin space (1/6-em)]:[thin space (1/6-em)]Cu2+) (Scheme 2) was confirmed by ESI-TOF-MS and 1H NMR spectra. The peak at m/z 779.20 in positive ESI mode and 778.32 in negative ESI mode corresponding to the mass of [L–Cu2+] (calcd m/z 779.07) was found after 1 equiv. of CuClO4 was added to the solution of 1 equiv. ligand (Fig. SI 8). The cation binding by ligand 3 was also detected by changes in the 1H NMR spectrum. In the 1H NMR spectrum, upon addition of variable amounts of Cu2+, the shifting of the ligand protons and the change of splitting of the ligand protons showed the formation of ligand-to-Cu2+ complex. Moreover, after the cation concentration has reached the ligand concentration, further addition of Cu2+ is ineffective. Overall, TLC (thin layer chromatography) also clearly shows that the ligand–Cu2+complex is formed by the Rf value of 0.0 in comparison to the Rf = 0.50 of free ligand in 1[thin space (1/6-em)]:[thin space (1/6-em)]20 MeOH/DCM (Fig. SI 9). Thus, the ESI-TOF-MS, NMR and TLC results firmly support the inter-conversion of L to L–Cu2+ complex. The melting point of the ligand was also determined and was found to be 350 °C.
image file: c6ra03021a-s2.tif
Scheme 2 Proposed mechanism of the sensoring system.

The details of the procedure and the spectral data of the compounds can be found in the ESI.

Results and discussion

Solubility studies

Investigation of the selectivity of the synthesized cationic chemosensor 3 towards different metal ions necessitates choices of organic solvent, aqueous buffer and overall solvent composition. The solubility study of the cationic chemosensor (3) was performed with UV-vis spectroscopy at a concentration of 2.5 × 10⁻⁵ M in different organic solvents and aqueous media. The outcome revealed that the solubility in organic solvents with polarity indices ranging from 5.1 to 7.2 (DMF, DMSO, pyridine, acetone, acetonitrile) is noticeable, with the highest intensity broad peak at 350 nm. The synthesized ligand was non-fluorescent in aqueous solution, and its solubility (pH < ∼7.0) is not noteworthy. However, compound 3 is highly soluble in 1% DMSO in aqueous Tris–buffer at pH = 7.4, appearing fluorescent with an absorption peak near 491 nm. The solubility of the sensor in different organic solvents resulted in a color change visible to the naked eye, and this phenomenon is also supported by the UV-vis spectroscopy studies. In this regard, it should be mentioned that although the ligand was highly soluble in DMF and DMSO, with an absorption peak near 350 nm, the intrinsic coordination, oxidizing properties, and high boiling points of these solvents limit their use as experimental media. Thus, the comparably good solubility of ligand 3 in acetonitrile at 2.5 × 10⁻⁵ M concentration with an absorbance peak at 350 nm favors the detection of metal ions with the naked eye and the measurement of peak shifting by spectroscopic studies (Fig. 1).

pH studies

To inspect the pH effect and the solubility of 3 in aqueous solution, the absorbance of the chemosensor at a concentration of 2.5 × 10⁻⁵ M was investigated in the pH range of 2 to 10 in 1% DMSO–Tris buffer solution. It was found that ligand 3 shows no solubility in aqueous media at acidic and even at neutral pH. The absorbance of 3 in basic media ranging from 7.4 to 10.0 pH in Tris base at concentrations of 1 mmol and 10 mmol exhibits similar fluorescence activity, with the same absorbance maxima at 491 nm but with different intensities (Fig. SI 11). The result in acidic or neutral pH is not significant, presumably due to the stability of the ring closure form of fluorescein, which is non-fluorescent. The changes in pH value from 7 to 7.4 and the addition of 1% DMSO in an aqueous Tris buffer solution, which is compatible with biological systems, show very good absorbance properties of the synthetic ligand 3 at a higher wavelength of ca. 141 nm in comparison to organic solvents due to the extended conjugation of the phenolate anion at pH 7.4 (Fig. 2).
image file: c6ra03021a-f2.tif
Fig. 2 pKa-Dependent structure of fluorescein.

UV-vis spectral studies of the metal–ligand complex

The metal-binding properties of ligand 3 in organic as well as in aqueous solution were examined. Colorimetric studies of metal–ligand interaction were performed in acetonitrile to determine the selectivity and sensitivity of the following metal cations (Fig. 3): Li+, Na+, K+, Mg2+, Ca2+, Ni2+, Cu2+, Zn2+, Ag+, Cd2+, Hg2+, Pb2+, Pr3+, Sm3+, and Gd3+. The study commenced with nitrate salts of lanthanide metals and perchlorate salts of the remaining metal cations with ligand 3 in a 10[thin space (1/6-em)]:[thin space (1/6-em)]1 stoichiometric ratio. In this scenario, all metal ions in acetonitrile exhibit an instant color change which can be detected by UV spectroscopy. When the ratio of metal and ligand 3 was changed to 2[thin space (1/6-em)]:[thin space (1/6-em)]1 (Fig. 3a), the selective detection of Cu2+ and Hg2+ cations was witnessed, with the formation of new bands at 480 nm and 440 nm, respectively. This result demonstrates that Cu2+ ion only gives a maximum quantifiable change with a red shift of 130 nm along with a change in colour from light pink to yellow. However, it is interesting to note that the absorbance intensity of Cu2+ and Hg2+ cation decreases, whereas the intensity of Ni2+ cation increases with time, and the solution becomes pink (Fig. 3b).
image file: c6ra03021a-f3.tif
Fig. 3 (a) UV-vis spectra of a fresh solution of ligand 3 at 2.5 × 10⁻⁵ M in acetonitrile in the presence of metal ions at 5 × 10⁻⁵ M. (b) UV-vis spectra of the same solution of ligand 3 and Ni2+ after 6 h.

Studies of sensitivity of the ligand

To determine the limit of detection (LOD) for the Cu2+ cation in acetonitrile, different concentrations of Cu2+ ion (10 to 100 ppm) were titrated against ligand 3 at a concentration of 2.5 × 10⁻⁵ M and the solution was monitored by UV-vis spectroscopy. The LOD for the Cu2+ ion from the absorbance spectra was found to be 20 μM (Fig. 4). Surprisingly, after 1 h, the absorbances of the metal–ligand solutions began to change, which indicated that the complex formed during metal–ligand binding studies in acetonitrile is not stable in solution for a long time.
image file: c6ra03021a-f4.tif
Fig. 4 Titration curve of Cu2+ against ligand 3 at a concentration of 2.5 × 10⁻⁵ M in acetonitrile.

After colorimetric study of ligand 3 in organic solvent, the lower detection limit of the synthesized ligand with Cu2+ ion as a fluorescent probe at physiological pH 7.4 was also determined through colorimetric methods. To execute this experiment, spectroscopic measurements of ligand 3 were investigated in 1% DMSO–Tris buffer at physiological pH (10 mM Tris buffer, pH 7.4) under ambient conditions. Addition of biologically and environmentally relevant alkali, alkaline earth, transition, lanthanide or heavy metal ions did not produce any discernible change in the absorption spectral profile of the receptor at lower concentrations of metal ions (∼10−5 M). This observation suggests that there is no interaction between the synthesized chemosensor and the added metal ions. However, in the presence of Cu2+ ion, prominent changes in the UV-vis spectra are observed. The metal-free receptor gives strong fluorescence emission (I = 672[thin space (1/6-em)]420) upon excitation at 491 nm due to high affinity with chemosensor 3 through efficient photoinduced electron transfer (PET) from the fluorophore to the receptor at physiological pH (7.4). This emission profile does not change to any noticeable extent in terms of both intensity and peak positions in the presence of alkali, alkaline earth, transition, or lanthanide metal ions. Meanwhile, the addition of the perchlorate salt of Cu2+ elicits a significant diminution of the fluorescence intensity (∼2.5 fold for Cu2+ ion) with a wavelength of maximum absorption at 519 nm for Cu2+ (Fig. 5a). The turn-off fluorescence response was found to be reversible, as the addition of an aqueous solution of ligand to the L–Cu2+ solution changes the fluorescence output to the level of the metal-free receptor; this observation was also supported by the Job plot.


image file: c6ra03021a-f5.tif
Fig. 5 (a) Fluorescence spectra of chemosensor 3 at 1.5 × 10⁻⁵ M in 1% DMSO–Tris buffer (10 mmol) at pH 7.4 in the presence of metal ions (1.5 × 10⁻⁴ M) at λex = 491 nm and slit width 2 nm. (b) UV-vis absorption spectra of 3 at 1.5 × 10⁻⁵ M in the presence of metal ions (1.5 × 10⁻⁴ M) in 1% DMSO–Tris buffer at pH 7.4.

When the ligand concentration is 15 μM and the metal ion concentration is 10 times greater, a change is observed in the absorbance peak in the UV spectra from 490 to 496 nm with an intense absorbance peak, whereas ligand 3 shows an absorption peak at 496 nm (Fig. SI 12). This small change in absorbance makes it difficult to determine the selectivity of the metal cations (Fig. 5b). The association of the receptor with a complementary analyte can suppress either an electron or an energy transfer process and switch on the fluorescence of the adjacent fluorophore.

When the experiment was performed using a fluorescence spectrophotometer, and the metal ion concentration was 10 times that of the ligand (3), excellent selectivity was observed towards Cu2+ ion; the fluorescence was quenched compared to all other metal cations and a change in quenching intensity was observed from 6.7 × 10⁵ to 2.9 × 10⁵. However, a significant fluorescence change was not observed by fluorescence spectroscopy for any of the other metal cations. This phenomenon unambiguously indicates that the binding interaction between ligand 3 and Cu2+ is stronger than the interaction between ligand 3 and other quenching metal ions (Fig. 6).


image file: c6ra03021a-f6.tif
Fig. 6 Fluorescence intensity of ligand 3 at 1.5 × 10⁻⁵ M in 1% DMSO–Tris buffer (pH 7.4) in the presence of various metal ions (1.5 × 10⁻⁴ M) at λmax = 519 nm.

Studies of fluorometric titration of Cu2+ against ligand

For the limit of detection (LOD) at pH 7.4, the titration curve of Cu2+ was determined by considering concentrations of metal ions from 0.2 to 100 equivalents with respect to ligand 3 in 1% DMSO–Tris buffer (Fig. 7). Surprisingly, the detection limit was found to be 1.25 μM in aqueous solution (Fig. 8) by fluorescence spectroscopy, while according to UV spectroscopy, the detection limit of Cu2+ cation was found to be 20.0 μM in acetonitrile (organic solvent). Therefore, the detection limit via fluorescence spectroscopy provides sixteen-fold increase in an aqueous medium compared to UV spectroscopy in organic solvent.
image file: c6ra03021a-f7.tif
Fig. 7 Fluorometric titration of Cu2+ against ligand concentration at 5.0 μM in 1% DMSO–Tris base at pH 7.4.

image file: c6ra03021a-f8.tif
Fig. 8 LOD curve for Cu2+ against ligand concentration at 5.0 μM in 1% DMSO–Tris base at pH 7.4.

Sensing mechanism studies

The addition of acid maintains the lactone form of the chemosensor, activating an energy transfer pathway and effectively quenching the fluorescence of the receptor.19 The addition of base converts the chemosensor into the carboxylic acid form (Fig. 9), preventing the electron transfer process and switching on the fluorescence of the receptor.
image file: c6ra03021a-f9.tif
Fig. 9 Molecular interactions.

The mechanism of Cu2+-mediated fluorescence quenching in chemosensors

Non-radiative deactivation of photoexcited fluorophore 3 by the interaction of Cu2+ ion can be achieved either through “energy transfer” or “electron transfer”.20 This is because transition metal ions such as Cu(II) possess empty or half-filled orbitals which can be involved in a Dexter type energy-transfer mechanism, as per the presentation in Fig. 10A. On the other hand, the coordination of the N-atom of Schiff base 3 favors access to the Cu(III) state21 in the Dexter type electron-transfer mechanism. Thus, an electron can be transferred from the complexed Cu(II) centre to the photoexcited fluorophore moiety F* of 3, as depicted in Fig. 10B.
image file: c6ra03021a-f10.tif
Fig. 10 Quenching of the excited fluorescein-based Schiff base in the presence of Cu(II) ion: (A) Dexter type energy transfer mechanism; (B) Dexter type electron transfer mechanism.

Determination of Stern–Volmer and association constants

This unambiguous result is also corroborated by the changes in the binding constant of the fluorogenic response of ligand 3 in the presence of varying concentrations of Cu2+, with a Stern–Volmer constant of Ksv = 1.69 × 10⁴ M−1 (Fig. 11) and an association constant of Kass = 2.23 × 10⁴ M−1 (Fig. 12); this indicates the affinity of Cu2+ with the ligand via a static quenching pathway.
image file: c6ra03021a-f11.tif
Fig. 11 Stern–Volmer plot for ligand 3 as a function of the concentration of Cu2+ cation.

image file: c6ra03021a-f12.tif
Fig. 12 Determination of binding constant (association constant) to find the binding affinity of ligand 3 for Cu2+ in 1% DMSO–Tris buffer at pH 7.4. I0 is the fluorescence intensity of L, I is the fluorescence intensity of L + [Cu2+] and Iα is the minimum fluorescence intensity of L + [Cu2+].

Studies of Job plots

The observed peak abscissa values of 0.50 in Fig. 13 indicate a 1[thin space (1/6-em)]:[thin space (1/6-em)]1 stoichiometry of binding (ligand 3/Cu2+) for ligand 3 (theoretical value is 0.50). Hence, from the above study, the proposed mechanism for the detection of Cu2+ is revealed, as shown in Scheme 2.
image file: c6ra03021a-f13.tif
Fig. 13 Job plot of Cu2+ complex formation with 3 at 5 μM concentrations of each in 1% DMSO–Tris buffer at pH 7.4. X = [3]/[3] + [Cu2+] is the mole fraction of 3, I0 is the fluorescence intensity when X = 1 and I is the fluorescence intensity at the respective values of X. The samples contained 5 μM concentrations of 3 and Cu2+ at 519 nm.

Conclusion

In summary, we have synthesized a novel fluorescein-based chemosensor (3) for selective binding to Cu2+ metal cation in acetonitrile as the organic solvent and in water (1% DMSO–Tris buffer solution) at pH 7.4. According to UV spectroscopy, the detection limit of Cu2+ was found to be 20 μM in acetonitrile, whereas the detection limit in 1% DMSO–Tris buffer at pH 7.4 was reduced to 1.25 μM in fluorescence spectroscopy. In this buffer solution at pH 7.4, the receptor shows fluorescence quenching. This sensing ability at physiological pH in aqueous media may be useful for the detection of Cu2+ in vivo, as copper is a widely used industrial metal that is toxic at high concentrations and is involved in brain diseases such as Alzheimer's and Parkinson's disease. Even though some colorimetric/fluorescent chemosensors have been developed for the detection of Cu2+ to date, sensing methods for fast detection of Cu2+ in aqueous solution, especially using colorimetric sensors without resorting to instruments, are relatively rare. This fluorescent dye works in aqueous medium at physiological pH and, hence, it can be used in live cell imaging studies with a detection limit in the ppm region for Cu2+ ion in cases of poisoning. The resulting Cu(II) complex is further being explored as a probe for other substances, and this investigation will be published in due course.

Conflict of interest

The authors declare no competing financial interest.

Acknowledgements

The authors are greatly thankful to UGC for financial support and Central University of Gujarat, Gandhinagar for instrumental and infrastructural facilities. Reena Rathod also acknowledged Dr Parimal Paul, Chief Scientist and Madhuri Bhatt, Research Scholar, CSIR-Central Salt and Marine Chemicals Research Institute, India for fluorescent spectroscopic data.

Notes and references

  1. (a) A. P. De Silva, D. B. Fox, A. J. M. Huxley and T. S. Moody, Coord. Chem. Rev., 2000, 205, 41 CrossRef CAS; (b) A. P. De Silva, H. Q. N. Gunaratne, T. Gunnlaugsson, A. J. M. Huxley, C. P. McCoy, J. T. Rademacher and T. E. Rice, Chem. Rev., 1997, 97, 1515 CrossRef CAS PubMed; (c) R. J. Baldessarini, L. Tondo, P. Davis, M. Pompili, F. K. Goodwin and J. Hennen, Bipolar Disord., 2006, 8, 625 CrossRef CAS PubMed; (d) Z. Y. Chen, C. Peng, R. Jiao, Y. M. Wong, N. Yang and Y. Huang, J. Agric. Food Chem., 2009, 57, 4485 CrossRef CAS PubMed; (e) B. Valeur and I. Leray, Coord. Chem. Rev., 2000, 205, 3 CrossRef CAS; (f) J. Y. Uriu-Adams and C. L. Keen, Mol. Aspects Med., 2005, 26, 268 CrossRef CAS PubMed; (g) Y. S. Kim, J. S. Kim, H. S. Cho, D. S. Rha, J. M. Kim, J. D. Park, B. S. Choi, R. Lim, H. K. Chang, Y. H. Chung, I. H. Kwon, J. Jeong, B. S. Han and I. J. Yu, Inhalation Toxicol., 2008, 20, 575 CrossRef CAS PubMed; (h) R. McRae, P. Bagchi, S. Sumalekshmy and C. J. Fahrni, Chem. Rev., 2009, 109, 4780 CrossRef CAS PubMed; (i) M. Wennberg, T. Lundh, I. A. Bergdahl, G. Hallmans, J.-H. Jansson, B. Stegmayr, H. M. Custodio and S. Skerfving, Environ. Res., 2006, 100, 330 CrossRef CAS PubMed; (j) D. W. Boening, Chemosphere, 2000, 40, 1335 CrossRef CAS PubMed; (k) L. Prodi, New J. Chem., 2005, 29, 20 RSC; (l) B. Valeur and I. Leray, Coord. Chem. Rev., 2000, 205, 3 CrossRef CAS; (m) H. N. Kim, W. X. Ren, J. S. Kim and J. Yoon, Chem. Soc. Rev., 2012, 41, 3210 RSC.
  2. K. P. Carter, A. M. Young and A. E. Palmer, Chem. Rev., 2014, 114, 4564 CrossRef CAS PubMed.
  3. P. L. Malvankar and V. M. Shinde, Analyst, 1991, 116, 1081 RSC.
  4. (a) C. Vulpe, B. Levinson, S. Whitney, S. Packman and J. Gitschier, Nat. Genet., 1993, I, 7 CrossRef PubMed; (b) L. I. Bruijn, T. M. Miller and D. W. Cleveland, Annu. Rev. Neurosci., 2004, 27, 723 CrossRef CAS PubMed; (c) S. Rivera-Mancia, I. Perez-Neri, C. Rios, L. Tristan-Lopez, L. Rivera-Espinosa and S. Montes, Chem.–Biol. Interact., 2010, 186, 184 CrossRef CAS PubMed; (d) L. Rossi, M. F. Lombardo, M. R. Ciriolo and G. Rotilio, Neurochem. Res., 2004, 29, 493 CrossRef CAS PubMed; (e) E. Tiffany-Castiglioni, S. Hong and Y. C. Qian, Int. J. Dev. Neurosci., 2011, 29, 811 CrossRef CAS PubMed; (f) P. G. Georgopoulos, A. Roy, M. J. Yonone-Lioy, R. E. Opiekun and P. J. Lioy, J. Toxicol. Environ. Health, Part B, 2001, 4, 341 CrossRef CAS PubMed.
  5. P. C. Bull, G. R. Thomas, J. M. Rommens, J. R. Forbes and D. W. Cox, Nat. Genet., 1993, 5, 327 CrossRef CAS PubMed.
  6. R. Kramer, Angew. Chem., Int. Ed., 1998, 37, 772 CrossRef CAS.
  7. (a) J. M. Lehn, Science, 1993, 260, 1762 CAS; (b) V. Gennady, N. David and V. Willem, Angew. Chem., Int. Ed., 2007, 46, 2366 CrossRef PubMed; (c) J. L. Sessler, C. M. Lawrence and J. Jayawickramarajah, Chem. Soc. Rev., 2007, 36, 314 RSC; (d) J. C. Ma and D. A. Dougherty, Chem. Rev., 1997, 97, 1303 CrossRef CAS PubMed; (e) C. A. Hunter, K. R. Lawson, J. Perkins and C. J. Urch, J. Chem. Soc., Perkin Trans., 2001, 2, 651 RSC; (f) E. V. Anslyn and D. A. Dougherty, Modern Physical Organic Chemistry, University Science Books, Sausalito, CA, 2006 Search PubMed; (g) H.-J. Schneider, van der Waals forces, in Encyclopedia of Supramolecular Chemistry, ed. J. W. Steed, J. L. Atwood, Marcel Dekker, New York, NY, USA, 2004, vol. 2, p. 1550 Search PubMed; (h) H. S. Frank and M. W. Evans, J. Chem. Phys., 1945, 13, 507 CrossRef CAS; (i) N. T. Southall, K. A. Dill and A. D. J. Haymet, J. Phys. Chem., 2002, 106, 521 CrossRef CAS.
  8. S. S. Tan, S. J. Kim and E. T. Kool, J. Am. Chem. Soc., 2011, 133, 2664 CrossRef CAS PubMed.
  9. (a) D. Y. Sasaki, D. R. Shnek, D. W. Pack and F. H. Arnold, Angew. Chem., Int. Ed., 1995, 34, 905 CrossRef CAS; (b) J. Yoon, N. E. Ohler, D. H. Vance, W. D. Aumiller and W. Czarnik, Tetrahedron Lett., 1997, 38, 3845 CrossRef CAS; (c) A. Torrado, G. K. Walkup and B. Imperoali, J. Am. Chem. Soc., 1998, 120, 609 CrossRef CAS; (d) F. Bolleta, I. Costa, L. Fabbrizzi, M. Licchelli, M. Montalti, P. Pallavicini, L. Prodi and N. Zaccheroni, J. Chem. Soc., Dalton Trans., 1999, 1381 RSC; (e) P. Grandini, F. Mancin, P. Tecilla, P. Scrimin and U. Tonellato, Angew. Chem., Int. Ed., 1999, 38, 3061 CrossRef CAS; (f) B. Bodenant, T. Weil, M. Businelli-Pourcel, F. Fages, B. Barbe, I. Pianet and M. Laguerre, J. Org. Chem., 1999, 64, 7034 CrossRef CAS; (g) G. Klein, D. Kaufmann, S. Schurch and J. Reymond, Chem. Commun., 2001, 561 RSC; (h) Y. Zheng, Q. Huo, P. Kele, F. M. Andreopoulos, S. M. Phamand and R. M. Leblanc, Org. Lett., 2001, 3, 3277 CrossRef CAS PubMed; (i) Y. Zheng, K. M. Gattás-Asfura, V. Konka and R. M. Leblanc, Chem. Commun., 2002, 2350 RSC; (j) Y. Zheng, J. Orbulescu and X. Ji, J. Am. Chem. Soc., 2003, 125, 2680 CrossRef CAS PubMed; (k) M. Boiocchi, L. Fabbrizzi, M. Licchelli, D. Sacchi, M. Vazquez and C. Zampa, Chem. Commun., 2003, 1812 RSC; (l) B. C. Roy, B. Chandra, D. Hromas and S. Mallik, Org. Lett., 2003, 5, 11 CrossRef CAS PubMed; (m) S. Kaur and S. Kumar, Tetrahedron Lett., 2004, 45, 5081 CrossRef CAS; (n) Y. Mei, P. A. Bentley and W. A. Wang, Tetrahedron Lett., 2006, 47, 2447 CrossRef CAS; (o) P. Ghosh, P. K. Bharadwaj, S. Mandal and S. Ghosh, J. Am. Chem. Soc., 1996, 118, 1553 CrossRef CAS; (p) B. Ramachandram and A. Samanta, Chem. Commun., 1997, 1037 RSC; (q) K. Rurack, M. Kollmannsberger, U. Resch-Genger and J. Daub, J. Am. Chem. Soc., 2000, 122, 968 CrossRef CAS; (r) J.-S. Yang, C.-S. Lin and C.-Y. Hwang, Org. Lett., 2001, 3, 889 CrossRef CAS PubMed; (s) Q. Wu and E. V. Anslyn, J. Am. Chem. Soc., 2004, 126, 14682 CrossRef CAS PubMed; (t) Z. C. Weng, R. Yang, H. He and Y. B. Jiang, Chem. Commun., 2006, 7, 106 Search PubMed; (u) H. Yang, Z. Q. Liu, Z. G. Zhou, E. X. Shi, E. Y. Li, Y. K. Du, T. Yi and C. H. Huang, Tetrahedron Lett., 2006, 47, 2911 CrossRef CAS; (v) L. Xue, C. Liu and H. Jiang, Org. Lett., 2009, 11, 1655 CrossRef CAS PubMed and references there in; (w) X. Wu, B. Xu, H. Tong and L. Wang, Macromolecules, 2010, 43, 8917 CrossRef CAS.
  10. (a) P. N. Confalone, J. Heterocycl. Chem., 1990, 27, 31 CrossRef CAS; (b) S. Voutsadaki, G. K. Tsikalas, E. Klontzas, G. E. Froudakis and H. E. Katerinopoulos, Chem. Commun., 2010, 46, 3292 RSC; (c) F. Loe-Mie, G. Marchand, J. Berthier, N. Sarrut, M. Pucheault, M. Blanchard-Desce, F. Vinet and M. Vaultier, Angew. Chem., Int. Ed., 2010, 49, 424 CrossRef CAS PubMed; (d) G. U. Reddy, V. Ramu, S. Roy, N. Taye, S. Chattopadhyay and A. Das, Chem. Commun., 2014, 50, 14421 RSC.
  11. (a) F. H. Kasten, Introduction to Fluorescent probes; Properties, History and Applications, Academic Press, 2nd edn, 1999 Search PubMed; (b) K.-B. Li, Y. Zang, H. Wang, J. Li, G.-R. Chen, T. D. James, X.-P. He and H. Tian, Chem. Commun., 2014, 50, 11735 RSC.
  12. (a) P. G. Cozzi, Chem. Soc. Rev., 2004, 33, 410 RSC; (b) T. Katsuki, Chem. Soc. Rev., 2004, 33, 437 RSC; (c) J. D. Bois, J. Hong, E. M. Carreira and M. W. Day, J. Am. Chem. Soc., 1996, 118, 915 CrossRef; (d) W. A. Herrmann, M. U. Rauch and G. R. Artus, Inorg. Chem., 1996, 35, 1988 CrossRef CAS; (e) A. Hori, T. Ozawa, H. Yoshida, Y. Imori, Y. Kuribayashi, E. Nakano and N. Azuma, Inorg. Chim. Acta, 1998, 281, 207 CrossRef CAS; (f) K. Wen, S. Yu, Z. Huang, L. Chen, M. Xiao, X. Yu and L. Pu, J. Am. Chem. Soc., 2015, 137, 4517 CrossRef CAS PubMed; (g) A. Bhattacharyya, S. Ghosha and N. Guchhait, RSC Adv., 2016, 6, 28194 RSC.
  13. A. Duatti, A. Marchi, S. A. Luna, G. Bandoli, U. Mazzi and F. Tisato, J. Chem. Soc., Dalton Trans., 1987, 4, 867 RSC.
  14. N. W. Baylor, W. Egan and P. Richman, Vaccine, 2002, 20, 18 CrossRef.
  15. (a) A. V. Varnes, R. B. Dodson and E. L. Whery, J. Am. Chem. Soc., 1972, 94, 946 CrossRef CAS PubMed; (b) J. A. Kemlo and T. M. Shepherd, Chem. Phys. Lett., 1977, 47, 158 CrossRef CAS; (c) K. Rurack, U. Resch, M. Senoner and S. Daehne, J. Fluoresc., 1993, 3, 141 CrossRef CAS PubMed.
  16. M. G. Soni, S. M. White, W. G. Flamm and G. A. Burdock, Regul. Toxicol. Pharmacol., 2001, 33, 66 CrossRef CAS PubMed.
  17. W. A. Banks and A. J. Kastin, Neurosci. Biobehav. Rev., 1989, 13, 47 CrossRef CAS PubMed.
  18. (a) W. Wang, O. Rusin, X. Xu, K. K. Kim, J. O. Escobedo, S. O. Fakayode, K. A. Fletcher, M. Lowry, C. M. Schowalter, C. M. Lawrence, F. R. Fronczek, I. M. Warner and R. M. Strongin, J. Am. Chem. Soc., 2005, 127, 15949 CrossRef CAS PubMed; (b) H. Lee and H. Kim, Org. Biomol. Chem., 2013, 11, 5012 RSC; (c) H. N. Kim, M. H. Lee, H. J. Kim, J. S. Kim and J. Yoon, Chem. Soc. Rev., 2008, 37, 1465 RSC.
  19. M. Beija, C. A. M. Afonso and J. M. G. Martinho, Chem. Soc. Rev., 2009, 38, 2410 RSC.
  20. (a) R. Sjoback, J. Nygren and M. Kubista, Spectrochim. Acta, Part A, 1995, 51, L7–L21 CrossRef; (b) A. Minta, J. P. Kao and R. Y. Tsien, J. Biol. Chem., 1989, 264, 8171 CAS.
  21. M. Król, M. Wrona, C. S. Page and P. A. Bates, J. Chem. Theory Comput., 2006, 2, 1520 CrossRef PubMed.

Footnote

Electronic supplementary information (ESI) available: Experimental procedures, spectroscopic data and different calculated data and graph (PDF). See DOI: 10.1039/c6ra03021a

This journal is © The Royal Society of Chemistry 2016
Click here to see how this site uses Cookies. View our privacy policy here.