DOI:
10.1039/C6RA03020C
(Paper)
RSC Adv., 2016,
6, 28406-28418
Mycobacterium tuberculosis histidinol dehydrogenase: biochemical characterization and inhibition studies†
Received
1st February 2016
, Accepted 10th March 2016
First published on 11th March 2016
Abstract
HisD-Encoded histidinol dehydrogenase (HisD) catalyzes the two last chemical reactions of the L-histidine biosynthetic pathway, namely the conversion of L-histidinol (L-Hol) to L-histidinaldehyde (L-Hal) and to L-histidine (L-His). The hisD gene product has been shown to be essential for Mycobacterium tuberculosis survival in vitro. Herein, we describe a series of biochemical studies on recombinant Mycobacterium tuberculosis HisD (MtHisD). The synthesis of hydrazones derived from L-histidine yielded inhibitors in the low micromolar range, one of which showed moderate anti-Mtb activity. The compounds described here are, to the best of our knowledge, the first inhibitors of MtHisD activity reported in the literature, and they could become promising candidates for future development.
Introduction
Tuberculosis (TB) continues to claim thousands of lives annually. According to the World Health Organization (WHO), 9.6 million new cases of the disease were reported worldwide in 2014 with 1.5 million deaths.1 The elevated adaptive capacity of Mycobacterium tuberculosis (Mtb), the main etiological agent of human TB, and inappropriate treatments have fuelled the emergence of multi-drug-resistant (MDR-TB) and extensively drug-resistant (XDR-TB) strains for which available treatments are suboptimal and limited. Moreover, eradication of TB is hampered by asymptomatic infection from dormant or latent forms of mycobacteria, which have placed one-third of the world's population at lifelong risk for TB development from disease reactivation. To achieve infection control, there is an urgent need to develop drugs with novel mechanisms of action. Since the early 1960s, bedaquiline has been the sole drug presenting a new molecular target licensed for TB treatment. This ATP synthase targeted drug was approved for the treatment of adults with MDR-TB when other therapeutic alternatives are not available.2–4 Although treatment with bedaquiline has been described as a promising strategy against MDR-TB strains, its possible cardiac safety concerns5 and the rapid emergence of new drug-resistant strains have emphasized the need for continuing efforts to discover new TB drugs.
Within this context, the enzymes of the biosynthetic L-histidine pathway have emerged as attractive targets for the design and development of novel lead compounds, which can hopefully become innovative anti-mycobacterial drugs.6 This pathway utilizes ten enzymatic reaction steps to convert phosphoribosyl pyrophosphate (PRPP) and ATP to L-histidine. Unlike mammals, the L-histidine pathway is present in prokaryotic organisms, lower eukaryotic organisms, and plants.7–9 Consequently, the L-histidine pathway enzymes have been described as potential targets for the development of new herbicides and antimicrobial compounds endowed with selective toxicity.10,11 It is important to note that this route shows connections to other biosynthetic pathways such as purine and tryptophan biosynthesis,6,8,12 making it an important biochemical hub. The bifunctional histidinol dehydrogenase (EC 1.1.1.23), encoded by the hisD gene, is responsible for the two last reactions of this pathway, the NAD+- and Zn+-dependent conversion of L-histidinol (L-Hol) to L-histidine (L-His) through an L-histidinaldehyde (L-Hal) intermediate,13–15 leading to the concomitant reduction of 2 NAD+ molecules. The importance of L-histidinol dehydrogenase for virulence has been demonstrated in pathogenic bacteria such as Brucella suis (B. suis),16 Salmonella typhimurium (S. typhimurium),17 and Burkholderia pseudomallei (B. pseudomallei).18
In Mtb, the enzyme histidinol dehydrogenase (MtHisD) has been reported to be essential for survival and mycobacterial virulence.19–22 Indeed, there is an apparent inability of histidine auxotrophs of Mtb to survive single-amino acid starvation under standard culture conditions,19 and the hisD gene has been described as essential for in vitro mycobacterial growth.20,22 Incidentally, MtHisD has been classified among the top 50 targets by the TDR Targets Database.21 This rank takes into account aspects such as the existence of a solved structure or structure model, essentiality in any species, the absence of a human ortholog, and expression during latency or dormancy. Accordingly, we have previously reported kinetic, thermodynamic and structural analyses of MtHisD to aid the medicinal chemistry campaigns based on the rational drug design.23 We have proposed that MtHisD follows a Bi Uni Uni Bi Ping-Pong mechanism in which L-Hol is the first substrate to bind and that L-His is the last product to dissociate and that the amino-acid side chains of His336 and Glu335 are likely involved in catalysis and/or substrate binding.23 Accordingly, imidazole-containing substrate analogues are likely to bind to free enzyme.
Our initial purpose was to try and maintain the possible polar non-covalent interaction mediated by the imidazole ring of L-Hol with catalytic amino acid residue His336 by synthesizing molecules with structural characteristics obtained from the substrate (L-Hol), intermediate (L-Hal), and product (L-His) of the enzyme-catalyzed chemical reaction. In addition, the designed compounds could explore the hydrophobic pocket near the NAD+ in the catalytic site of MtHisD in accordance with previously published data from orthologous enzymes.24
As an improved understanding of the mode of action of MtHisD could help further medicinal chemistry efforts, here we present pre-steady kinetics studies, the activation energy of the catalyzed reaction, solvent kinetic isotope effects, proton inventory, and molecular crowding effects. Data on synthesis of hydrazones using L-histidine as a scaffold and their evaluation as MtHisD enzyme inhibitors were described. In addition, docking experiments were performed to provide a three-dimensional picture of the interaction mode of selected inhibitors. The inhibitory activity on the growth of Mtb (minimum inhibitory concentration (MIC)) was also evaluated.
Experimental
All reagents for enzyme activity measurements and inhibition assays were purchased from Sigma-Aldrich and were used without further purification. All measurements were performed at least in duplicate, and the biochemical data, when necessary, were analyzed using the program SigmaPlot 10.0 (Systat Software, Inc.).
Enzyme assays
Cloning and overexpression of the hisD-encoding gene from Mycobacterium tuberculosis, purification, and determination of the true steady-state kinetic constants were performed as previously described.23
The reaction mixture used to determine the steady-state kinetic parameters for the histidinol substrate consisted of variable concentrations of L-Hol (2–120 μM) and a fixed-saturating concentration of NAD+ (2 × 10⁵ μM). For the NAD+ substrate, variable concentrations of NAD+ (700–20![[thin space (1/6-em)]](https://www.rsc.org/images/entities/char_2009.gif) 000 μM) and a fixed-saturating concentration of L-Hol (200 μM) were used. Both assays were performed using 50 mM PIPES as buffer, pH 7.2 (0.5 mL final volume) at 25 °C, and the change in absorbance at 340 nm was monitored using a spectrophotometer (UV-2550 UV/visible, Shimadzu). One unit of enzyme activity (U) is defined as the amount of enzyme catalyzing the conversion of 1 μmol of substrate per minute in an optical path of 1 cm. The Michaelis–Menten constant (KM) and kcat values were calculated from eqn (1) and (2),25 respectively:
000 μM) and a fixed-saturating concentration of L-Hol (200 μM) were used. Both assays were performed using 50 mM PIPES as buffer, pH 7.2 (0.5 mL final volume) at 25 °C, and the change in absorbance at 340 nm was monitored using a spectrophotometer (UV-2550 UV/visible, Shimadzu). One unit of enzyme activity (U) is defined as the amount of enzyme catalyzing the conversion of 1 μmol of substrate per minute in an optical path of 1 cm. The Michaelis–Menten constant (KM) and kcat values were calculated from eqn (1) and (2),25 respectively:
| |
 | (1) |
| |
 | (2) |
where
v is the steady-state velocity,
Vmax is the maximal rate, [S] is the substrate concentration,
KM is the Michaelis constant,
kcat is the catalytic constant, and [E]
t is total concentration of enzyme.
Pre-steady-state kinetics
The increase in absorbance at 340 nm was monitored at 25 °C using an SX-18MV-R stopped-flow spectrofluorimeter (Applied Photophysics). The mixing chamber concentrations of enzyme and reagents in 50 mM PIPES pH 7.2 buffer were: MtHisD at 10 μM, NAD+ at 5 × 10⁴ μM, and L-Hol at 1000 μM. The reaction time was 100 s. These measurements were performed to determine whether product release is part of the rate-limiting step. The control experiment was performed under the same conditions, but in the absence of enzyme. The data were fitted to eqn (3).| | |
A = A0e−kt
| (3) |
where A is the absorbance at time t, A0 is the absorbance at time zero, and k is the apparent first-order rate constant for product formation.
Energy of activation (Ea)
To determine the energy of activation of the MtHisD-catalyzed chemical reaction, initial velocities were measured in the presence of saturating concentrations of both substrates (L-Hol 200 μM; NAD+ 2 × 10⁵ μM), at temperatures varying from 15 to 40 °C. The enzyme was incubated for three minutes at all temperatures tested and assayed under standard conditions. The Ea was calculated from the slope (Ea/R) of the Arrhenius plot fitting the data to eqn (4). With this result, we can estimate the thermodynamic activation parameters, such as the enthalpy (ΔH#), free Gibbs energy (ΔG#) and entropy (ΔS#), from the transition state theory26 (eqn (5)–(7)), respectively.| |
 | (4) |
| |
 | (6) |
| |
 | (7) |
where R is the universal gas constant (8.314 J mol−1 K−1), A is the Arrhenius constant, which represents the product of the collision frequency (Z) and a steric factor (p) based on the collision theory of enzyme kinetics,26 T is the temperature in Kelvin (T = °C + 273.15), kB is the Boltzmann constant (1.3805 × 10⁻²³ J K−1), and h is Planck's constant (6.6256 × 10⁻³⁴ J s−1). The error in ΔG# was calculated using eqn (8).| |
 | (8) |
Solvent kinetic isotope effects (SKIE) and proton inventory
Solvent kinetic isotope effects were determined by measuring initial velocity in the presence of varying concentrations of one of the substrates (L-Hol 4–200 μM or NAD+ 100–20000 μM) and a fixed-saturating concentration of the other substrate (L-Hol 200 μM or NAD+ 2 × 10⁵ μM). Both reactions were carried out in H2O and in 90 atom% D2O. Furthermore, the reactions were performed in 50 mM PIPES, pH 7.2, and in 50 mM Tris–HCl, pH 9.0 and enzyme velocity measurements were carried out at 25 °C. The data were fitted to eqn (9). The proton inventory was determined at 25 °C using saturating concentrations of both substrates (L-Hol 200 μM and NAD+ 2 × 10⁵ μM) at different mole fractions of D2O (0–90%) in 50 mM PIPES, pH 7.2, or 50 mM Tris–HCl (pH 9.0). The solvent kinetic isotope effect data were fitted to eqn (9);27 in which V is the maximal velocity, A is the substrate concentration, K is the Michaelis constant for A, EV/K and EV are the isotope effects −1 on V/K and V, respectively, and Fi is the fraction of deuterium label in the substrate.| |
 | (9) |
The dome-shaped proton inventory data (Fig. 4) at pH 7.2 were fitted to eqn (10), and the linear data (Fig. 4 – inset) at pH 9.0 were fitted to eqn (11),27 in which nk is equal to the ratio kn/k1 and D2Ok is equal to the ratio k0/k1, thus kn is the kcat at each atom% D2O, k0 is the kcat with H2O, n is the atom% D2O, ϕT and ϕR represent transition state and reactant state fractionation factors, respectively. The superscripts T1 and T2 represent two different transition states in the reaction mechanism of MtHisD that contribute to solvent isotope effects.
| |
 | (10) |
| | |
nk = D2Ok(1 − n + nϕT)
| (11) |
Molecular crowding
The enzyme assay for L-Hol was carried out by varying the concentration of L-Hol (2–120 μM) and using a fixed-saturating concentration of NAD+ (2 × 10⁵ μM). For NAD+, we used varying concentrations of NAD+ (700–20000 μM) and a fixed-saturating concentration of L-Hol (120 μM). The reactions were all performed at 25 °C in the absence or in the presence of 100 or 200 g L−1 of the inert polymer Ficoll PM70 (Sigma-Aldrich). The apparent parameters (KM, kcat, and specificity constant) were compared in the presence and absence of Ficoll.
Synthesis of hydrazone derivatives 4a–k
A simple three-step strategy was applied for the synthesis of histidinol dehydrogenase inhibitors. In the first step, L-histidine 1 was allowed to react with thionyl chloride in methanol, providing L-histidine methyl ester 2 with 96% yield (Scheme 1). Ester 2 was then reacted with hydrazine hydrate in methanol reflux, leading to hydrazide 3 with 80% yield.28 It is noteworthy that the role of NH2NH2·H2O in this step is both to react with the ester moiety and to neutralize the medium, affording a nucleophilic unprotonated hydrazide. Another aspect that deserves to be mentioned is the labored separation of 3 from excess hydrazine hydrate impurities because this nucleophile was used in a 2.1:1 molar ratio in relation to L-histidine methyl ester 2. To accomplish this task, we developed an alternative strategy: to react the crude product with 4-fluorobenzaldeyde in ethanol. In this way, the unwanted 4-(fluorobenzylidene)hydrazine precipitated, and pure 3 was obtained as a pale yellow oil.
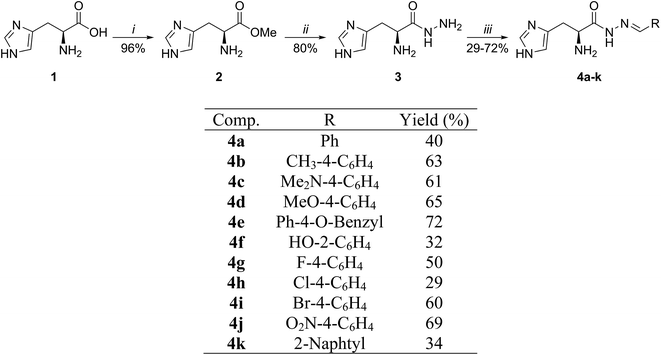 |
| | Scheme 1 Reactants and conditions: (i) = SOCl2, MeOH, 65 °C, 16 h. (ii) = (1) NH2NH2·H2O, MeOH, 65 °C, 16 h; (2), 4-fluorobenzaldehyde, EtOH, 25 °C, 1 h. (iii) = Benzaldehyde, EtOH, 79 °C, 4 h. | |
With the precursor 3 in hand, it was reacted with a number of aldehydes, providing the products 4a–k with yields ranging from moderate to good (Scheme 1). All synthesized compounds showed spectroscopic and spectrometric data in accordance with the proposed structures (ESI†).
Inhibition studies
Measurements of enzyme activity for inhibition studies were all carried out at 25 °C. The presence of time-dependent inhibitory activity was examined for the compounds synthesized. For this analysis, 1.5 μM of recombinant MtHisD was pre-incubated with 2 μM of inhibitor. Afterward, aliquots were removed at different times (up to 30 min) and added to the reaction mixture (L-Hol, NAD+, 50 mM PIPES pH 7.2 and H2O, and final concentration of 3% DMSO). The change in initial versus time was monitored, and the percentage of inhibition was calculated.
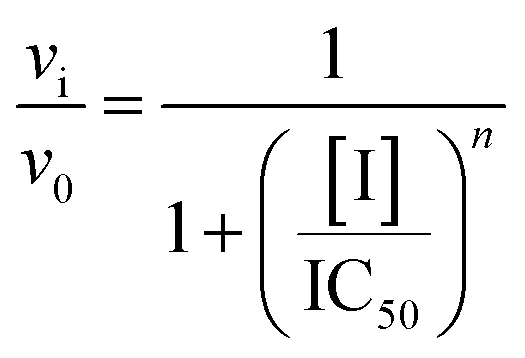
To perform IC50 determinations, the compounds (dissolved in DMSO) were added at various concentrations, ranging from 0–120 μM, to the reaction mixture containing MtHisD. The concentration of the added substrates (L-Hol and NAD+) was fixed in KM values23 in the presence of 3% DMSO (a concentration that did not interfere with the assay conditions). The reactions were carried out at 25 °C in 50 mM PIPES pH 7.2 under standard conditions. The IC50 value, which defines the concentration of inhibitor required to reduce in 50% the initial enzyme activity, was determined by fitting the data to eqn (12).
| |
 | (12) |
in which
vi and
v0 are, respectively, the reaction velocity in the presence and in the absence of inhibitor (I).
29
The inhibition constant (Kis) towards L-Hol was determined for compounds with IC50 values lower than 2.5 μM. The reaction mixture contained 0.36 μM of the enzyme, varying concentrations of L-Hol (2–120 μM), NAD+ at the KM concentration, and inhibitor at concentrations ranging from 0.5 to 30 μM. All enzyme velocity measurements were carried out at carried out at 25 °C. The Kis values were calculated from data fitting to competitive inhibition equation (eqn (13)), and the experimental data and predicted values were plotted as double-reciprocals as described by Lineweaver and Burk.30
| |
 | (13) |
where
V is the maximal velocity,
KM is the Michaelis–Menten constant, [S] is the substrate concentration, I is the inhibitor concentration, and
Kis is the equilibrium dissociation constant for the enzyme–inhibitor complex.
31
The equilibrium dissociation constant (Kd) for the lead-like compound 4k was determined by fluorescence spectroscopy (Shimadzu RF-5301 PC spectrofluorophotometer). The excitation wavelength was 280 nm, and emission spectra were collected from 300 to 500 nm. The maximum value of fluorescence intensity at 334 nm was plotted as a function of increasing ligand concentration. The enzyme concentration was 2 μM (in 50 mM PIPES pH 7.2 buffer), and the compound concentration ranged from 0.499 to 4.93 μM. The enzyme and the compound were mixed and incubated for three minutes at assay temperature. Binary complex formation for each inhibitor concentration was measured by fluorescence titration, and the inner filter effect (50 mM PIPES buffer, pH 7.2, and varying concentration of the compounds, 0.499–4.93 μM) was subtracted. This experiment was performed at different temperatures (20, 25, and 30 °C). The dissociation constant values (Kd) were obtained from data fitting to eqn (14). The lnKd values were plotted against the inverse of the temperature values, and the standard enthalpy of binding (ΔH°) and entropy of binding (ΔS°) were calculated from data fitting to the van't Hoff equation (eqn (15)). An estimate of the standard Gibbs free energy of binding (ΔG°) can thus be derived from eqn (16).
| |
 | (14) |
| |
 | (15) |
F0 represents the initial fluorescence,
F is the observed fluorescence,
F∞ is the maximum change in fluorescence at saturating ligand (L) concentration,
Kd represents the equilibrium dissociation constant for protein:ligand binary complex formation,
R is the gas constant (8.314 J mol
−1 K
−1), and
T is the temperature in Kelvin.
Molecular docking experiments
These studies were performed to analyze the interaction mode of the selected compounds having Kis values for MtHisD inhibition lower than 5 μM. The enzyme and ligand structures were prepared using AutoDockTools 1.5.2, and docking simulations were performed with AutoDock 4.2, allowing flexibility in the ligands.32,33 The experiments were performed with the homology model structure of MtHisD associated with NAD+.23 Because the MtHisD active site is at the interface of two subunits, we used the dimeric form to perform all docking experiments. For all simulations, the 3D-grid dimension used to define the enzyme active site and to evaluate the scoring function was 60 × 60 × 60, with spacing of 0.375 Å. The Lamarckian Genetic Algorithm (LGA) was employed as the docking algorithm with 50 runs, and the remaining parameters were set to their default values except for number of evaluations, which was set to 2500000.
Determination of minimum inhibitory concentration (MIC)
The growth inhibitory activity of the compounds was tested against the Mycobacterium tuberculosis H37Rv strain and was determined by resazurin microtiter assay (REMA).34 Isoniazid was used as positive control. Mtb was cultivated in Middlebrook 7H9 (Difco) liquid medium supplemented with 10% (v/v) OADC (oleic acid, albumin, dextrose, catalase; Becton Dickinson), and 0.05% (m V−1) Tween 80 (Sigma). Initially, it was grown at 37 °C up to an optical density at 600 nm (OD600) between 0.6 and 0.8; then, it was diluted in Middlebrook 7H9 to an OD600 of 0.006. One hundred μL of Mtb inoculum were added to each well on a microplate containing 100 μL of the tested drug, or only Middlebrook 7H9 (control inoculum) to reach an OD600 of 0.003. Final drug concentrations ranged from 0.0078 to 4 μg mL−1 for isoniazid, and from 0.195 to 100 μg mL−1 for selected compounds. Plates were incubated for 7–9 days at 37 °C. Sixty microliters of 0.01% resazurin solution were added to each well; plates were re-incubated for additional 2 days. A change in color, from blue to pink, indicated the growth of bacteria, and the MIC was read as the minimum drug concentration that prevented the color change in resazurin solution. MIC values reported here represent an average of three tests carried out independently.
Results and discussion
MtHisD is a bifunctional four-electron dehydrogenase enzyme that catalyzes two subsequent reactions, the oxidation of L-Hol and the reduction of two NAD+ molecules,23 with the formation of two intermediaries (L-Hal and L-histidindiol).35 L-Hal is very unstable at neutral pH when not bound to HisD,14,15,36,37 making study of the half-reaction difficult. The intermediates do not dissociate from the active site during the overall catalysis.13 Another interesting aspect is that this enzyme has a single active site that carries out oxidations of both the L-Hol substrate and the L-Hal (aldehyde) intermediate.13,14 These specific features reveal that the understanding of this enzymatic reaction is complicated, but very interesting in kinetic terms. A better understanding of the enzymatic mechanism's steps and the enzyme's interactions is important for the rational design of enzymatic inhibitors.
A pre-steady-state kinetics assay was performed to determine whether release of the product participates as a limiting step of the reaction. Fitting the data to eqn (3) resulted in an apparent first-order rate constant value of 0.0604 ± 0.0002 s−1 (Fig. 1), which describes a single exponential curve. As no burst in NADH formation could be detected (Fig. 1), this result suggests that product release does not contribute to the rate-limiting step of MtHisD-catalyzed chemical reaction. Grubmeyer and Teng38 showed that no burst could be detected for HisD from Salmonella typhimurium (StHisD). These authors concluded that the overall rates of the first and second half-reactions were not dramatically different, and thus both rates contribute to the overall rate limitation.
 |
| | Fig. 1 Monophasic curve obtained in stopped-flow experiments, with single exponential enhancement in the absorbance at 340 nm upon conversion of NAD+ to NADH catalyzed by 10 μM MtHisD. The baseline represents the experimental control performed with 50 mM NAD+ and 1 mM L-Hol in 50 mM PIPES pH 7.2 in the absence of recombinant MtHisD enzyme. The inset highlights the curve at the time of 3 s. | |
Experiments to determine the energy of activation of the rate-limiting step for the MtHisD reaction were carried out. This energy represents the minimal amount of energy necessary to initiate the enzyme-catalyzed chemical reaction. The dependence of kcat on temperature at saturating concentrations of L-Hol (200 μM) and NAD+ (2 × 10⁵ μM) was linear (Fig. 2). The linearity of the Arrhenius plot suggests that there is no change in the rate-limiting step over the temperature range utilized in the assay. These data were fitted to eqn (4), yielding a value of 45 (±2) kJ mol−1 K−1, and the thermodynamic activation parameters were evaluated using eqn (5)–(7), yielding 42.25 (±0.04) kJ mol−1; 72.07 (±0.07) kJ mol−1; and −100 (±0.09) J mol−1 K−1 for ΔH#, ΔG#, and ΔS#, respectively. The positive value (unfavorable) of ΔH# and the negative value (unfavorable) of ΔS# may be tentatively ascribed to loss of rotational and translational freedom, leading to a more positive value of ΔG#. The positive value (unfavorable) of ΔG# represents the energy barrier to transforming ES in the ground state to the activated enzyme–substrate complex ES#.
 |
| | Fig. 2 Arrhenius plot for the temperature dependence of kcat. Initial velocities were measured in the presence of saturating concentrations of L-Hol (200 μM) and NAD+ (2 × 10⁵ μM), at temperatures varying from 15 to 40 °C. The linearity of the maximum velocity versus temperature function suggests that there is no change in the rate-limiting step. The measurements are performed in duplicate and the data are expressed as the means ± SD. | |
The solvent kinetic isotope effects data (Fig. 3) were fitted to eqn (9), and the values obtained are presented in Table 1. The effect of D2O on pH was recorded, and increasing in D2O fractions, even after two minutes of enzyme addition, did not change the pH value. These results show contribution of proton transfer from the solvent to the MtHisD-catalyzed chemical reaction. The fractionation factor (ϕ) is a measure of the stiffness or tightness of binding of a solute site versus the solvent sites. A general rule of thumb is that deuterium accumulates where binding is tighter (ϕ > 1); and correspondingly, protium accumulates where binding is looser (ϕ < 1).27 The fractionation factors of transition state protons contribute reciprocally to the solvent kinetic isotope effect, whereas the contribution of a reactant state proton to the isotope effect is equal to its fractionation factor. The values of V and V/K in the assay at pH 7.2 (Table 1) suggest a modest participation of the proton solvent in catalysis and for L-Hol binding, whereas there appears to be no proton solvent isotope participation in NAD+ binding (Fig. 3A and B). At pH 9.0, V and V/K showed normal solvent kinetic isotope effect for catalysis and inverse solvent isotope effect for L-Hol and NAD+ binding (Fig. 3 – insets; Table 1). The reactant state for V/K is always free enzyme and free substrate and contribution of reactant state protons to solvent kinetic isotope effect is directly proportional to its fractionation factor. The reactant-state fractionation factors of functional groups that are involved in acid–base nucleophilic catalysis (e.g., carboxylic group of glutamate, N–H bond of histidine, phenolic OH of tyrosine, etc.) are usually near unity.27 It is thus tempting to suggest that at pH 9 there is an increase in the fractionation factor for transition state (deuterium accumulates in the transition state), whose reciprocal contribution results in an inverse V/K solvent kinetic isotope effect. Proton inventory experiments allow determination of the number of protons that are transferred during the solvent isotope-sensitive step, and can provide the basis for proposal of a model for the origins of solvent isotope effects on enzyme-catalyzed chemical reactions. The data at pH 7.2 showed a dome-shaped proton inventory (Fig. 4), which can have several mechanistic origins.27 A tentative explanation may be that more than a single proton is transferred and that both normal and inverse solvent contributions were giving rise to the observed SKIE. Incidentally, Grubmeyer and Teng38 reported a slightly convex downward curve in proton inventories, also suggesting the involvement of more than a single proton in the overall effect on StHisD. Fitting the data at pH 7.2 (Fig. 4) to eqn (10), in which the solvent isotope effect arises from a single offsetting reactant state (inverse SKIE) and two transition states (normal SKIE), appears to describe the experimental results. Although a crest-like curve in proton inventory could also be described by offsetting transition-state and medium contributions, the latter would require additional data to be invoked (e.g., solute stability, equilibrium binding). At any rate, the data interpretation here presented is suboptimal, as the half reactions were not studied separately, and thus, these fractionation factors were not determined. The reaction mechanism for HisD from Escherichia coli (E. coli)35 predicts at least two interactions between the transition states and the neighboring water molecule, which can influence SKIE. First, the water is activated by the negative charge of Glu326 (Glu335 in MtHisD) and makes a nucleophilic attack on the carbonyl group of L-Hal, forming an L-histidindiol (gem-diol) intermediate. The unprotonated His327 of E. coli HisD (EcHisD) (corresponding the conserved His336 in MtHisD) abstracts a proton of the hydroxyl group bound to sp3 carbon of L-histidindiol intermediate followed by hydride transfer to NAD+ and formation of L-His. The protonated His327 of EcHisD is restored to the neutral state by donation of a proton to the nearby water molecule.35 This proposed mechanism suggests that invoking two or more transition states to explain the proton inventory data here presented is warranted. However, additional studies are needed to clarify the exact fractionation factors that are influencing the SKIE. The proton inventory data at pH 9.0, on the other hand, suggest that a single transition-state proton transfer contributes to the solvent isotope effect (Fig. 4 – inset). Accordingly, the data were fitted to eqn (11). The proton inventory data at pH 9 are consistent with the normal solvent kinetic isotope effect for catalysis (Table 1).
 |
| | Fig. 3 Solvent kinetic isotope effects in (A) varying concentration of L-Hol (4–200 μM) and fixed-saturating concentration of NAD+ (200 mM) at pH 7.2 (inset at pH 9.0), in (B) varying concentration of NAD+ (1–20 mM) and fixed-saturating concentration of L-Hol (200 μM) at pH 7.2 (inset at pH 9.0). The lines represent fits to eqn (9). The values were obtained in either 0 (●) or 90 (■) atom% D2O. | |
Table 1 Solvent kinetic isotope effects for MtHisD
| Parametersa |
Isotope effect pH 7.2 |
Isotope effect pH 9.0 |
| V/K values are in U mg−1 μM−1. |
| V/KL-Hol |
1.52 ± 0.32 |
0.61 ± 0.10 |
| VL-Hol |
1.24 ± 0.06 |
1.39 ± 0.01 |
| V/KNAD+ |
0.98 ± 0.04 |
0.60 ± 0.08 |
| VNAD+ |
1.30 ± 0.02 |
1.44 ± 0.06 |
 |
| | Fig. 4 Proton inventory using saturating concentrations of both substrates and variable atom% D2O in 50 mM PIPES pH 7.2. The inset shows the proton inventory in 50 mM Tris–HCl pH 9.0. The determinations are carried out in duplicate and the data are expressed as the means ± SD. | |
It is known that the rate limiting chemical step can change as the pH changes, and the magnitude of the isotope effects on V and V/K change depending on the contribution of the isotope-sensitive step to overall rate limitation at saturating and limiting reactant concentrations, respectively.39 According to the results here presented, the pH-dependent steps are isotope-sensitive. The difference of SKIE at two pHs can be related to the pKa values of the residues involved in catalysis and L-Hol binding. The apparent pK value of L-Hol binding to free MtHisD is approximately 8 ± 3 (the value attributed to conserved histidine residues in the active site).23 Titration profiles for StHisD using L-Hol suggested an aminoacid side chain with pK values of 8.17 and 8.35 that are essential for, respectively, catalysis and L-Hol substrate binding.38 It is likely that the imidazole side chain of His336 in MtHisD is involved in coth L-Hol binding and catalytic activity of first and second hydride transfer in the reaction.23 The differences in the results of the proton inventory, in the two tested pH, may be related to deprotonation of His336 at pH 9.0. As the physiological pH of the host is approximately 7.2, the results of SKIE and proton inventory at this pH reproduce with more reliability the environment found by Mtb when it infects a human cell. Following this line of reasoning, in an attempt to simulate the host cellular environment and to validate our results obtained in aqueous medium, crowding assays were performed.
Molecular crowding was carried out using an inert polymer to try to reproduce a cell-like environment with high concentrations of macromolecules. The values of steady-state kinetic parameters (KM, kcat, and specificity constant) in a solution containing Ficoll at two different concentrations in comparison to these parameters in the absence of Ficoll are presented in Table 2. These results validated our experiments with MtHisD in aqueous solvent. Other works have obtained similar results. Molecular crowding experiments with phosphoglycerate kinase, glyceraldehyde-3-phosphate dehydrogenase, and acylphosphatase I enzymes in the presence of crowding agents also showed no influence of crowding agents on the kinetic parameters.40
Table 2 Comparison of steady-state kinetics constants of MtHisD in molecular crowding
| Substrate |
Ficoll (g L−1) |
KM (M) |
kcat (s−1) |
kcat/KMa (M s−1) |
| Specificity constant. |
| L-Hol |
— |
20 (±5) × 10−6 |
1.436 ± 0.001 |
7 (±2) × 104 |
| 100 |
17 (±1) × 10−6 |
1.209 ± 0.027 |
7.3 (±0.6) × 104 |
| 200 |
22 (±5) × 10−6 |
1.209 ± 0.083 |
6 (±1) × 104 |
| NAD+ |
— |
2.9 (±0.1) × 10−3 |
1.361 ± 0.038 |
4.7 (±0.2) × 102 |
| 100 |
2.7 (±0.1) × 10−3 |
1.134 ± 0.007 |
4.2 (±0.1) × 102 |
| 200 |
3.3 (±0.4) × 10−3 |
0.227 ± 0.015 |
69 (±10) |
Designed compounds 4 were synthesized in three steps with moderate to good yields (29–72%). The best yields were obtained for the reactions of 4-nitro-benzaldehyde (69%) and 4-benzyloxi-benzaldehyde (72%). However, 2-naphthaldehyde and 4-cholorobenzaldehyde converted to hydrazone derivatives with only 34% and 29% yield, respectively (for further information on synthesis of compounds, see the ESI†).
After obtaining the compounds, the next step was to evaluate them as possible inhibitors of the reaction catalyzed by MtHisD. Inhibition studies of S. typhimurium,41 cabbage, E. coli,10 and B. suis HisD24,28,42 have been reported in the literature.6 In their first range of inhibitors, Abdo and colleagues42 proposed benzylic ketones derived from L-His as inhibitors of B. suis HisD (BsHisD) activity. In that report, an increased inhibition capacity of compounds with substitutions at the 4-position of the aromatic moiety was observed. The most effective compounds for inhibition of BsHisD from the first library of compounds were 4-bromo and 4-benziloxy derivates.42 A second series of L-histidinylphenylsulfonyl hydrazides28 was less active than the one previously described, indicating that the nature and the length of the linker between the histidinyl moiety and the phenyl ring as well as the second lipophilic pocket binding the cofactor NAD+ are important factors that can modulate the potency of new potential inhibitors.24 It is important to emphasize that there is no report in the literature describing MtHisD inhibition studies,6 and the synthesized inhibitors compounds previously published for orthologous enzymes are chemically different from the synthesized compounds in this work. Abdo and colleagues studied the most promising series HisD inhibitors for BsHisD,24,42 but differences between the HisD of the B. suis and of the M. tuberculosis should be considered and these are showed in the Fig. 5.
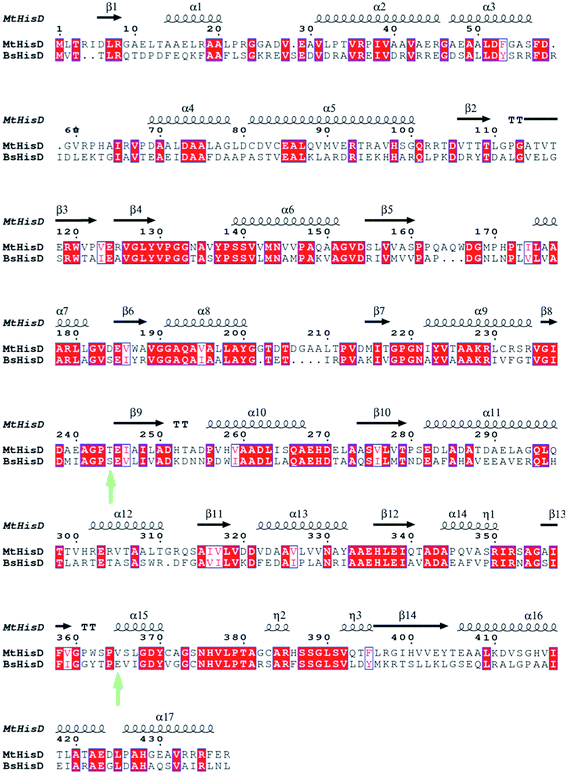 |
| | Fig. 5 Sequence alignment of MtHisD and BsHisD. The green arrows are highlighting the mutation encountered into the binding cavity. M. tuberculosis present a more hydrophobic binding site when compared to B. suis, since the physical–chemical properties of its residues (T244 and V357). The secondary structure was obtained based on the homology model of MtHisD. All conserved residues are highlighted in red. Image generated with ESPript 3.0.44 | |
Table 3 shows the IC50 values against MtHisD activity for eleven compounds synthesized from L-histidine (Scheme 1) (for further information on IC50 measures, see the ESI†). No one of the ligands exhibited time-dependent inhibitory activity (data not shown). From these data, one can conclude that in general, compounds containing electron withdrawing groups at the 4-position of phenyl moieties demonstrated an increased inhibition capacity. Indeed, the 4-fluor-(4g), and 4-cloro-(4h), and 4-nitro-substituted compounds (4j) showed IC50 values of 2.4 ± 0.8 μM, 2.4 ± 0.4 μM, and 2.5 ± 0.2 μM, respectively. Polarization effects that modify the dipole vector of the compounds, facilitating van der Waals interactions, could thus rationalize these results. In accordance with previously reported data,24,42 compounds with bulky substituents have shown better IC50 values for inhibiting HisD activity. The 2-naphthyl substituted compound 4k was able to inhibit the catalytic activity of MtHisD with an IC50 of 1.1 ± 0.2 μM. This planar π-electron rich group can make hydrophobic interactions with side chains of the amino acid residues of the active site of MtHisD.
Table 3 The IC50 values of the hydrazones derived from L-His
| Comp. |
R |
IC50 (μM) |
| 4a |
Ph |
29 ± 3 |
| 4b |
CH3-4-C6H4 |
5.5 ± 0.3 |
| 4c |
Me2N-4-C6H4 |
9.1 ± 0.3 |
| 4d |
MeO-4-C6H4 |
5 ± 1 |
| 4e |
Ph-4-O-benzyl |
9.8 ± 0.7 |
| 4f |
HO-2-C6H4 |
27 ± 2 |
| 4g |
F-4-C6H4 |
2.4 ± 0.8 |
| 4h |
Cl-4-C6H4 |
2.4 ± 0.4 |
| 4i |
Br-4-C6H4 |
7.7 ± 0.7 |
| 4j |
O2N-4-C6H4 |
2.5 ± 0.2 |
| 4k |
2-Naphtyl |
1.1 ± 0.2 |
The Kis values (Table 4) were determined with respect to L-Hol substrate for four selected compounds (IC50 values lower than 2.5 μM, and molecule 4e). Although hydrazone 4e did not show an IC50 value lower than 2.5 μM (9.8 ± 0.7 μM), this compound was selected for additional inhibition studies because of its high lipophilicity. This characteristic is interesting for further MIC determination.
Table 4 Inhibition constants of select compounds
| Comp. |
Kis (μM) |
| 4e |
3.2 ± 0.6 |
| 4g |
13 ± 2 |
| 4h |
0.64 ± 0.07 |
| 4k |
0.47 ± 0.06 |
All tested molecules showed a competitive inhibition profile determined from the straight-line patterns intersecting at the y-axis (Fig. 6).30 The competitive inhibition of the synthesized molecules, for L-Hol, corroborated the maintenance of chemical characteristics of substrate/product. These results evidence direct competition of the two ligands (substrate and inhibitor) for a common binding pocket on the enzyme molecule,29 where the tested compounds bind to the free enzyme and exclude the substrate L-Hol binding. This mode of inhibition reduces the apparent affinity of the substrate by an amount that depends on the concentration and affinity of the inhibitor. Therefore, the substrate will bind to only the enzyme through the displacement of the inhibitor.43
 |
| | Fig. 6 Determination of inhibition mode for selected compounds. (A) Represents 4e, (B) 4h, (C) 4g, and (D) 4k. The Lineweaver–Burk plots display lines that intersect at the y-axis, which are diagnostic of competitive inhibition for all compounds tested. Thus, the Vmax value is constant at all inhibitor concentrations, but the apparent value of KM increases with increasing inhibitor concentration. Each line represents a different inhibitor concentration fitted to eqn (14) in a double reciprocal plot of MtHisD specific activity by L-Hol substrate. | |
To verify the choice of binding mode of hydrazones 4a–k at the active site of MtHisD, molecular docking simulations were carried out for selected compounds showing Kis values lower than 5 μM. The selected molecules showed interactions with amino acid residues involved in both catalysis and substrate binding. These experiments considered the amino acid residues involved in binding of L-Hol, NAD+, and Zn2+ ion. These residues were determined in pH-rate profiles and molecular modeling experiments23 based on the tridimensional structure of EcHisD which was solved experimentally by X-ray diffraction at 1.7 Å resolution (PDB ID: 1KAE).35 MtHisD is a homodimeric enzyme, and its monomer (subunits A and B) possesses four globular domains.23 The two active sites are located at the boundary of the homodimer interface. Domains 1, 2, and 4 are related to L-Hol and Zn2+ binding, and domain 1 to NAD+ molecule binding.23 Ligand 4e was obtained to perform hydrophobic contacts with His376, which is involved in L-Hol binding (Fig. 7A), and Asp369. Therefore, the inhibitory capacity of compound 4e could be a consequence of its large structure occupying the binding site of the L-Hol pocket, rather than of its binding potential to enzyme residues involved in L-Hol binding. Compounds 4h and 4k implement hydrophobic contacts with His336 (Fig. 7B and C), also involved in L-Hol binding. This amino acid residue acts as a base to abstract the proton from a hydroxyl group, causing the α-carbon to adopt a sp2 configuration.35 However, compound 4h makes a hydrophobic interaction with Asp369, and the latter is involved in coordinating the Zn2+ ion (Fig. 7B). Considering that Zn2+ carries out an important function in the correct positioning of L-Hol,23,35 it is expected that those compounds acting as competitive inhibitors of L-Hol interact with the Zn2+-binding amino acid residues. The 4k molecule makes a hydrogen bond (H-bond) with Asp369OD2 (Fig. 7C). The 4h and 4k candidates can have H-bond interactions with His376ND1. The carbonyl backbones of this amino acid residue and of His336 are responsible for the formation of H-bonds with hydroxyl groups of the L-Hol substrate.23 Participation of the Glu335 in either catalysis or substrate binding had not been demonstrated in pH-rate profile experiments with MtHisD.23 However, in EcHisD-catalyzed reactions, Glu326 (corresponding to Glu335 in MtHisD) activates the water molecule at the second step of the reaction.35 The molecule 4h interacts by H-bonding with Glu335OE2, and this may interfere with activation of the water molecule and inhibit the nucleophilic attack on the reactive carbon for L-Hal. Compound 4k can make H-bonding interactions with Glu423OE1, which is related to L-Hol binding similarly to His336 and His376.23 In addition, the hydrogen interactions of the N4 atom from 4k imidazole portion with His376ND1 were determined to be very important because this amino acid residue interacts directly with the hydroxyl group of L-Hol.35 Finally, the number and relative force of the interactions performed by 4k in molecular recognition can explain its higher inhibitory activity on MtHisD. Equilibrium fluorescence spectroscopy data were fitted to eqn (14). As MtHisD has four tryptophan amino acid residues and seven tyrosine residues, changes in protein Trp and Tyr fluorescence upon ligand binding were monitored. Titration of MtHisD with the best ligand in inhibition assays (4k) showed a hyperbolic curve (Fig. 8), yielding Kd values of 0.62 ± 0.14 μM, 0.7 ± 0.1 μM, and 0.79 ± 0.15 μM, at 20 °C, 25 °C, and 30 °C, respectively. The Kd of 4k binding to MtHisD at 25 °C is in agreement with the Kis value of 0.47 μM for the same ligand. The Kd value of 4k was lower than the Kd of 9 μM for L-Hol:MtHisD binary complex formation obtained by ITC.23
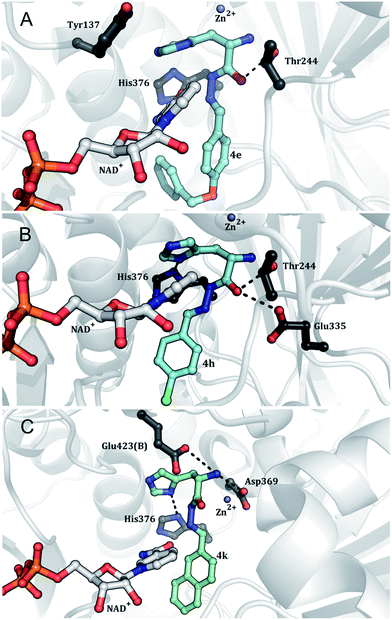 |
| | Fig. 7 Molecular docking results of MtHisD. The best docking poses of the compounds 4e (A), 4h (B), and 4k (C) into the MtHisD binding cavity. MtHisD tertiary structure is represented as cartoon colored in gray. The small molecules and the residues are represented as ball and stick models and colored in CPK, except the carbon atoms that are colored in black (residues), cyan (compounds), and gray (NAD+). Image generated with PyMOL.45 | |
 |
| | Fig. 8 Fluorescence spectroscopy of the equilibrium binding of compound 4k to MtHisD, plotting the relative fluorescence change as a function of 4k concentration at 25 °C, and residuals. | |
The van't Hoff equation (eqn (15)) allowed determination of the individual contributions of ΔH° and TΔS° of the inhibitor's Gibbs free energy of binding from measurements of Kd as a function of temperature (Fig. 9).29 The values obtained for ΔH° and ΔS° were −17.9 ± 0.2 kJ mol−1 (−4.28 ± 0.05 kcal mol−1), and 5.77 ± 0.052 × 10⁻² kJ mol−1 K−1 (1.3791 ± 0.0001 kcal mol−1 K−1), respectively. The negative value (favorable) of ΔH° achieved for ligation of compound 4k with free MtHisD showed the release of heat, in contrast to MtHisD:L-Hol ligation, which is unfavorable. In other words, it needs to absorb heat (positive value) to occur (ΔH° = 3.6 ± 0.5 kcal mol−1 (ref. 23)). However, the positive ΔS° value (favorable) obtained was lower than the ΔS° of binding for MtHisD:L-Hol binary complex formation (0.035 ± 0.013 kcal mol−1 K−1 (ref. 23)). Estimates for ΔG° values were calculated employing eqn (16), yielding a value for ΔG° of −35.1 ± 4.9 kJ mol−1 (−8.39 ± 1.17 kcal mol−1) in the temperature range of 20–30 °C. The favorable (negative) Gibbs free energy of binding demonstrates the spontaneous formation of the MtHisD:4k complex. Compared to the MtHisD:L-Hol binary complex ΔG° value of −7 ± 3 kcal mol−1,23 binding of 4k compound to free MtHisD is more favorable than the L-Hol substrate binding. This result is in accordance with the competitive inhibition of the L-Hol profile by compound 4k.
 |
| | Fig. 9 Dissociation constant as a function of temperature. The curve was fitted using the van't Hoff equation (eqn (15)), and the ΔH°, and ΔS° terms could be estimated. Data are expressed as the means ± SD. | |
Finally, minimum inhibitory concentration is defined as the lowest drug concentration that prevents a color change in the REMA plate method.34 Determination of MIC results for compound 4e demonstrated that 100 μg mL−1 of the inhibitor molecule is needed to stop Mtb growth. In addition, compounds 4h and 4k showed MICs > 100 μg mL−1. These results show that improvements in the molecule to increase its inhibitory potential and/or its ability to penetrate Mtb are necessary.
Conclusions
In summary, our results represent, in our opinion, an important advance in understanding the mechanism of the chemical reaction catalyzed by MtHisD. In addition, to the best of our knowledge, hydrazones derived from L-histidine are the first low micromolar inhibitors of MtHisD activity described in the literature. Moreover, these compounds presented moderate in vitro anti-Mtb activity against the M. tuberculosis H37Rv strain. Taken together, the results here presented are useful for the rational design of inhibitory molecules targeting MtHisD activity, which hopefully could be further developed into novel alternative therapeutics against tuberculosis.
Conflict of interest
The authors declare no competing financial interest.
Authors contribution
The manuscript was written through contributions of all authors. All authors have given approval to the final version of the manuscript.
Acknowledgements
This work was supported by Quatro G P&D Ltda., and FAPERGS/SEBRAE (FAPERGS n. 013/2011). Financial support was also provided by National Institute of Science and Technology on Tuberculosis (Decit/SCTIE/MS-MCT-CNPq-FNDCT-CAPES), FAPERGS (ARD/2012), and CNPq (Process number 478959/2013-3). O.N.S. (CNPq, 305984/2012-8), L.A.B. (CNPq, 5201182/99-5), D.S.S. (CNPq, 304051/1975-06), and P.M. (CNPq, 307878/2015-5) are research career awardees of the National Council for Scientific and Technological Development of Brazil (CNPq). The fellowships from CNPq, CAPES, and FAPERGS are also acknowledged.
References
- World Health Organization, Global Tuberculosis Report 2015, WHO Press, Geneva, 2015 Search PubMed.
- K. Andries, P. Verhasselt, J. Guillemont, H. W. H. Gohlmann, J.-M. Neefs, H. Winkler, J. van Gestel, P. Timmerman, M. Zhu, E. Lee, P. Williams, D. de Chaffoy, E. Huitric, S. Hoffner, E. Cambau, C. Truffot-Pernot, N. Lounis and V. Jarlier, Science, 2005, 307, 223–227 CrossRef CAS PubMed.
- M. R. De Jonge, L. H. M. Koymans, J. E. G. Guillemont, A. Koul and K. Andries, Proteins: Struct., Funct., Bioinf., 2007, 67, 971–980 CrossRef CAS PubMed.
- A. H. Diacon, A. Pym, M. Grobusch, R. Patientia, R. Rustomjee, L. Page-Shipp, C. Pistorius, R. Krause, M. Bogoshi, G. Churchyard, A. Venter, J. Allen, J. C. Palomino, T. De Marez, R. P. G. van Heeswijk, N. Lounis, P. Meyvisch, J. Verbeeck, W. Parys, K. de Beule, K. Andries and D. F. Mc Neeley, N. Engl. J. Med., 2009, 360, 2397–2405 CrossRef CAS PubMed.
- J. Avorn, JAMA, J. Am. Med. Assoc., 2013, 309, 1349–1350 CrossRef CAS PubMed.
- J. Lunardi, J. E. S. Nunes, C. V. Bizarro, L. A. Basso, D. S. Santos and P. Machado, Curr. Top. Med. Chem., 2013, 13, 2866–2884 CrossRef CAS PubMed.
- B. N. Ames, B. Garry and L. A. Herzenberg, J. Gen. Microbiol., 1960, 22, 369–378 CrossRef CAS PubMed.
- P. Alifano, R. Fani, P. Liò, A. Lazcano, M. Bazzicalupo, M. S. Carlamagno and C. B. Bruni, Microbiol. Rev., 1996, 60, 44–69 CAS.
- A. Stepansky and T. Leustek, Amino Acids, 2006, 30, 127–142 CrossRef CAS PubMed.
- J. E. Dancer, M. J. Ford, K. Hamilton, M. Kilkelly, S. D. Lindell, M. J. O'Mahony and E. A. Saville-Stones, Bioorg. Med. Chem. Lett., 1996, 6, 2131–2136 CrossRef CAS.
- K. Gohda, D. Ohta, G. Iwasaki, P. Ertl and O. Jacob, J. Chem. Inf. Comput. Sci., 2001, 41, 196–201 CrossRef CAS PubMed.
- A. V. Due, J. Kuper, A. Geerlof, J. P. von Kries and M. Wilmanns, Proc. Natl. Acad. Sci. U. S. A., 2011, 108, 3554–3559 CrossRef CAS PubMed.
- E. Adams, J. Biol. Chem., 1954, 209, 829–846 CAS.
- E. Adams, J. Biol. Chem., 1955, 217, 325–344 CAS.
- J. C. Loper and E. Adams, J. Biol. Chem., 1965, 240, 788–795 CAS.
- S. Kohler, V. Foulongne, S. Ouahrani-Bettache, G. Bourg, J. Teyssier, M. Ramuz and J. Liautard, Proc. Natl. Acad. Sci. U. S. A., 2002, 99, 15711–15716 CrossRef CAS PubMed.
- P. I. Fields, R. V. Swanson, C. G. Haidaris and F. Heffron, Proc. Natl. Acad. Sci. U. S. A., 1986, 83, 5189–5193 CrossRef CAS.
- S. Pilatz, K. Breitbach, N. Hein, B. Fehlhaber, J. Schulze, B. Brenneke, L. Eberl and I. Steinmetz, Infect. Immun., 2006, 74, 3576–3586 CrossRef CAS PubMed.
- T. Parish, J. Bacteriol., 2003, 185, 6702–6706 CrossRef CAS PubMed.
- C. M. Sassetti, D. H. Boyd and E. J. Rubin, Mol. Microbiol., 2003, 48, 77–84 CrossRef CAS PubMed.
- F. Aguero, B. Al-Lazikani, M. Aslett, M. Berriman, F. S. Buckner, R. K. Campbell, S. Carmona, I. M. Carruthers, A. W. E. Chan, F. Chen, G. J. Crowther, M. A. Doyle, C. Hertz-Fowler, A. L. Hopkins, G. McAllister, S. Nwaka, J. P. Overington, A. Pain, G. V. Paolini, U. Pieper, S. A. Ralph, A. Riechers, D. S. Roos, A. Sali, D. Shanmugam, T. Suzuki, W. C. van Voorhis and C. L. M. J. Verlinde, Nat. Rev. Drug Discovery, 2008, 7, 900–907 CrossRef PubMed.
- M. A. DeJesus, Y. J. Zhang, C. M. Sassetti, E. J. Rubin, J. C. Sacchettini and T. R. Ioerger, Bioinformatics, 2013, 29, 695–703 CrossRef CAS PubMed.
- J. E. S. Nunes, R. G. Ducati, A. Breda, L. A. Rosado, B. M. de Souza, M. S. Palma, D. S. Santos and L. A. Basso, Arch. Biochem. Biophys., 2011, 512, 143–153 CrossRef CAS PubMed.
- M.-R. Abdo, P. Joseph, J. Mortier, F. Turtaut, J.-L. Montero, B. Masereel, S. Kohler and J.-Y. Winum, Org. Biomol. Chem., 2011, 9, 3681–3690 CAS.
- I. H. Segel, Enzyme Kinetics – Behavior Analysis of Rapd Equilibrium and Steady-state Enzyme Systems, Wiley, Classics Library Edition, Wiley- interscience, John Wiley & Sons, Inc., Hoboken, NJ, 1993 Search PubMed.
- T. Lonhienne, E. Baise, G. Feller, V. Bouriotis and C. Gerday, Biochim. Biophys. Acta, 2001, 1545, 349–356 CrossRef CAS.
- P. F. Cook, Enzyme Mechanism from Isotope Effects, CRC Press, Boca Raton, 1991 Search PubMed.
- M.-R. Abdo, P. Joseph, R.-A. Boigegrain, J.-L. Montero, S. Kohler and J.-Y. Winum, J. Enzyme Inhib. Med. Chem., 2008, 23, 357–361 CrossRef CAS PubMed.
- R. A. Copeland, Evaluation of Enzymes Inhibitors in Drug Discovery: A Guide for Medicinal Chemists and Pharmacologists, Wiley-interscience, John Wiley & Sons, Inc., Hoboken, NJ, 1st edn, 2005 Search PubMed.
- H. Lineweaver and D. Burk, J. Am. Chem. Soc., 1934, 56, 658–666 CrossRef CAS.
- R. A. Copeland, Enzymes: A Practical Introduction to Structure, Mechanism, and Data Analysis, Wiley-interscience, John Wiley & Sons, Inc., Hoboken, NJ, 2nd edn, 2000 Search PubMed.
- G. M. Morris, R. Huey, W. Lindstrom, M. F. Sanner, R. K. Belew, D. S. Goodsell and A. J. Olson, J. Comput. Chem., 2009, 30, 2785–2791 CrossRef CAS PubMed.
- D. S. Goodsell and A. J. Olson, Proteins: Struct., Funct., Bioinf., 1990, 8, 195–202 CrossRef CAS PubMed.
- J.-C. Palomino, A. Martin, M. Camacho, H. Guerra, J. Swings and F. Portaels, Antimicrob. Agents Chemother., 2002, 46, 2720–2722 CrossRef CAS PubMed.
- J. A. R. G. Barbosa, J. Sivaraman, Y. Li, R. Larocque, A. Matte, J. D. Schrang and M. Cygler, Proc. Natl. Acad. Sci. U. S. A., 2002, 99, 1859–1864 CrossRef CAS PubMed.
- E. Adams, J. Biol. Chem., 1955, 217, 317–324 CAS.
- H. Gorish and W. Holke, Eur. J. Biochem., 1985, 150, 305–308 CrossRef.
- C. Grubmeyer and H. Teng, Biochemistry, 1999, 38, 7355–7362 CrossRef CAS PubMed.
- P. F. Cook and W. W. Cleland, Enzyme Kinetics and Mechanism, Garland Science Publishing, NY, 2007 Search PubMed.
- T. Vopel and G. Makhatadze, PLoS One, 2012, 7, e39418 CAS.
- C. T. Grubmeyer, S. Insinga, M. Bhatia and N. Moazami, Biochemistry, 1989, 28, 8174–8180 CrossRef CAS PubMed.
- M.-R. Abdo, P. Joseph, R.-A. Boigegrain, J.-P. Liautard, J.-L. Montero, S. Kohler and J.-Y. Winum, Bioorg. Med. Chem., 2007, 15, 4427–4433 CrossRef CAS PubMed.
- A. Schon, S. Y. Lam and E. Freire, Future Med. Chem., 2011, 3, 1129–1137 CrossRef PubMed.
- X. Robert and P. Gouet, Nucleic Acids Res., 2014, 42(W1), W320–W324 CrossRef CAS PubMed.
- The PyMOL molecular graphics system, version 1.3 r1, L. L. C. SCHRODINGER, 2010 Search PubMed.
Footnote |
| † Electronic supplementary information (ESI) available. See DOI: 10.1039/c6ra03020c |
|
| This journal is © The Royal Society of Chemistry 2016 |
Click here to see how this site uses Cookies. View our privacy policy here. 
 abd,
Luiz Augusto Bassoabc,
Diógenes Santiago Santos*abc and
Pablo Machado*ab
abd,
Luiz Augusto Bassoabc,
Diógenes Santiago Santos*abc and
Pablo Machado*ab