
Enhanced LPG sensing-performance at room temperature of poly(o-anisidine)–CeO2 nanocomposites†
Sharada Thakur and
Pradip Patil*
Department of Physics, North Maharashtra University, Jalgaon 425 001, India. E-mail: pnmu@yahoo.co.in; Tel: +91 2572257474
First published on 20th April 2016
Abstract
We report a fast-responding and selective room temperature liquefied petroleum gas (LPG) sensor based on poly(o-anisidine)–cerium oxide (POA–CeO2) nanocomposites. The POA–CeO2 nanocomposites were prepared by an in situ chemical oxidative polymerization of o-anisidine in the presence of pre-prepared CeO2 nanoparticles (size ∼5–10 nm). The pre-prepared CeO2 nanoparticles were synthesized by a simple and rapid microwave-assisted method. The POA, CeO2 nanoparticles and their nanocomposites were characterized by X-ray diffraction (XRD), Fourier transform infrared (FTIR) spectroscopy and transmission electron microscopy (TEM). The results of the characterization revealed that interaction occurred between the POA and CeO2 nanoparticles, leading to the formation of POA–CeO2 nanocomposites. The LPG sensing-performance of the nanocomposites was investigated and compared with that of sensors based on POA. The sensor based on a POA–CeO2 nanocomposite with known weight percentage of CeO2 showed better LPG sensing properties than that of pure POA. Upon exposure to 3.4% LPG, the nanocomposite with 30 wt% CeO2 exhibited an enhanced response (∼2.06%), very fast response (∼3–4 s), full recovery within 20 s in air and, most notably, better selectivity at room temperature. Furthermore, the lower detection limit was ∼0.09% which is lower than the permissible explosive limit for LPG. The reproducibility and stability study reveals that these nanocomposites are highly stable. Thus, the combination of the CeO2 nanoparticles and POA offers an attractive selective sensing-performance for LPG at room temperature with fast response/recovery rate.
1. Introduction
Liquefied Petroleum Gas (LPG) is highly inflammable and colourless. It is widely used as fuel in domestic and industrial fields and popularly known as cooking gas.1–4 The main constituents of LPG are butane (70% to 80%), propane (5% to 10%) and propylene, butylene, ethylene and methane (1% to 5%).5 It is generally mixed with compounds of sulphur (methyl mercaptan and ethyl mercaptan) to give a foul smell, so that its leakage can be noticed easily.6 The permissible exposure limit (PEL) for LPG as specified by the National Institute for Occupational Safety and Health (NIOSH) and Occupational Safety and Health Administration (OSHA) standards is 1000 ppm (0.1%).7 It is potentially hazardous due to the high possibility of accidental explosions caused by leakage or by human error. Hence, it is crucial to detect LPG in its early stages to raise the alarm and perform effective suppression. This has stimulated considerable interest for scientific research to develop reliable, efficient, simple and cost-effective chemical sensors to monitor LPG selectively with good sensitivity. Metal oxides5,8–13 and conducting polymers have been used as sensing elements for various LPG sensing applications.14 However, metal oxide-based sensors work efficiently at high operating temperatures, typically in the range of 200–500 °C, which increases power consumption, reduces sensor life and limits the portability.15,16 This disadvantage impedes their practical usage in many real time applications. Over the last decade, considerable research has been devoted towards the synthesis of novel sensing materials having enhanced performance at room temperature.Conducting polymers are another important class of low-cost sensing material demonstrated to have rapid response and room temperature operation, which is a major advantage for gas detection, especially for LPG.17–21 Among various conducting polymers, polyaniline (PANI) has been recognized as an interesting candidate in sensor applications due to its easy synthesis, unique electrical properties, relatively good environmental stability, sensitivity to some volatile organic compounds and ability to be attached onto flexible film.17,18,22 However, it still exhibits certain limitations such as a low gas response, irreversibility, long recovery time and lack of specificity. Although gas-sensing performances of different conducting polymers for H2,23 CO,24 NH3,25 H2S,26 NO2 (ref. 27) etc. have been studied, hardly any attempt has been made to investigate their LPG sensing properties. More recently, Birajadar et al.14 studied the room temperature LPG sensing behavior of PANI thin films synthesized by a cost-effective oxidative polymerization technique. The PANI thin film showed the highest response of 22 at 300 ppm with response and recovery times of 42 and 80 s, respectively. However, the other aspects of the LPG sensing such as sensing selectivity, reproducibility and stability have not been studied by those authors.
Among several different strategies for fabricating selective and room temperature operative gas sensors, the combination of nanostructured metal oxides with conducting polymers has been particularly interesting.28,29 Combination of conducting polymers and nanostructured metal oxides results in the generation of new gas-sensing materials having drastically improved gas-sensing performance for various gases compared with their individual components.30–33 Such nanocomposites have shown excellent sensing performance under ambient conditions and therefore can be used for the fabrication of low-cost room temperature gas sensors. In recent years, conducting polymer–metal oxide nanocomposites such as POA–SnO2,34 polythiophene–SnO2,35 polypyrrole–zinc oxide,36 poly(o-chloroaniline)–ZnO37 and polyaniline–ZnO7 have been synthesized and their LPG sensing properties have also been investigated by a few research groups.
Cerium oxide (CeO2) is a technologically important n-type semiconductor and has been used to detect CO,38 acetone and NO39 in an oxygen environment at operating temperatures in the range of 300–400 °C. However, hardly any attempt has been made to investigate the LPG sensing properties of CeO2 nanoparticles. Before this study, there are only a few reports dealing with the synthesis of PANI–CeO2 composites for NH3 (ref. 40) and LPG41 sensing. Wang et al.40 recently reported the synthesis of core–shell CeO2 nanoparticles@cross-linked PANI nanohybrids and investigated their NH3 sensing properties. When the ratio of CeO2 to aniline was 4, the nanohybrid showed an enhanced response of ∼6.5 to 50 ppm of NH3 at room temperature with a shorter detection time of ∼57.6 s than pure PANI (response of 2.6 and 290 s of response time). Khened et al.41 reported the synthesis and LPG sensing behavior of PANI–CeO2 composites at room temperature. The composite with 20 wt% of CeO2 showed a maximum sensitivity to LPG at room temperature. However, the LPG sensing properties of the pure PANI have not been investigated and compared with those of the composites. Also, the other aspects of the gas-sensing such as response and recovery time, reproducibility and stability have not been studied by those authors.
The present study reports an LPG sensor featuring a POA–CeO2 nanocomposite as the sensitive layer. To the best of our knowledge, the LPG sensing characteristics of a POA–CeO2 nanocomposite at room temperature have not been investigated as yet. In this study, the POA–CeO2 nanocomposite was synthesized using an in situ chemical oxidative polymerization method and its LPG sensing performance was investigated at room temperature. The POA was chosen as an organic counterpart for this study to explore the possibility of utilizing it as an alternative to PANI for gas-sensing applications. The fabricated POA–CeO2 (30 wt%) nanocomposite sensor shows enhanced LPG response at room temperature, excellent reproducibility, rapid response, fast recovery, good sensing selectivity, stability and lower detection limit (∼0.09% LPG < PEL). A sensing mechanism is also discussed based on experimental findings.
2. Experimental
2.1 Materials
The purity of all chemicals was analytical grade and they were used as-received, without any further purification except o-anisidine. Ammonium persulphate ((NH4)2S2O8), hydrochloric acid (HCl), ammonium cerium(IV) nitrate ((NH4)2Ce(NO3)6), propylene glycol (C3H8O2), liquid ammonia (30%) and o-anisidine were procured from Qualigens Fine Chemicals, India. o-Anisidine was doubly distilled prior to its use in the synthesis.2.2 Preparation of CeO2 nanoparticles
CeO2 nanoparticles were prepared using a microwave-assisted route following the earlier work reported by our group.42 Briefly, 0.1 M each of ammonium cerium(IV) nitrate and propylene glycol were dissolved in double-distilled water and stirred continuously for 1 h at room temperature (27 °C). Ammonia was added drop-wise to this solution with continuous stirring until the final pH value of approximately 10 was achieved in the solution. The resulting pale-yellow-colored precipitate was filtered, washed several times with double-distilled water and alcohol, and subjected to microwave irradiation at 600 W microwave power for 10 minutes. Microwave irradiation was performed with a domestic microwave oven (CQ138S, Samsung, Japan) operated at a microwave frequency of 2.45 GHz with a maximum power of 800 W. After irradiation, the yellow-colored precipitate was harvested by centrifugation, washed several times using double-distilled water and ethanol, and then dried in an oven at 90 °C overnight to obtain the end-product for further characterization.2.3 Preparation of POA–CeO2 nanocomposites
The POA–CeO2 nanocomposites were prepared through chemical polymerization of o-anisidine at 0–5 °C in air in the presence of pre-prepared CeO2 nanoparticles. In a typical synthesis, CeO2 nanoparticles were dispersed into 1 M HCl solution under ultrasonication for 2 h. After 2 h of ultrasonication, o-anisidine was introduced into the above solution under continuous stirring. Then, ammonium persulphate (0.1 M) was slowly added drop-wise to the well-dispersed reaction mixture for 2 h with continuous stirring at 0–5 °C for another 24 h. The dark green-colored precipitate produced in the reaction was harvested by filtration and washed repeatedly with methanol and double-distilled water. Finally, the filtered POA–CeO2 nanocomposite was dried at 80 °C under vacuum for 24 h. Different POA–CeO2 nanocomposites were prepared using 10, 20, 30, 40 and 50 wt% of CeO2 nanoparticles with respect to o-anisidine, which are referred to as POA–CeO2-10, POA–CeO2-20, POA–CeO2-30, POA–CeO2-40 and POA–CeO2-50, respectively. For comparison, pure POA was also synthesized following the same procedure (without the use of CeO2 nanoparticles), characterized and employed as a sensing material for LPG.2.4 Characterization
X-ray powder diffraction (XRD) analysis was performed on a Bruker diffractometer (D8, Advance, Bruker AXS model) with Cu Kα monochromatic radiation (λ = 1.5406 Å) at 40 kV and 40 mA in the range of 5–80° (2θ). The surface morphology and microstructure of the products were observed using a transmission electron microscope (TEM, Tecnai G2 U20, FEI, USA) operating at an accelerating voltage of 200 kV. FTIR spectra of the samples were measured using the KBr pellet method on a Shimadzu FTIR spectrophotometer (FTIR-4800, Shimadzu, Japan) in the spectral range 4000–400 cm−1.2.5 LPG sensing measurements
In this work, pellets (diameter ∼1 cm and thickness ∼0.1 cm) of the POA and POA–CeO2 nanocomposite powders (0.2 g) were formed using a hydraulic press machine (Techno Search Instruments, Mumbai, India) under a uniaxial pressure of 15 MPa at room temperature. The pellets were dried in an oven at 90 °C for 3 h and the electrical contact leads were fixed 0.7 cm apart with the help of silver paste on the surface of the pellet to form the sensing element. The LPG sensing experiments were carried out in a static gas chamber in ambient air. The sensing element was kept directly on a heater in the chamber and the temperature was varied from room temperature to 100 °C. The temperature of the sensing element was monitored by chromel-alumel thermocouple placed in contact with the sensor. The known volume of the LPG was introduced into the gas chamber pre-filled with air and it was maintained at atmospheric pressure. The LPG was detected by monitoring and recording the change of electric current passing through the sensing element using an electrochemical measurement system (1287, Solartron, U.K.) controlled by CorrWare software from Scribner Associates Inc. supplied by Solartron, U.K. A constant dc voltage of 1 V was applied to the electrodes. The resistance of the sensing element as a function of time was calculated from this data using the software. The performance of the sensing element is presented in terms of the response (S), which is defined by the following relation:
 | (1) |
3. Results and discussion
3.1 Structural and morphological characteristics
The XRD patterns of the as-prepared CeO2 nanoparticles and the POA–CeO2-30 nanocomposite are shown in Fig. 1. The XRD pattern of the as-prepared CeO2 nanoparticles [Fig. 1(a)] is in good agreement with that of the pure CeO2 crystalline phase (JCPDS no. 81-0792). All of the diffraction peaks can be indexed to CeO2 with a face-centered cubic structure. No other peaks were observed, indicating that no impurities were present and confirming that the adopted synthesis method gives pure CeO2 nanoparticles. The average crystallite size was estimated by fitting the [1 1 1] diffraction peak (2θ = 27.76°) width using a Gaussian function and using the values of the angular position of the peak (θ) and peak full line width at half maximum (B) in the Debye–Scherrer equation
 | (2) |
 | ||
| Fig. 1 XRD patterns of (a) CeO2 nanoparticles and (b) POA–CeO2-30 nanocomposite. Inset depicts the XRD pattern of POA. | ||
As expected, the XRD pattern of the POA–CeO2-30 nanocomposite [Fig. 1(b)] exhibits the characteristic diffraction peaks not only for the POA but also for the CeO2 nanoparticles, which confirms the co-existence of CeO2 nanoparticles with POA. It can be noted that the intensities of the diffraction peaks of POA are considerably reduced, suggesting that the CeO2 nanoparticles hamper the crystallization of POA chains. Furthermore, the comparison of the XRD pattern of the nanocomposite with that of CeO2 nanoparticles suggests that the crystal structure of CeO2 was not affected by POA. Also, the intensities of the diffraction peaks for the nanocomposite are weaker than those for the pure CeO2 nanoparticles, which is attributed to the deposition of POA on the surface of the nanoparticles.
The FTIR spectrum of CeO2 nanoparticles (Fig. S1, ESI†) is similar to that reported in our earlier work.42 The main characteristic bands in the spectrum are assigned as follows; the bands at 538 and 851 cm−1 correspond to Ce–O stretching vibrations,43 the bands at 1061 and 1385 cm−1 are associated with the characteristic vibrations of CeO2 (ref. 44) and a broad band at ∼3320 cm−1 is assigned to the Ce–OH stretching vibration. Fig. 2(a) and (b) show the FTIR spectra of POA and POA–CeO2-30 nanocomposite. The FTIR spectrum of pure POA [Fig. 2(a)] is also consistent with the earlier work reported by our group45,46 having strong bands at around 1568 and 1490 cm−1 corresponding to quinoid (Q) rings (C![[double bond, length as m-dash]](https://www.rsc.org/images/entities/char_e001.gif) N stretching mode) and the benzoid (B) rings (CC stretching mode), respectively, and the remaining bands are assigned as follows: a broad and weak band at ∼3436 cm−1 is due to the characteristic N–H stretching vibration, the bands at ∼1254 and 1014 cm−1 are assigned to the presence of an o-methoxy group in the POA, a band at ∼1207 cm−1 is a measure of the degree of delocalization of electrons on POA, a band at ∼1123 cm−1 is attributed to a plane bending vibration of C–H and a band at ∼805 cm−1 indicates the presence of an ortho-substituted benzene ring.
N stretching mode) and the benzoid (B) rings (CC stretching mode), respectively, and the remaining bands are assigned as follows: a broad and weak band at ∼3436 cm−1 is due to the characteristic N–H stretching vibration, the bands at ∼1254 and 1014 cm−1 are assigned to the presence of an o-methoxy group in the POA, a band at ∼1207 cm−1 is a measure of the degree of delocalization of electrons on POA, a band at ∼1123 cm−1 is attributed to a plane bending vibration of C–H and a band at ∼805 cm−1 indicates the presence of an ortho-substituted benzene ring.
 | ||
| Fig. 2 FTIR spectra of (a) POA and (b) POA–CeO2-30 nanocomposite. | ||
As expected, the FTIR spectrum of the POA–CeO2-30 nanocomposite [Fig. 2(b)] shows the presence of characteristic bands attributable to both POA (1584, 1502, 1284, 1209, 1126, 1022, 596 and 457 cm−1)45,46 and CeO2 nanoparticles (950 and 839 cm−1).42–44 However, the incorporation of CeO2 nanoparticles leads to the shift of FTIR bands of POA to higher wavenumbers, which suggests that there is strong interaction between the POA and CeO2 nanoparticles. Moreover, the ratio of intensities of quinoid and the benzoid bands  calculated by integrating the corresponding band area were found to be ∼0.39 and 0.78 for POA and POA–CeO2-30 nanocomposite, respectively. The higher value of
  for the nanocomposite indicates the increase in the degree of oxidation in POA due to the incorporation of CeO2 nanoparticles.47 More careful examination reveals that the intensity of the FTIR spectrum is observed to be significantly lower than that for POA. This may possibly be due to the fact that the CeO2 nanoparticles present in the reaction mixture act as template areas for the growth of POA. The o-anisidine monomer gets adsorbed on the CeO2 nanoparticles and polymerization proceeds on the surface of oxide particles when the oxidant (ammonium persulphate) is added to the reaction mixture. The polymerization of o-anisidine is an auto-accelerated process. That is, the conducting polymer formation is preferred in the region where some polymer has already been produced. Thus, adsorption of polymer onto the CeO2 nanoparticles results in constrained chain growth around the nanoparticles and restricts the amplitudes of modes of vibration in POA, which in turn leads to the decrease in the intensities of bands in the FTIR spectrum.48,49 Thus, the FTIR spectroscopy result confirms that the nanocomposite has been formed during chemical polymerization of o-anisidine in the presence of CeO2 nanoparticles.
The TEM image of the CeO2 nanoparticles [Fig. 3(a)] indicates the presence of CeO2 nanoparticles with clear boundaries and crystalline with an average size of ∼10–12 nm. The corresponding selected area electron diffraction (SAED) pattern (Fig. 3(b)) further confirms the random orientations of the CeO2 nanoparticles and there is no secondary phase. The TEM image of the POA–CeO2-30 hybrid shown in Fig. 3(c) indicates the presence of dark colored CeO2 nanoparticles are enwrapped and interconnected with POA in the nanocomposite. It is observed that the CeO2 nanoparticles are homogeneously distributed in the hybrid. The SAED pattern of POA–CeO2-30 hybrid [Fig. 3(d)] shows the diffraction rings composed of spots corresponding to the different planes of a face-centred cubic CeO2, which is in agreement with the XRD result.
 | ||
| Fig. 3 TEM images of (a) CeO2 nanoparticles and (b) POA–CeO2-30 nanocomposite; (c) and (d) present the corresponding SAED patterns of CeO2 nanoparticles and POA–CeO2-30 nanocomposite, respectively. | ||
3.2 LPG sensing characteristics
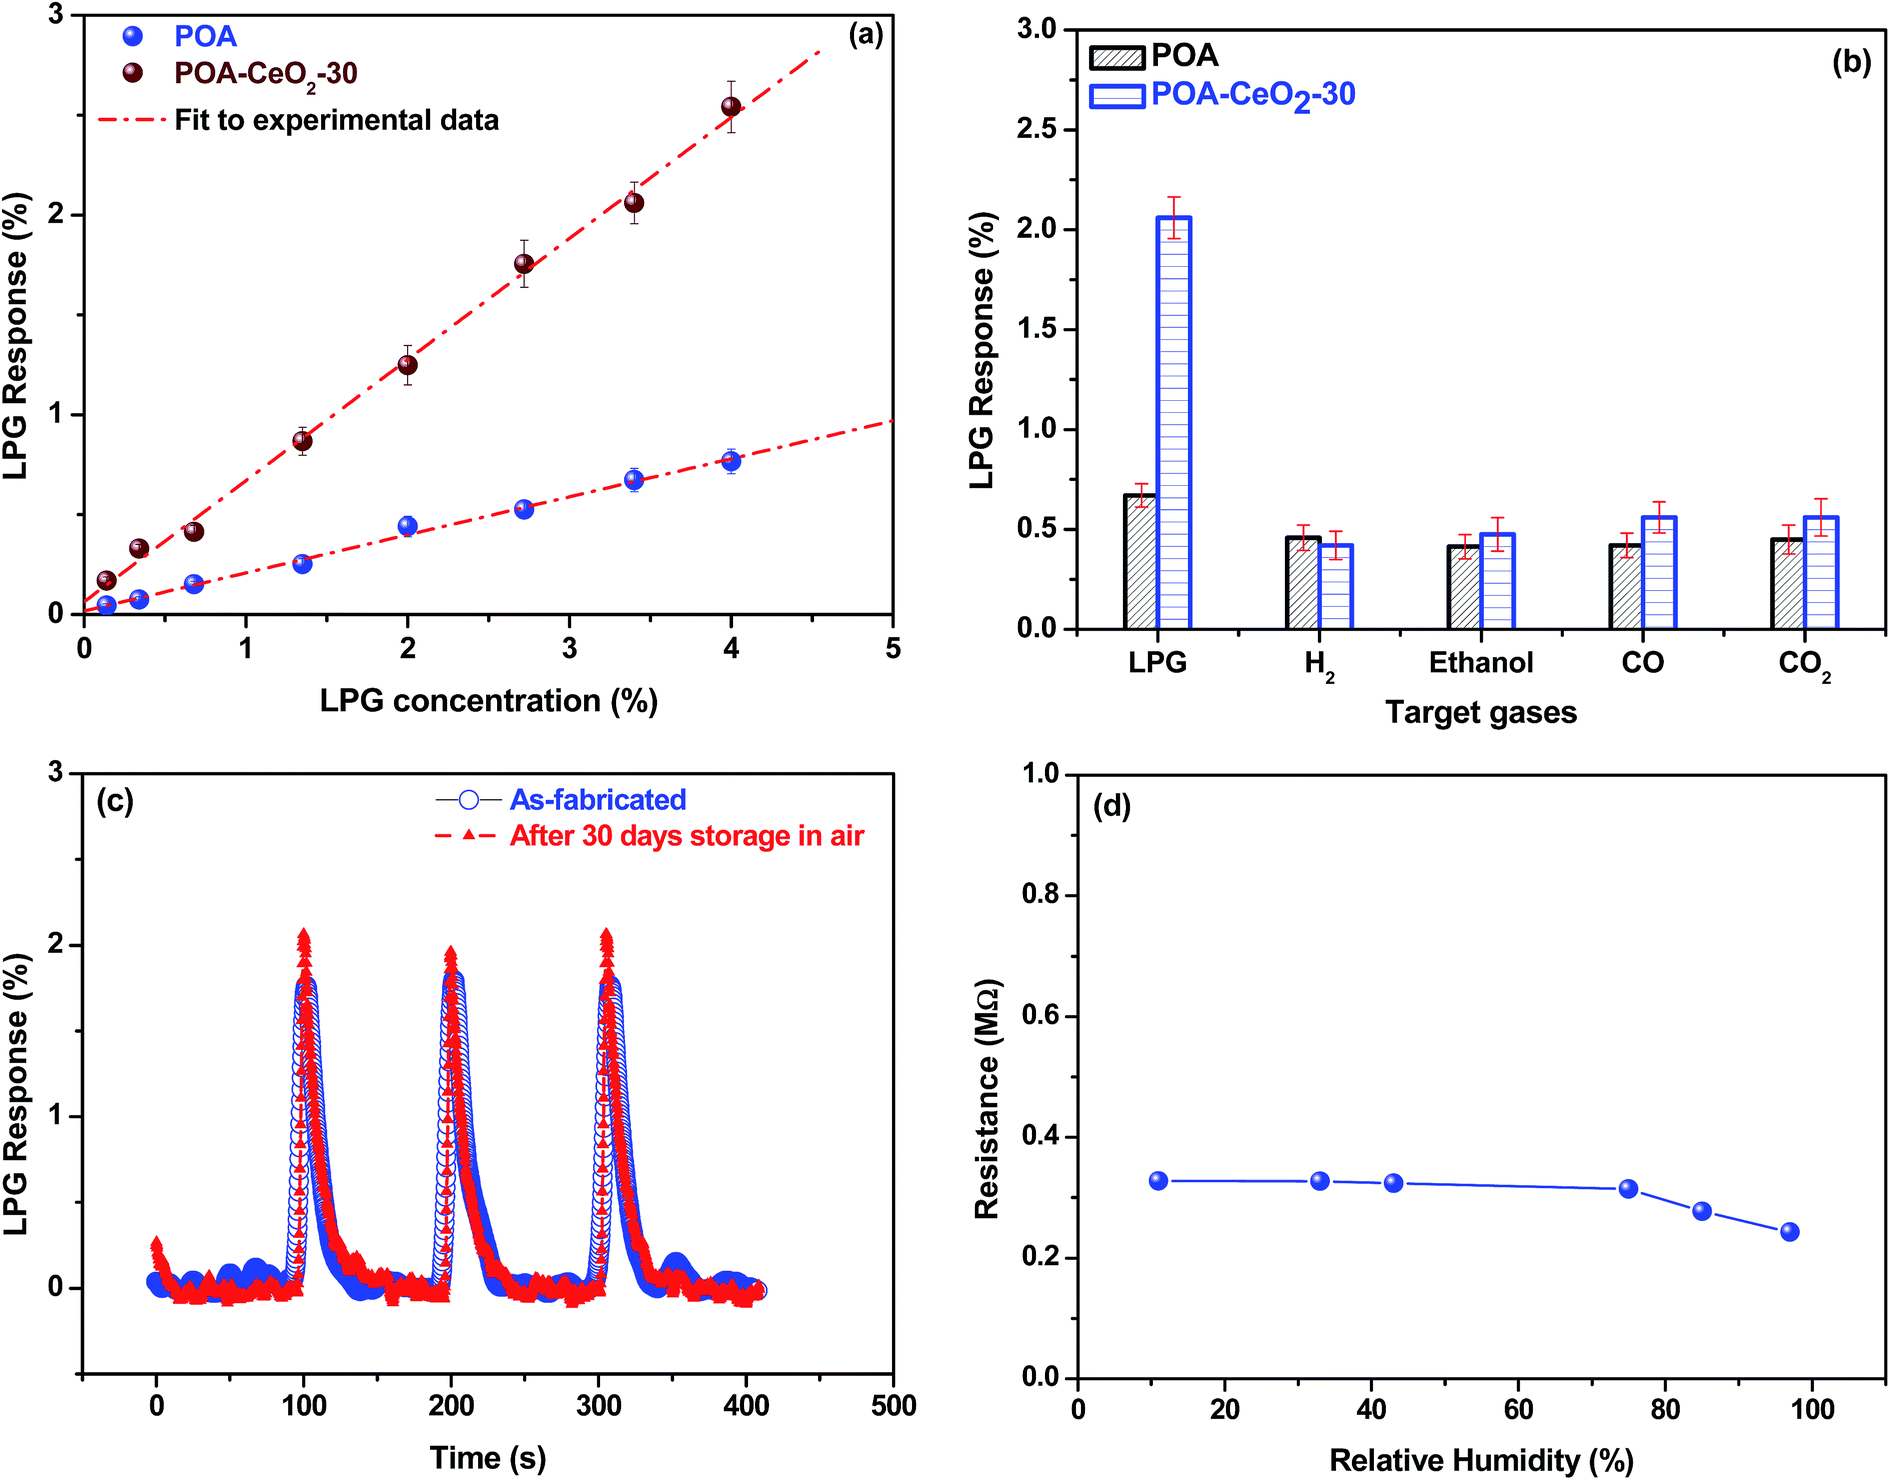
In order to demonstrate that the formation of a composite of POA with CeO2 nanoparticles is an effective approach to enhance the gas-sensing properties of POA-based gas sensors, the sensors based on CeO2 nanoparticles, POA and POA–CeO2 nanocomposites were investigated for LPG detection at room temperature. The CeO2 nanoparticles do not show sensor activity, while POA exhibits a response of ∼0.83% to 3.4% LPG at room temperature, thus, the components of the nanocomposite individually exhibit either poor response or no response to LPG. However, their nanocomposite shows sensor activity to 3.4% LPG at room temperature and it exhibits the properties of a p-type semiconductor, that is its resistance increases on exposure to reducing gas (e.g. LPG). This observation suggests that the LPG sensing mechanism of the POA–CeO2 nanocomposite is governed by its POA counterpart, which is supported by the TEM study.The response of the nanocomposite with 30 wt% CeO2 towards 3.4% LPG at room temperature is about 2.5 times that of POA. The enhancement in the sensor functionality of the nanocomposite sensor may be attributed to the mutual interaction between POA and CeO2 nanoparticles.34,50,51 The two components of the nanocomposite, namely POA and CeO2, are p-type and n-type semiconductors, respectively. The mutual interaction between them creates charge separation and generates the p–n heterojunctions in the nanocomposite. The Ra value of the POA–CeO2-30 nanocomposite (∼333 kΩ) is ∼16 times higher than that of the POA sensor (∼21 kΩ). Thus, the significant increase of Ra is attributed to the extension of the electron depletion layer by the formation of p–n heterojunctions between the POA and CeO2 nanoparticles.
The responses of the sensors based on POA–CeO2 nanocomposites to 3.4% LPG at room temperature were further examined to determine the optimal content of CeO2 nanoparticles in the nanocomposites. Fig. 4(a) shows the dependence of the LPG response on the CeO2 content in the nanocomposite and the highest response is achieved for 30 wt% of CeO2. The y-error bars represent the standard deviation at a fixed CeO2 content and they are in the range of 0.06–0.10, indicating the low experimental variability. On the basis of this result, the nanocomposites for the sensing experiments in this study were synthesized with 30 wt% of CeO2. It is well known that the gas response is greatly influenced by the operating temperature. Therefore, both the sensors were also investigated for LPG detection at different operating temperatures in the range between 25 °C (room temperature) and 100 °C. The results (Fig. S2(a), ESI†) reveal that the POA–CeO2-30 nanocomposite sensor exhibits maximum LPG response ∼76% at 100 °C and the value is about 6.21 times higher than that of POA.
 | ||
| Fig. 4 (a) Bar chart showing the gas response of POA–CeO2 nanocomposites with 0, 10, 20, 30, 40 and 50 wt% of CeO2 nanoparticles to 3.4% LPG at room temperature; (b) bar chart showing the dependence of dielectric constant of the POA–CeO2 nanocomposites on the content of CeO2; (c) dynamic response–recovery characteristics of pure POA and POA–CeO2-30 nanocomposite based sensors upon exposure to 3.4% LPG at room temperature and (d) repetitive responses of pure POA and POA–CeO2-30 nanocomposite to 3.4% LPG at room temperature (25 °C). Error bar indicates the standard deviation in the measurement. | ||
It is well-known that the charge transfer process is accompanied with the proportionate change in the dielectric property of the material. Consequently, the dielectric constant of the nanocomposite can be considered to be a measure of the formation of p–n heterojunctions. In order to substantiate the formation of p–n heterojunctions, the values of dielectric constant of the POA–CeO2 nanocomposites were estimated at room temperature using the following relation50,52
 | (3) |
 | (4) |
It is seen that the dielectric constant values of the nanocomposites increase with increase of the CeO2 content up to 30 wt% and decrease with further increase in the CeO2 content. Besides this, there is good correlation between the dielectric constant values and LPG response. It is interesting to observe that the POA–CeO2-30 nanocomposite exhibiting the maximum LPG response at room temperature has the maximum dielectric constant value. Thus, the LPG response of the sensors based on nanocomposites is supported and facilitated by the formation of p–n heterojunctions.
In addition to the gas response, the response and recovery properties are also important for evaluating the performance of gas sensors. The time taken by a sensor to achieve 90% of its maximum response is defined as response time in the case of adsorption or the recovery time in the case of desorption. The dynamic response–recovery characteristics of the sensors based on POA and POA–CeO2-30 nanocomposite upon exposure to 3.4% LPG at room temperature are shown in Fig. 4(c). As can be seen from Fig. 4(c), the POA responded rapidly after introduction of LPG, however it does not recover, even after exposure to air for more than 5 minutes. The response time for the pure POA is about 3–4 s. On the other hand, the nanocomposite also responded very rapidly when exposed to the LPG and did not recover totally when it was exposed to air. The response and recovery times for the POA–CeO2-30 nanocomposite are about ∼3–4 s and ∼20 s, respectively, which implies that both the response and recovery are rapid, which makes the present sensor suitable for the real time detection of LPG at room temperature. These values are lower than for the sensors based on polyaniline–ZnO,7 POA–SnO2,34 polythiophene–SnO2,35 polypyrrole–ZnO,36 poly(o-chloroaniline)–ZnO,37 core shell CeO2 nanoparticle@cross-linked PANI nanohybrids40 reported earlier. It is observed that the base line resistances of both the sensors are not recovered fully simply by exposing them to air and therefore the dynamic response–recovery characteristics [cf. Fig. 4(c)] are termed as irreversible. For irreversible gas-sensing, the surface reaction can be explained by the Langmuir–Hinshelwood mechanism and the response transient S(t) can be expressed by eqn (5)54–56
| S(t) = Smax(1 − e−kCat) | (5) |
 | (6) |
The response transients of POA and POA–CeO2-30 for 3.4% LPG were fitted nonlinearly according to eqn (5) and the fitted curves are consistent with the experimental results in Fig. 4(c). The estimated values of the response times for both sensors are found to be ∼3–4 s. Interestingly, the POA sensor (Fig. S2(b), ESI†) recovers fully at 100 °C and its recovery time is found to be ∼40 s. The response and recovery times of the POA–CeO2-30 nanocomposite sensor at 100 °C are found to be ∼3–4 s and 17–18 s, respectively. The recovery of the nanocomposite sensor is faster than that of the POA sensor (40 s), which is attributed to a faster rate of desorption at 100 °C.
From an application point of view, the reproducibility is the most important gas-sensing characteristic. It is the ability of the sensor to sequentially respond to the target gas without a visible change in the response. To examine the reproducibility of both sensors, the same sensors were exposed to 3.4% LPG at room temperature for 3 cycles. As can be seen from Fig. 4(d), the POA responded rapidly to LPG but it failed to return to the initial value after removal of the gas. Thus, the POA shows poor reversibility to LPG at room temperature. The sensing behaviour of the POA–CeO2-30 based sensor is quite reproducible and stable. Furthermore, there is no clear change in the responses during the measurement of the three sensing cycles, exhibiting excellent stability and reproducibility of the sensor. The reproducible sensing behaviour indicates a weaker interaction between the LPG and sensing layer rather than any chemical reaction. Also, at 100 °C, the sensing behavior of both sensors is quite reproducible and the base line remains stable (Fig. S2(c), ESI†).
To further confirm the reliability for LPG detection, the performances of the sensors based on POA and POA–CeO2-30 toward different LPG concentrations (0.14% to 4%) were investigated at room temperature. The experimental relationships between the responses and LPG concentration at room temperature are depicted in Fig. 5(a). The y-error bars represent the standard deviation at a fixed concentration and they are in the range of 0.01–0.06 and 0.02–0.13 for POA and POA–CeO2-30, respectively, indicating the low experimental variability. It is seen that the responses of both sensors are highly dependent on the LPG concentration in the measurement range. Obviously, the nanocomposite sensor exhibits the higher response to LPG at different concentrations compared with that based on POA in the entire detecting range. As can be seen from Fig. 5(a), the responses of both sensors increase linearly with the increasing LPG concentration from 0.14% to 4%, however, the response rate of POA–CeO2-30 nanocomposite is higher. The linear relationship between the gas response and LPG concentration can be expressed as the following eqn (7) and (8) for POA and POA–CeO2-30 nanocomposite, respectively.
| y = 0.018 + 0.19x, R2 = 0.9919 | (7) |
| y = 0.065 + 0.61x, R2 = 0.9974 | (8) |
 | ||
| Fig. 5 (a) Relationship between response and LPG concentration of pure POA and POA–CeO2-30 nanocomposite based sensors. Dots represent the experimental data points, and the discontinuous lines represent a linear fit to the experimental data; (b) bar chart showing the gas responses of pure POA and POA–CeO2-30 nanocomposite for different gases at room temperature. The gas concentration in all cases was 3.4%; (c) stability of the POA–CeO2-30 nanocomposite sensor and (d) response of the POA–CeO2-30 nanocomposite sensor towards relative humidity. Error bars indicates the standard deviation in the measurement. | ||
Detection limit is another important factor used for the evaluation of the sensing-performance of the sensors. It is defined as the lowest concentration of the analyte at which the response of the sensor under the given conditions is differentiated from the background level.50,52,57 When this criterion is applied in the present work, the LPG response was set to S > 0.088. According to eqn (7) and (8), the detection limits are estimated to be approximately 0.13% and 0.09% for the sensors based on pure POA and POA–CeO2-30 nanocomposite, respectively. Thus, the detection limit for POA–CeO2-30 nanocomposite (∼0.09%) is lower than the PEL for LPG. The similar variation of the response with the LPG concentration can also be obtained at the operating temperature of 100 °C (Fig. S2(d), ESI†), implying the excellent sensing performance at higher temperature. This result demonstrates that the formation of a composite of POA with CeO2 nanoparticles lowers the detection limit of POA and is capable of detecting a concentration of LPG lower than PEL limit.
Selectivity in gas-sensing is another important parameter of the sensor, which relies mainly on the specific interactions between the sensing layer and the target gas molecules. It is defined as the ability of a sensor to respond to a target gas in the presence of other interfering gases. The LPG sensing selectivity of POA and POA–CeO2-30 based sensors was examined towards various gases such as hydrogen (H2), carbon monoxide (CO), carbon dioxide (CO2) and ethanol (C2H5OH) at 3.4% and room temperature. The responses to each gas were calculated by eqn (1). Fig. 5(b) depicts the histogram of the responses of two sensors based on POA and POA–CeO2-30 nanocomposite toward 3.4% of LPG, H2, CO, CO2 and ethanol at room temperature. The y-error bars represent the standard deviation at a fixed target gas and they are in the range of 0.06–0.07 and 0.07–0.10 for POA and POA–CeO2-30, respectively, indicating the low experimental variability. The POA based sensor shows almost nearly equal response values to all the test gases. Besides, by contrast, the sensor based on the POA–CeO2-30 shows enhanced responses to all the test gases compared with its pure POA counterpart. However, it exhibits a high response of 2.06% to 3.4% of LPG compared to other test gases, indicating that the POA–CeO2-30 nanocomposite has a better ability to discriminate LPG. In order to quantify the selectivity to LPG, the selectivity coefficient (K) was calculated further according to definition34,58
 | (9) |
The POA–CeO2-30 sensor was also tested for its stability in ambient conditions. To investigate its stability, the sensor was kept in atmospheric conditions for 30 days and its sensing-performance towards 3.4% LPG at room temperature was measured under the identical experimental conditions. Fig. 5(c) shows the comparison of the sensing-performance towards 3.4% LPG at room temperature before and after 30 days of storage in air. As seen from Fig. 5(c), the sensor still responded well towards 3.4% LPG with slight degradation after 30 days and the standard deviation in the LPG response values was observed to be ∼0.18, which directly confirms the excellent stability of the sensor. However, when the sensors were stored in air for a relatively long time, their performances decrease dramatically, which can be attributed to the dedoping (undoping) of conducting polymers. Generally, conducting polymers are used mainly in resistive-type sensors and, therefore, the change in film conductivity causes both the drift of sensor baseline and the change of sensor response. It is well-known that the stability of conductivity in air strongly depends on the dopants.59,60 Therefore, a possible mechanism to increase the stability of the conducting polymer (and their composites) based sensors is to dope the conducting polymers with big anions such as H2SO4, p-toluene sulfonic acid (p-TSA) and camphorsulfonic acid (CSA). Another approach to improve the stability of the conducting polymer based sensors is the stabilization of the polymers, which can be achieved by the formation of composites of two conducting polymers and copolymers by oxidative chemical polymerization. As mentioned earlier, Wang et al. synthesized core–shell CeO2 nanoparticles@cross-linked PANI nanohybrids by a facile in situ polymerization method using phytic acid, which worked as gelator and dopant simultaneously. The gelator phytic acid, due to its nonvolatile nature, worked as a cross-linker to weaken the impact of the environment by increasing the mechanical strength and chemical stability of the sensor, which combined excellent sensitivity with superior long-term stability.
Furthermore, no significant variation in the response and recovery abilities was observed. It was also demonstrated that humidity has a great effect on the performance of conducting polymer60 and CeO2 (ref. 42) based sensors. Therefore, the study of the influence of humidity on the fabricated sensor based on POA–CeO2 nanocomposite is important for its real-time practical applications. In order to investigate the influence of humidity on the POA–CeO2-30 nanocomposite sensor, the experiments were also performed to measure the resistance of the pellet as a function of relative humidity by using a simple two probe configuration with an electrometer (6517B Electrometer, Keithley) controlled by the test software supplied by Biotronic systems, Mumbai, India. In these experiments, the different relative humidity (RH) levels 11 ± 0.30, 33 ± 0.14, 43 ± 0.20, 75 ± 0.15, 85 ± 60.24, and 97 ± 0.16% RH were generated in a simple gas-sensing setup fabricated in our laboratory. The variation of the resistance of the POA–CeO2-30 nanocomposite with the relative humidity is shown in Fig. 5(d). The y-error bars represent the standard deviation at a fixed RH and they are in the range of 0.018–0.020, indicating the low experimental variability. It is seen that the resistance of the nanocomposite did not show a significant variation when the humidity was increased from 11% to 97% RH. This may be attributed to the incorporation of CeO2 nanoparticles in the POA matrix, thereby reducing the bare POA sites for the adsorption of water molecules.61 Thus, the results further confirmed that the present sensor can have a practical application on the basis of its excellent LPG sensing selectivity and good stability.
It is well known that the gas-sensing response is the reflection of the kinetics of the gas adsorption and desorption processes occurring on the surface of the sensor.62,63 As a result, the response and recovery times depend on the rate of adsorption and desorption respectively. The gas adsorption and desorption processes can be studied by transforming the dynamic response–recovery characteristics as shown in Fig. 4(c) using a derivative method proposed by Zhang et al.64 In this method, the first time derivative of the response  can be used to represent the adsorption–desorption kinetics during the sensing process and it is plotted as a function of the response (S). Physically, S reflects the concentration of adsorbed gaseous species, while
  represents the rate of change of concentration of gaseous species on the sensor surface under certain measuring conditions. A typical gas adsorption–desorption curve is depicted in Fig. 6(a), where the upper and lower parts of the curve represent the adsorption and desorption cycles, respectively occurring during the gas-sensing process. Part A of the adsorption cycle represents adsorption and diffusion of gaseous species on the sensor surface during the initial sensing stage and its slope gives the speed of adsorption. As the gas-sensing process persists, the adsorption of gaseous species slows down gradually and adsorption cycle becomes relatively horizontal following the linearly upward portion of part A. Subsequently, the adsorption and desorption processes reach to a equilibrium and the
  attains a maximum value (h1) at a certain value of gas response S1. Once the equilibrium is reached, the desorption of the products produced in the gas-sensing process starts playing a dominating role and the gas response increases to the maximum value S0, which represents part B of the adsorption cycle. The length of part B of the adsorption process is S2 and the sum S1 + S2 = S0 represents the length of the adsorption process. After the removal of the gas, the desorption of the gas dominates the gas-sensing process and the
  attains a minimum value (h2) at a certain value of gas response S1 and the response of the gas sensor returns to the baseline within the length S2, leading to the recovery of the sensor. The sum S′1 + S′2 is the length of the desorption process. Thus, the important physical parameters to be extracted from the adsorption–desorption curve [Fig. 6(a)] are maximum gas response or length of adsorption process (S0), the height of adsorption cycle (h2), the location of h1(S1), the height of desorption cycle (h2) and the location of (h2)(S′1). Using the transformation method as described above, the dynamic response–recovery characteristics of the sensor based on POA in Fig. 4(c) were transformed to the curve having parameters S0 = 0.81, h1 = 0.34, S1 = 0.41, h2 = 0.18 and S′1 = 0.21, which is shown in Fig. 6(b). When the sensor based on POA is exposed to LPG at room temperature, the LPG molecules get adsorbed and diffuse rapidly, as indicated by the sharp rise of the adsorption curve. This is attributed to the porous structure of pure POA, which permits large penetration of LPG molecules into the entire volume of the sensing layer. As the gas-sensing process goes on, the adsorption of the LPG gas slows down gradually, thereby exhibiting a horizontal portion. When the gas adsorption and desorption reach equilibrium, the LPG response increases to the maximum value, S0 = 0.81. Thus, the length of the adsorption process is ∼0.81. After the removal of the LPG, the desorption of gas molecules dominates the gas-sensing process, resulting in the decrease of the response which leads to the recovery of the sensor. In the initial stage, the rate of desorption is fairly high, however, it is lower than that of adsorption as seen by a smaller
  value. Moreover, the desorption cycle remains incomplete as indicated by negative
  values, suggesting that desorption by diffusion of product gases not only takes a longer time, but also remains incomplete. This may be due to the fact that, LPG molecules being heavier in nature, the reaction products are not leaving immediately from POA. This illustrates why the POA based sensor does not recover even after exposure to air for more than 5 minutes. Due to a faster rate of desorption at 100 °C, the desorption cycle (Fig. S4(a), ESI†) gets completed, thereby indicating that the reaction products diffused out easily and the POA based sensor recovers fully with recovery time of 40 s.
 | ||
| Fig. 6 (a) A typical gas adsorption–desorption curve of the gas sensor; gas adsorption–desorption curves of the sensors based on (b) pure POA and (c) POA–CeO2-30 nanocomposite toward 3.4% LPG at room temperature. | ||
The dynamic response–recovery characteristics of the sensor based on POA–CeO2-30 nanocomposite in Fig. 4(c) were also transformed to the curve having parameters S0 = 2.04, h1 = 0.78, S1 = 0.95, h2 = 0.22 and S′1 = 0.21, which is shown in Fig. 6(c). When the sensor based on POA–CeO2-30 is exposed to LPG at room temperature, the porosity of POA provides a path for LPG molecules to reach the active sites of CeO2 nanoparticles on the backbone of POA, which is indicated by the initial steep rise of the adsorption curve. As compared with the kinetic process of gas adsorption–desorption of POA, the POA–CeO2-30 nanocomposite exhibits an inflected gas adsorption–desorption curve having parameters with higher values. The observed inflection in the gas adsorption–desorption curve is attributed to the existence of p–n heterojunctions in the nanocomposite coupled with an increase in the surface for the interaction with LPG molecules. In contrast to POA, the desorption cycle is completed after the removal of the LPG. Moreover, the rate of desorption is lower than that of adsorption, indicating that the desorption and diffusion of product gases take a longer time than the adsorption and diffusion of LPG gas. This illustrates why the recovery time of the POA–CeO2-30 based sensor is longer than the response time. At 100 °C, the POA–CeO2-30 nanocomposite sensor reveals inflected gas adsorption–desorption curves (Fig. S4(b), ESI†) having parameters with higher values compared with the room temperature curves (Fig. 6(c)) and the curves of the POA based sensor at 100 °C (Fig. S4(a), ESI†). Careful comparison with Fig. 6(c), suggests that the rates of adsorption and desorption are accelerated by almost 40 and 20 times, respectively.
Collectively, the present sensor shows a higher LPG response (∼2.06% to 3.4% LPG), room temperature operation, excellent reproducibility (3 cycles with highest response), rapid response (∼3–4 s), fast recovery (∼20 s), good sensing selectivity, stability (stable up to 30 days) and lower detection limit (∼0.09% LPG < PEL). Overall, the LPG sensing characteristics of the present sensor in this study are better than other competing conducting polymer–metal oxide nanocomposite based LPG sensors reported in the literature,7,34–37,40 which are compared and summarized in Table 1. But the sensing conditions such as operating temperature, LPG concentration, sensor configuration, synthesis method and properties of the nanocomposites were different. Hence, comprehensively considering the LPG sensing characteristics from Table 1, it is obvious that the POA–CeO2-30 nanocomposite sensor possesses superior properties than those reported in the literature. In short, the sensor based on POA–CeO2 nanocomposites can overcome the shortcomings of long response time, slow recovery, lack of selectivity of POA and higher operating temperature of CeO2, thus presenting a very promising sensing material for the fabrication of LPG sensors operating at room temperature.
| No. | Composite | LPG response | Operating temperature | Response/recovery times (s) | Selectivity | Detection limit | Reproducibility | Stability | Reference |
|---|---|---|---|---|---|---|---|---|---|
| a RT: room temperature, NS: not studied. | |||||||||
| 1 | Poly(o-anisidine)–SnO2 | 23.47% to 3.4% | 100 °C | 5–6 s/33 s | Remarkable selectivity | NS | 3 cycles | NS | 34 |
| 2 | Polythiophene–SnO2 | 56.2% to 2.5% | RT | 94 s/466 s | NS | NS | NS | NS | 35 |
| 3 | Polypyrrole–ZnO | 32.5% to 1400 ppm | RT | 3.5–4 min/40 min | NS | NS | 3 cycles | NS | 36 |
| 4 | Poly(o-chloroaniline)–ZnO | 93% to 400 ppm | RT | 56.76 s/37.59 s | Remarkable selectivity | NS | 5 cycles | 60 days | 37 |
| 5 | Polyaniline–ZnO | 8.73% to 1000 ppm | 36 °C | 100 s/185 s | NS | NS | NS | NS | 7 |
| 6 | Poly(o-anisidine)–CeO2 | 2.06% to 3.4% | RT | 3–4 s/20 s | Remarkable selectivity | 0.09% | 3 cycles | 30 days | Present work |
3.3 LPG sensing mechanism
According to the experimental results presented above, the POA–CeO2 nanocomposite sensor exhibits enhanced response and good sensing selectivity to LPG at room temperature, compared with the POA sensor, which is attributed to the effect of the p–n heterojunctions formed between the interface of the POA and CeO2 nanoparticles. Fig. 7(a) and (b) shows the energy band structure of POA–CeO2 heterojunction before and after the contact. The experimental measured values of band gap energies, the positions of the LUMO, HOMO, conduction band and valence band are used to construct the energy band diagram. The energies of the band gap, LUMO and HOMO of POA are 3.85, 0.4 and 4.25, respectively.65 The band gap energy and the electron affinity of CeO2 are 3.8 and 4.69 eV, respectively.66 The EF, EC and EV denote the Fermi level and the positions of the conduction and valence bands, respectively. After the polymerization of o-anisidine on the surface of CeO2 nanoparticles, the p–n heterojunctions will be formed between the p-POA and n-CeO2 nanoparticles. The electrons transfer from CeO2 to POA while the holes transfer from POA to CeO2 until both Fermi levels become equal, which is a Fermi level-mediated charge transfer. Finally, an electron depletion layer is formed at the interface between POA and CeO2, leading to a heterojunction barrier due to band bending, as shown in Fig. 7(b). | ||
| Fig. 7 Energy band diagrams for (a) POA and CeO2 nanoparticles, (b) POA–CeO2 nanocomposite and (c) schematic model for the POA–CeO2 nanocomposite sensor when exposed to air and LPG at room temperature. | ||
Fig. 7(c) presents a schematic model for the POA–CeO2 nanocomposite sensor when exposed to air and LPG at room temperature. As mentioned earlier, the CeO2 nanoparticles are enwrapped and interconnected with POA in the nanocomposite and therefore, the active sites on the POA backbone are largely accessible to air and LPG. When the nanocomposite sensor is exposed to air, the surface of POA (p-type semiconductor) is readily covered with chemisorbed oxygen, even at low oxygen partial pressure and room temperature. Thus, at room temperature, in the absence of LPG, oxygen gets adsorbed on the surface of POA and it extracts electrons from its LUMO, which can be explained by the following reactions67–69
| O2 (gas) ↔ O2 (adsorbed) | (10) |
| O2 (adsorbed) + e− → O2− (chemisorbed) | (11) |
Here, the oxygen molecules are continuously supplied from the dry air and are adsorbed on the surface of the nanocomposite. The electron transfer from the LUMO to the chemisorbed oxygen results in an increase in the hole density. As a consequence, a decrease in the resistance of the nanocomposite is observed and the equilibration of the chemisorption process results in stabilization of the surface resistance. The stabilized resistance in this state is known as the resistance of the sensor in the presence of air (Ra). Any process that disturbs this equilibrium gives rise to changes in the resistance of the nanocomposite sensor. The LPG sensing process is based on the changes in the resistance of the nanocomposite sensor which is controlled by the LPG species and the amount of the chemisorbed oxygen on the surface.
It is well known that LPG consists of CH4, C3H8 and C4H10 etc. and in these molecules the reducing hydrogen species are bound to carbon, therefore LPG dissociates less easily into the reactive reducing components on the nanocomposite surface. When the nanocomposite sensor is exposed to LPG, it can be partially oxidized through the reaction with the chemisorbed O2− on the surface of the sensor. The overall reaction can be written as follows8,13,70,71
| CnH2n+2 + O2− (chemisorbed) → H2O (adsorbed) + CnH2nO + e− | (12) |
When the gas-sensing chamber is exposed to air for recovery, the oxygen molecules present in air will adsorb on the nanocomposite surface and capture the electrons through the processes indicated in eqn (10) and (12), resulting in the decrease in the resistance of the nanocomposite sensor. It can be said that in the POA–CeO2 nanocomposite, POA identifies LPG (receptor function) and both POA and CeO2 nanoparticles provide a conducting path (transducer function) and their nanocomposite permits selective detection of LPG at room temperature.
4. Conclusions
The application of POA–CeO2 nanocomposite for the detection of LPG at room temperature is successfully demonstrated. The POA–CeO2 nanocomposite based sensor showed enhanced LPG sensing characteristics compared with those of individual POA and CeO2 nanoparticles. The enhanced LPG response (∼2.06% to 3.4% LPG), excellent reproducibility, rapid response (∼3–4 s), fast recovery (∼20 s), good sensing selectivity, stability (stable up to 30 days) and detection limit lower than PEL have been achieved by the POA–CeO2 nanocomposite sensor. The POA–CeO2 nanocomposite sensor is, thus, cost-effective, room temperature operable, easy to fabricate, selective and it possesses all the essential characteristics of a reliable sensor.Acknowledgements
The authors acknowledge financial support from University Grants Commission (UGC), New Delhi (Project No. F. 530/2/DRS/2010-SAP-DRS, Phase-II). Sharada A. Thakur is thankful to UGC, New Delhi for awarding the Rajiv Gandhi National Fellowship.References
- N. Gaikwad, S. Bhanoth, P. V. More, G. H. Jain and P. K. Khanna, Chemically designed Pt/PPy nano-composite for effective LPG gas sensor, Nanoscale, 2014, 6, 2746–2751 RSC.
- H. L. Maclean and L. B. Lave, Evaluating automobile fuel/propulsion system technologies, Prog. Energy Combust. Sci., 2003, 29, 1–69 CrossRef CAS.
- C. C. Chang, J. G. Lo and J. L. Wang, Assessment of reducing ozone forming potential for vehicles using liquefied petroleum gas as an alternative fuel, Atmos. Environ., 2001, 35, 6201–6211 CrossRef CAS.
- W. Z. Qian, H. Yu, F. Wei, Q. F. Zhang and Z. W. Wang, Synthesis of carbon nanotubes from liquefied petroleum gas containing sulfur, Carbon, 2002, 40, 2968–2970 CrossRef CAS.
- A. R. Phani, X-ray photoelectron spectroscopy studies on Pd doped SnO2 liquid petroleum gas sensor, Appl. Phys. Lett., 1997, 71, 2358–2360 CrossRef CAS.
- M. Batzill and U. Diebold, Surface studies of gas sensing metal oxides, Phys. Chem. Chem. Phys., 2007, 9, 2307–2318 RSC.
- P. T. Patil, R. S. Anwane and S. B. Kondawar, Development of electrospun polyaniline/ZnO composite nanofibers for LPG sensing, Procedia Mater. Sci., 2015, 10, 195–204 CrossRef CAS.
- Y. Fu, Y. Nie, Y. Zhao, P. Wang, L. Xing, Y. Zhang and X. Xue, Detecting liquefied petroleum gas (LPG) at room temperature using ZnSnO3/ZnO nanowire piezo-nanogenerator as self-powered gas sensor, ACS Appl. Mater. Interfaces, 2015, 7, 10482–10490 CAS.
- D. Patil, V. Patil and P. Patil, Highly sensitive and selective LPG sensor based on α-Fe2O3 nanorods, Sens. Actuators, B, 2011, 152, 299–306 CrossRef CAS.
- R. B. Waghulade, R. Pasricha and P. P. Patil, Synthesis and LPG sensing properties of nano-sized cadmium oxide, Talanta, 2007, 72, 594–599 CrossRef CAS PubMed.
- P. P. Sahay and R. K. Nath, Al-doped zinc oxide thin films for liquid petroleum gas (LPG) sensors, Sens. Actuators, B, 2008, 133, 222–227 CrossRef CAS.
- G. N. Chaudhari, D. R. Bambole and A. B. Bodade, Structural and gas sensing behavior of nanocrystalline BaTiO3 based liquid petroleum gas sensors, Vacuum, 2006, 81, 251–256 CrossRef CAS.
- S. Singh, B. C. Yadav, V. D. Gupta and P. K. Dwivedi, Investigation on effects of surface morphologies on response of LPG sensor based on nanostructured copper ferrite system, Mater. Res. Bull., 2012, 47, 3538–3547 CrossRef CAS.
- R. B. Birajadar, D. Upadhye, S. Mahajan, J. C. Vyas and R. Sharma, J. Mater. Sci.: Mater. Electron., 2015, 26, 5065–5070 CrossRef CAS.
- Y. Liu, J. Parisi, X. Sun and Y. Lei, Study of room temperature LPG sensing behaviour of polyaniline thin films synthesized by cost effective oxidative polymerization technique, J. Mater. Chem. A, 2014, 2, 9919–9943 CAS.
- E. Comini, Metal oxide nano-crystals for gas sensing, Anal. Chim. Acta, 2006, 568, 28–40 CrossRef CAS PubMed.
- I. Fratoddia, I. Vendittia, C. Camettib and M. V. Russoa, Chemiresistive polyaniline-based gas sensors: A mini review, Sens. Actuators, B, 2015, 220, 534–548 CrossRef.
- H. Bai and G. Shi, Gas sensors based on conducting polymers, Sensors, 2007, 7, 267–307 CrossRef CAS.
- T. Ahuja and D. Kumar, Recent progress in the development of nano-structured conducting polymers/nanocomposites for sensor applications, Sens. Actuators, B, 2009, 136, 275–286 CrossRef.
- K. Ramanathan, M. A. Bangar, M. Yun, W. Chen, A. Mulchandani and N. V. Myung, Individually addressable conducting polymer nanowires array, Nano Lett., 2004, 4, 1237–1239 CrossRef CAS.
- J. Wang, S. Chan, R. R. Carlson, Y. Luo, G. Ge, R. S. Ries, J. R. Heath and H. R. Tseng, Electrochemically fabricated polyaniline nanoframework electrode junctions that function as resistive sensors, Nano Lett., 2004, 4, 1693–1697 CrossRef CAS.
- S. Bhadra, D. Khastgir, N. K. Singha and J. H. Lee, Progress in preparation, processing and applications of polyaniline, Prog. Polym. Sci., 2009, 34, 783–810 CrossRef CAS.
- A. Z. Sadeka, W. Wlodarskia, K. Kalantar-Zadeha, C. Bakerb and R. B. Kaner, Doped and dedoped polyaniline nanofiber based conductometric hydrogen gas sensors, Sens. Actuators, A, 2007, 139, 53–57 CrossRef.
- V. Dixit, S. C. K. Misra and B. S. Sharma, Carbon monoxide sensitivity of vacuum deposited polyaniline semiconducting thin films, Sens. Actuators, B, 2005, 104, 90–93 CrossRef CAS.
- Z. Jin, Y. Su and Y. Duan, Development of a polyaniline-based optical ammonia sensor, Sens. Actuators, B, 2001, 72, 75–79 CrossRef CAS.
- E. Kriván, C. Visy, R. Dobay, G. Harsányi and O. Berkesi, Irregular response of the polypyrrole films to H2S, Electroanalysis, 2000, 12, 1195–1200 CrossRef.
- X. B. Yan, Z. J. Han, Y. Yang and B. K. Tay, NO2 gas sensing with polyaniline nanofibers synthesized by a facile aqueous/organic interfacial polymerization, Sens. Actuators, B, 2007, 123, 107–113 CrossRef CAS.
- A. Kaushik, R. Kumar, S. K. Arya, M. Nair, B. D. Malhotra and S. Bhansali, Organic–inorganic hybrid nanocomposite-based gas sensors for environmental monitoring, Chem. Rev., 2015, 115, 4571–4606 CrossRef CAS PubMed.
- Rajesh, T. Ahuja and D. Kumar, Sens. Actuators, B, 2009, 136, 275–286 CrossRef CAS.
- H. Tai, Y. Jiang, G. Xie, J. Yu and X. Chen, Recent progress in the development of nano-structured conducting polymers/nanocomposites for sensor applications, Sens. Actuators, B, 2007, 125, 644–650 CrossRef CAS.
- H. Tai, Y. Jiang, G. Xie, J. Yu, X. Chen and Z. Ying, Influence of polymerization temperature on NH3 response of PANI/TiO2 thin film gas sensor, Sens. Actuators, B, 2008, 129, 319–326 CrossRef CAS.
- L. Geng, Y. Zhao, X. Huang, S. Wang, S. Zhang and S. Wu, Characterization and gas sensitivity study of polyaniline/SnO2 hybrid material prepared by hydrothermal route, Sens. Actuators, B, 2007, 120, 568–572 CrossRef CAS.
- L. Geng, X. Huang, Y. Zhao, P. Li, S. Wang, S. Zhang and S. Wu, H2S sensitivity study of polypyrrole/WO3 materials, Solid-State Electron., 2006, 50, 723–726 CrossRef CAS.
- D. Patil, K. Kolhe, H. S. Potdar and P. Patil, Investigation of poly(o-anisidine)–SnO2 nanocomposites for fabrication of low température operative liquefied petroleum gas sensor, J. Appl. Phys., 2011, 110, 124501–124508 CrossRef.
- S. S. Barkade, D. V. Pinjarib, U. T. Nakate, A. K. Singh, P. R. Gogate, J. B. Naik, S. H. Sonawane and A. B. Pandit, Ultrasound assisted synthesis of polythiophene/SnO2 hybrid nanolatex particles for LPG sensing, Chem. Eng. Process., 2013, 74, 115–123 CrossRef CAS.
- S. S. Barkade, D. V. Pinjari, A. K. Singh, P. R. Gogate, J. B. Naik, S. H. Sonawane, M. Ashokkumar and A. B. Pandit, Ultrasound assisted miniemulsion polymerization for preparation of polypyrrole–zinc oxide (PPy/ZnO) functional Latex for liquefied petroleum gas sensing, Ind. Eng. Chem. Res., 2013, 52, 7704–7712 CrossRef CAS.
- S. Khasim and O. A. Al-Hartomy, Fabrication and gas sensitivity in heterostructures of ortho-chloropolyaniline–ZnO nanocomposites, RSC Adv., 2014, 4, 39844–39852 RSC.
- C. R. Michela and A. H. Martínez-Preciado, CO sensor based on thick films of 3D hierarchical CeO2 architectures, Sens. Actuators, B, 2014, 197, 177–184 CrossRef.
- R. Benea, I. V. Perczel, F. ReÂti, F. A. Meyer, M. Fleisher and H. Meixner, Chemical reactions in the detection of acetone and NO by a CeO2 thin film, Sens. Actuators, B, 2000, 71, 36–41 CrossRef.
- L. Wang, H. Huang, S. Xiao, D. Cai, Y. Liu, B. Liu, D. Wang, C. Wang, H. Li, Y. Wang, Q. Li and T. Wang, Enhanced sensitivity and stability of room-temperature NH3 sensors using core–shell CeO2 nanoparticles@cross-linked PANI with p–n Heterojunctions, ACS Appl. Mater. Interfaces, 2014, 6, 14131–14140 CAS.
- B. S. Khened, T. Machappa, M. V. N. Ambika Prasad and M. Sasikala, Studies on DC conductivity and LPG sensing behavior of PANI/CeO2 composites, Int. J. Sci. Res., 2013, 1, 180–184 Search PubMed.
- S. Thakur and P. Patil, Rapid synthesis of cerium oxide nanoparticles with superior humidity-sensing performance, Sens. Actuators, B, 2014, 194, 260–268 CrossRef CAS.
- J. Liu, F. Wang and R. Dewil, CeO2 nanocrystalline-supported palladium chloride: an effective catalyst for selective oxidation of alcohols by oxygen, Catal. Lett., 2009, 130, 448–454 CrossRef CAS.
- L. Yue and X. M. Zhang, Structural characterization and photocatalytic behaviours of doped CeO2 nanoparticles, J. Alloys Compd., 2009, 475, 702–705 CrossRef CAS.
- D. Patil, P. Patil, Y. K. Seo and Y. K. Hwang, Poly(o-anisidine)–tin oxide nanocomposite: synthesis, characterization and application to humidity sensing, Sens. Actuators, B, 2010, 148, 41–48 CrossRef CAS.
- D. Patil, Y. K. Seo, Y. K. Hwang, J. S. Chang and P. Patil, Humidity sensing properties of poly(o-anisidine)/WO3 composites, Sens. Actuators, B, 2008, 128, 374–382 CrossRef CAS.
- E. M. Genies, A. Boyle, M. Lapkowski and C. Tsintavis, Polyaniline: a historical survey, Synth. Met., 1990, 36, 139–182 CrossRef CAS.
- W. Feng, E. Sun, A. Fujii, H. Wu, K. Niihara and K. Yoshino, Synthesis and characterization of photoconducting polyaniline–TiO2 nanocomposite, Bull. Chem. Soc. Jpn., 2000, 73, 2627–2633 CrossRef CAS.
- E. Kumar, P. Selvarajan and D. Muthuraj, Preparation and characterization of polyaniline/cerium dioxide (CeO2) nanocomposite via in situ polymerization, J. Mater. Sci., 2012, 47, 7148–7156 CrossRef CAS.
- C. Murugan, E. Subramanian and D. P. Padiyan, p–n heterojunction formation in polyaniline–SnO2 organic–inorganic hybrid composite materials leading to enhancement in sensor functionality toward benzene and toluene vapors at room temperature, Synth. Met., 2014, 192, 106–112 CrossRef CAS.
- J. Zhang, S. Wang, M. Xu, Y. Wang, H. Xia, S. Zhang, X. Guo and S. Wu, Polypyrrole coated SnO2 hollow spheres and their application for ammonia sensor, J. Phys. Chem. C, 2009, 113, 1662–1665 CAS.
- C. Murugan, E. Subramanian and D. P. Padiyan, Enhanced sensor functionality of in situ synthesized polyaniline–SnO2 hybrids toward benzene and toluene vapors, Sens. Actuators, B, 2014, 205, 74–81 CrossRef CAS.
- T. J. Savenije, E. Moons, G. K. Boschloo, A. Goossens and T. J. Schaafsma, Photogeneration and transport of charge carriers in a porphyrin p/n heterojunction, Phys. Rev. B: Condens. Matter Mater. Phys., 1997, 55, 9685–9692 CrossRef CAS.
- S. Bai, Y. Tian, M. Cui, J. Sun, Y. Tian, R. Luo, A. Chen and D. Li, Polyaniline@SnO2 heterojunction loading on flexible PET thin film for detection of NH3 at room temperature, Sens. Actuators, B, 2016, 226, 540–547 CrossRef CAS.
- H. B. Zeng, G. T. Duan, Y. Li, K. Yang, X. X. Xu and W. P. Cai, Blue luminescence of ZnO nanoparticles based on non-equilibrium processes: defect origins and emission controls, Adv. Funct. Mater., 2010, 20, 561–572 CrossRef CAS.
- C. Y. Lee and M. S. Strano, Understanding the dynamics of signal transduction for adsorption of gases and vapors on carbon nanotube sensors, Langmuir, 2005, 21, 5192–5196 CrossRef CAS PubMed.
- R. Pandeeswari and B. G. Jeyaprakash, Understanding the dynamics of signal transduction for adsorption of gases and vapors on carbon nanotube sensors, Sens. Actuators, B, 2014, 195, 206–214 CrossRef CAS.
- M. Siemons and U. Simon, Gas sensing properties of volume-doped CoTiO3 synthesized via polyol method, Sens. Actuators, B, 2007, 126, 595–603 CrossRef CAS.
- H. L. Ricks-Laskoski and L. J. Buckley, Twenty-year aging study of electrically conductive polypyrrole films, Synth. Met., 2006, 156, 417–419 CrossRef CAS.
- L. Bay, N. Mogensen, S. Skaarup, P. Sommer-Larsen, M. Jørgensen and K. West, Polypyrrole doped with alkyl benzenesulfonates, Macromolecules, 2002, 35, 9345–9351 CrossRef CAS.
- V. Chaudhari and A. Kaur, Enhanced room temperature sulfur dioxide sensing behaviour of in situ polymerized polyaniline–tungsten oxide nanocomposite possessing honeycomb morphology, RSC Adv., 2015, 5, 73535–73544 RSC.
- J. Liu, T. Luo, F. Meng, K. Qian, Y. Wan and J. Liu, Porous hierarchical In2O3 micro-/nanostructures: preparation, formation mechanism, and their application in gas sensors for noxious volatile organic compound detection, J. Phys. Chem. C, 2010, 114, 4887–4894 CAS.
- S. Bai, K. Zhang, L. Wang, J. Sun, R. Luo, D. Li and A. Chen, Synthesis mechanism and gas-sensing application of nanosheet-assembled tungsten oxide microspheres, J. Mater. Chem. A, 2014, 2, 7927–7934 CAS.
- S. Zhang, C. Xie, M. Hu, H. Li, Z. Bai and D. Zeng, An entire feature extraction method of metal oxide gas sensors, Sens. Actuators, B, 2008, 132, 81–89 CrossRef CAS.
- P. Routh, P. Mukherjee and A. K. Nandi, Enhanced optoelectronic properties of RNA–poly(o-methoxyaniline) hybrid containing monodispersed Au nanoparticles, J. Mater. Chem., 2010, 20, 7214–7221 RSC.
- S. S. Warule, N. S. Chaudhari, B. B. Kale, K. R. Patil, P. M. Koinkar, M. A. More and R. Murakami, Organization of cubic CeO2 nanoparticles on the edges of self assembled tapered ZnO nanorods via a template free one-pot synthesis: significant cathodoluminescence and field emission properties, J. Mater. Chem., 2012, 22, 8887–8895 RSC.
- Y. Liu, Y. Jiao, Z. Zhang, F. Qu, A. Umar and X. Wu, Hierarchical SnO2 nanostructures made of intermingled ultrathin nanosheets for environmental remediation, smart gas sensor, and supercapacitor applications, ACS Appl. Mater. Interfaces, 2014, 6, 2174–2184 CAS.
- C. L. Hsu, Y. D. Gao, Y. S. Chen and T. J. Hsueh, Vertical p-type Cu-doped ZnO/n-type ZnO homojunction nanowire-based ultraviolet photodetector by the furnace system with hotwire assistance, ACS Appl. Mater. Interfaces, 2014, 6, 4277–4285 CAS.
- L. L. Xing, C. H. Ma, Z. H. Chen, Y. J. Chen and X. Y. Xue, High gas sensing performance of one-step-synthesized Pd–ZnO nanoflowers due to surface reactions and modifications, Nanotechnology, 2011, 22, 215501–215508 CrossRef PubMed.
- S. Singh, A. Singh, B. C. Yadav and P. K. Dwivedi, Fabrication of nanobeads structured perovskite type neodymium iron oxide film: Its structural, optical, electrical and LPG sensing investigations, Sens. Actuators, B, 2013, 177, 730–739 CrossRef CAS.
- S. Singh, V. D. Gupta, B. C. Yadav, P. Tandon and A. K. Singh, Structural analysis of nanostructured iron antimonate by experimental and quantum chemical simulation and its LPG sensing, Sens. Actuators, B, 2014, 195, 373–381 CrossRef CAS.
Footnote |
| † Electronic supplementary information (ESI) available. See DOI: 10.1039/c6ra02955h |
| This journal is © The Royal Society of Chemistry 2016 |