DOI:
10.1039/C6RA02857H
(Paper)
RSC Adv., 2016,
6, 28927-28936
Fabrication and characterization of a novel PbO2 electrode with a CNT interlayer†
Received
5th February 2016
, Accepted 11th March 2016
First published on 16th March 2016
Abstract
A novel PbO2 electrode (marked as CNT–PbO2) with a carbon nanotube (CNT) interlayer was prepared by electrophoretic deposition and electro-deposition. The surface morphology, structure, electrochemical activity and stability of the CNT–PbO2 electrodes were characterized by scanning electronic microscopy (SEM), transmission electron microscopy (TEM), X-ray diffraction (XRD), X-ray photoelectron spectroscopy (XPS), ·OH production test, cyclic voltammetry (CV), electrochemical impedance spectroscopy (EIS), bulk electrolysis and accelerated life test. The results show that, compared with the traditional PbO2 electrode, the CNT–PbO2 electrodes electrodeposited β-PbO2 outer layer above the CNT interlayer had a higher crystallinity. The CNT–PbO2-5 min electrode had a higher active surface area and lower charge transfer resistance than traditional PbO2, CNT–PbO2-10 min, and CNT–PbO2-15 min electrodes due to a large number of exposed CNTs. However, the CNT–PbO2-10 min electrode exhibited a stronger ability of ·OH production, higher direct oxidation capacity for degradation of 4-chlorophenol (4-CP) and longer service lifetime than other electrodes, whose apparent rate constant for 4-CP degradation and service lifetime was 2.7 times and 1.7 times those of traditional PbO2 electrode, respectively. Thus, the proposed CNT–PbO2-10 min electrode in this study is a promising anode for the electrochemical oxidation of refractory toxic organic pollutants.
1 Introduction
In recent years, electrochemical oxidation, as one of the most promising advanced oxidation technologies, has attracted increasing attention due to its advantages of easiness of implementation, versatility, no secondary pollutant formation at the end of electrolysis and highly efficient mineralization of organics to CO2 and H2O.1–5 This technology has been widely used to degrade various wastewater polluted by phenolic compounds,6,7 pesticide,1,8,9 dyes,10,11 landfill leachate12,13 and other organic pollutants.
The material of the electrode is a crucial factor for determining the degradation efficiency of organic pollutants.14 Among all electrodes, lead dioxide (PbO2) is the most extensively used anode material for electrochemical oxidation of organic pollutants,15–17 due to its good electrical conductivity, easy synthesis, corrosion-resistance in acidic media, high electro-catalytic activity, and low cost.18–20 In order to further improve electrochemical activity and stability of PbO2 electrode, some foreign ions,21–24 metal oxides,25–27 surfactants,19 fluorine resin,28 chitosan29 and polytetrafluoroethylene (PTFE)30 were added to the electro-deposition electrolyte in the literature, and it has been proved that the reasonable additives can effectively change the physicochemical properties of PbO2 electrode.
Carbon nanotubes (CNTs) have widely applied in electrochemical oxidation owing to the unique mechanical and electronic properties.31–33 In order to promote the electro-catalytic oxidation activity and life time of PbO2 electrode, in our previous study,34 we introduced the carbon nanotubes (CNTs) into PbO2 electrode by electrodeposition technology. The doping of CNT indeed improved the electro-catalytic oxidation activity and life time of PbO2 electrode. However, we found that the CNT doping amount was little and difficultly controlled, because the CNTs were only occasionally wrapped into β-PbO2 film during the forming of β-PbO2 crystals. Therefore, in this study, we prepared a CNT interlayer for PbO2 electrode by electrophoretic deposition and successfully controlled the doping amount of CNT. The surface morphology, structure, electrochemical activity and stability of CNT–PbO2 electrodes were characterized by scanning electronic microscopy, transmission electron microscopy, X-ray diffraction, ·OH production test, cyclic voltammetry, electrochemical impedance spectroscopy, bulk electrolysis and accelerated life test.
2 Experimental section
2.1 Materials
The multi-wall CNTs were purchased from Beijing Nachen Co. Ltd (China) with an outer diameter of 10–20 nm, and length of 10–30 μm. All other chemicals were purchased from Sinopharm Chemical Reagent Co. Ltd. (China). All chemicals were of analytical grade and were used without further purification.
2.2 Electrode preparation
The traditional PbO2 electrodes were prepared according to the procedure described in our previous study.35 The CNT–PbO2 electrodes consisted of Ti substrate, SnO2–Sb2O3 bottom layer, α-PbO2 intermediate layer, β-PbO2 inner layer, CNT interlayer, and β-PbO2 outer layer, as described in Fig. 1. Ti substrates firstly underwent the pretreatment of sandblasting and ultrasonic cleaning. After pretreatment, a SnO2–Sb2O3 oxide coating and an α-PbO2 intermediate layer were prepared by thermal deposition and electro-deposition, respectively, which were same with the traditional PbO2 electrode.35 Then, β-PbO2 inner layer and CNT interlayer were sequentially fabricated on α-PbO2 intermediate layer. The β-PbO2 inner layer was electrodeposited in acid solution at 65 °C for 30 min, applying a current density of 15 mA cm−2. The acid solution composition consisted of 0.5 M Pb(NO3)2 plus 0.05 M NaF in 1 M HNO3. The CNT inter layer was fabricated by electrophoretic deposition in CNT aqueous suspension. The CNTs (100 mg) were dispersed in 100 mL aqueous solution of 0.05 g L−1 sodium dodecylbenzenesulfonate by ultrasonic vibration for 0.5 h, and the CNT suspension of 1.0 g L−1 was obtained. Two Ti substrates with β-PbO2 inner layer were used as electrodes at a distance of 3 cm. Electrophoretic deposition was conducted at a constant voltage of 30 V for a deposition time of 10 min. After deposition, the samples were dried under vacuum at 50 °C for 1 h. Finally, a β-PbO2 outer layer was electrodeposited on the above CNT interlayer. The β-PbO2 inner layer was electrodeposited in acid solution at 65 °C for 5, 10 or 15 min, applying a current density of 15 mA cm−2. The acid solution composition consisted of 0.5 M Pb(NO3)2 plus 0.05 M NaF in 1 M HNO3. The obtained electrodes are marked as CNT–PbO2-5 min, CNT–PbO2-10 min and CNT–PbO2-15 min.
 |
| Fig. 1 Structure schematic of CNT–PbO2 electrode. (1) Ti substrate, (2) SnO2–Sb2O3 layer, (3) α-PbO2 layer, (4) β-PbO2 inner layer, (5) CNT interlayer, (6) β-PbO2 outer layer. | |
2.3 Analysis
The morphology of samples was characterized by a scanning electron microscopy (SEM, JEOL JSM-6510) and transmission electron microscope (TEM, TECCNAI F20 model). The TEM sample was prepared by grinding and sonicating of coating of CNT–PbO2-10 min electrode in absolute ethanol for 1 h. A drop of the sonicated dispersion was put onto a carbon coated copper grid and allowed to dry for few minutes. X-ray diffraction (XRD) patterns of samples were obtained with an X-ray diffraction (Rigaku D-max/3C) using Cu Kα radiation (45 kV, 30 mA). X-ray photoelectron spectroscopy (XPS) studies were performed on an ESCALAB250XI spectrometer using Al Kα radiation for excitation.
The quantity of hydroxyl radical production during electrochemical processes was estimated by means of a method using terephthalic acid as a fluorescence probe. An aqueous solution of a volume of 200 mL containing 0.5 mM terephthalic acid, 0.5 g L−1 NaOH, and 0.25 M Na2SO4 was used as electrolytic solution. The anode was fabricated PbO2-based electrode and the cathode was a stainless steel sheet. Hydroxyl radical production was performed at a current density of 30 mA cm−2 at 30 °C. During the experiments, samples were drawn from the reactor every 5 min and diluted 20 times with deionized water, then analyzed by a fluorescence spectrophotometer (Perkin Elmer LS-50, American). Fluorescence spectra were recorded in the range of 370–520 nm, using an excitation wavelength at 315 nm.
Cyclic voltammetry (CV) and electrochemical impedance spectroscopy (EIS) were executed on the PGSTAT302 electrochemical workstation. EIS measurements were carried out in the frequency range from 100 kHz to 0.01 Hz in 0.5 M H2SO4 solution with an applied sine wave of 10 mV amplitude at open circuit potential (OCP). All of CV and EIS measurements were performed with a three-electrode system (the fabricated PbO2-based electrode was used as working electrode, while a platinum sheet electrode and a saturated calomel electrode as the auxiliary and reference electrodes, respectively). All the electrochemical experiments were done at ambient temperature.
Stability of electrodes was investigated using an accelerated life test with a current density of 1 A cm−2 in 2 M H2SO4 solution. These tests were conducted in a three-electrode system. The fabricated PbO2-based electrode was used as working electrode, a saturated Ag/AgCl electrode as reference electrode and a stainless steel sheet as counter electrode. The service lifetime of an electrode is defined as the operation time at which the anodic potential increased rapidly by 5 V (vs. Ag/AgCl).
2.4 Electro-catalytic oxidation
The electro-catalytic oxidation experiments were carried out by batch processes and the apparatus mainly consisted of a direct current power supply, a heat-gathering style magnetic stirrer, and a glass reactor. The anode (traditional PbO2, CNT–PbO2-5 min, CNT–PbO2-10 min or CNT–PbO2-15 min) and cathode (a stainless steel sheet) were positioned vertically and parallel to each other with a distance of 1 cm. The initial concentration of 4-chlorophenol (4-CP) during all the experimental runs was 80 mg L−1 of a volume of 200 mL. 0.05 M Na2SO4 was used as a supporting electrolyte. The reaction temperature was kept at 30 °C during all experimental runs. Electro-catalytic oxidation was performed at a current density of 30 mA cm−2. All electro-catalytic oxidation experiments were run in triplicate.
3 Results and discussion
3.1 Structure and morphology
Fig. 2 shows XRD patterns of β-PbO2 inner layer, CNT interlayer, β-PbO2 outer layer-5 min, β-PbO2 outer layer-10 min, and β-PbO2 outer layer-15 min. The diffraction peaks observed at 2θ = 25.4°, 32.0°, 36.2°, 49.1°, 52.2°, 59.0° and 62.5° in the pattern of β-PbO2 inner layer are assigned to the (110), (101), (200), (211), (220), (310) and (301) planes of β-PbO2. It can be observed that a new diffraction peak at 2θ = 26.1° appeared in the pattern of CNT interlayer except above peaks of β-PbO2. This new peak is associated with (002) diffraction of hexagonal graphite structure in CNT material, indicating that the CNT interlayer was formed on β-PbO2 inner layer. However, its peak intensity was so weak that the β-PbO2 inner layer also be detected. When the β-PbO2 outer layer was deposited for 5 min, the diffraction of C (002) peak still existed, which showed that the β-PbO2 outer layer-5 min did not cover the CNT interlayer. However, the C (002) peak disappeared in the patterns of β-PbO2 outer layer-10 min and β-PbO2 outer layer-15 min, demonstrating that the CNT interlayers may be completely covered after deposition of β-PbO2 outer layer for 10–15 min.
 |
| Fig. 2 XRD patterns of different layers. | |
The average grain sizes of β-PbO2 crystals of β-PbO2 inner layer, β-PbO2 outer layer-5 min, β-PbO2 outer layer-10 min, and β-PbO2 outer layer-15 min were calculated using the Debye–Scherrer equation.36 The results are shown in Table 1. It can be found that the grain size of β-PbO2 outer layer-5 min is 29.36 nm, which is significantly smaller than 45.15 nm of β-PbO2 inner layer, suggesting that the smaller β-PbO2 grains can be formed on CNT interlayer. This may be explained that the large surface area of CNT benefited to the forming of smaller β-PbO2 crystal grain and the nanostructure of CNT constrained crystal growth of β-PbO2. However, with the prolonging of electro-deposition time, the thickness of β-PbO2 layer increased and the grain size of β-PbO2 increased. The grain size of β-PbO2 outer layer-15 min reached 45.41 nm, which was close to the size of β-PbO2 inner layer.
Table 1 Grain size of different β-PbO2 layers from Debye–Scherrer's formula
Layer |
β-PbO2 inner layer |
β-PbO2 outer layer-5 min |
β-PbO2 outer layer-10 min |
β-PbO2 outer layer-15 min |
Crystal size/nm |
45.15 |
29.36 |
40.31 |
45.41 |
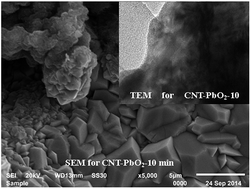
The SEM morphology of CNT interlayer is shown in Fig. 1a. It can be clearly seen that many CNTs with twisting morphology distributed on the β-PbO2 inner layer and displayed three-dimensional structure. Fig. 3b–d shows the SEM images of CNT–PbO2-5 min, CNT–PbO2-10 min and CNT–PbO2-15 min electrodes. As shown in Fig. 3b, after the electro-deposition of β-PbO2 outer layer for 5 min, a lot of flower buds-shaped particles appeared on CNT interlayer. The insert of Fig. 3b shows that the flower buds-shaped particles are composed of fine β-PbO2 crystal particles, whose grain size is much smaller than traditional PbO2 electrode (shown in Fig. S1†). The SEM image of CNT–PbO2-10 min electrode is shown in Fig. 3a and c large number of β-PbO2 crystals were formed on CNT interlayer after the electrodeposition of β-PbO2 outer layer for 10 min. The formed β-PbO2 crystals are typical pyramid structure. But their particle sizes are uneven, and a small amount of CNTs was exposed (inset of Fig. 3c). This is in contradiction with the disappearance of C (002) peak diffraction peak for CNT–PbO2-10 min electrode in XRD results, which may be due to that the exposed CNTs on CNT–PbO2-10 min electrode was too few to be detected by XRD. When the electro-deposition time of β-PbO2 outer layer was 15 min (Fig. 3d), the profile and crystal size of obtained CNT–PbO2-15 min electrode is similar with the traditional PbO2 electrode. Fig. 3e shows the TEM image of CNT–PbO2-10 min, where CNTs are clearly visible. However, the CNTs are not uniformly distributed due to the tangle of rope-shaped CNT. Further information about microstructure and thickness of each layer of this multilayer electrode was obtained from SEM cross-section image (Fig. 3f). It can be clearly seen that the CNT–PbO2-10 min electrode has significantly boundaries between each coats. The thickness of SnO2–Sb2O3 bottom layer, α-PbO2 intermediate layer, β-PbO2 inner layer, CNT interlayer and β-PbO2 outer layer was 2.9, 24.6, 43.2, 3.0 and 7.7 μm, respectively. The partial enlargement CNT interlayer and β-PbO2 outer layer shows that a large sum of micro β-PbO2 crystals grown in the gaps between CNTs (Fig. 3g). Therefore, CNT interlayer was actually combination of micro β-PbO2 crystal and CNT.
 |
| Fig. 3 SEM and TEM images of different electrodes: (a) CNT interlayer; (b) CNT–PbO2-5 min; (c) CNT–PbO2-10 min; (d) CNT–PbO2-15 min; (e) TEM for CNT–PbO2-10 min; (f) SEM cross-section for CNT–PbO2-10 min; (g) partial enlargement of (f). | |
XPS was employed to study the surface composition and element chemical state of the β-PbO2 outer layer for traditional PbO2 and CNT–PbO2-10 min electrodes. Fig. 4a presents two splitting peaks of Pb 4f7/2 and Pb 4f5/2 for traditional PbO2 and CNT–PbO2-10 min electrodes due to the electron spin and orbit coupling. The binding energies corresponding to Pb 4f7/2 and Pb 4f5/2 of β-PbO2 for traditional PbO2 electrode centered at 136.3 and 141.2 eV. This binding energy difference of 4.9 eV is similar to those reported in the literature,16,18 which can be assigned to Pb(IV). The collected spectra of O 1s region (Fig. 4b) shows two peaks: the one at the lower binding energy of 528.4 eV was assigned to strongly bounded lattice oxygen, while the boarder one at higher binding energy of 530.5 eV was attributed to weakly bounded oxygen species: absorbed OH− and water.37 The spectrum of O 1s for the CNT–PbO2-10 min electrode was apparently different from that of traditional PbO2 electrode due to the peak at higher binding energy is stronger. This may be result from the existence of abundant absorbed hydroxyl radicals on surface of the CNT–PbO2-10 min electrode, which is beneficial to the organic pollutants decomposing for indirect electrochemical oxidation process.38
 |
| Fig. 4 Pb 4f (a) and O 1s (b) core level structures in traditional PbO2 and CNT–PbO2-10 min electrodes. | |
3.2 Production of hydroxyl radical
The quantum of hydroxyl radical (·OH) production during electrochemical oxidation was estimated by means of a method using terephthalic acid as a fluorescence probe, in which 2-hydroxyterephthalic acid formed by the reaction between terephthalic acid and electrochemical-generated ·OH. The fluorescence emission spectrum (excitation at 315 nm) of the solution was measured every 5 min during electrochemical oxidation. As shown in Fig. 5, gradual increase in the fluorescence intensity at ca. 425 nm was observed with increasing electrolysis time. The generated spectra have the identical shape and maximum wavelength with that of 2-hedroxyterephthalic acid,39 indicating that the hydroxyl radicals were indeed constantly produced on these anodes. Fig. 6 plots the linear relationship between fluorescence intensity of 2-hedroxyterephthalic acid and electrolysis time. A linear response to fluorescence intensity of 2-hedroxyterephthalic acid over reaction time was observed, indicating that hydroxyl radicals formed on four kinds of electrodes are in proportional to the electrolysis time obeying zero-order reaction kinetics. The hydroxyl radical formation rate constants (k, the slope of fitting line of fluorescence intensity versus t using zero-order reaction kinetics equation) of different electrodes follow the sequence: CNT–PbO2-10 min > CNT–PbO2-5 min > CNT–PbO2-15 min > traditional PbO2. Thus, the CNT–PbO2-10 min electrode has the highest production rate of ·OH radicals, which was 4.2 times that of traditional PbO2 electrode. This multiple value is significantly higher than those (less than two times) for Ti/SnO2–Sb2O3/PbO2 based on porous titanium substrate,40 porous Ti/SnO2–Sb2O3–CNT/PbO2,41 LAS–CNT–PbO2
42 and CNT–Bi–PbO2 electrodes.43 This high production rate of ·OH radicals of CNT–PbO2-10 min can be ascribed to its more β-PbO2 crystals than CNT–PbO2-5 min and smaller β-PbO2 crystals than CNT–PbO2-20 min. It should enable the CNT–PbO2-10 min to have larger surface area of β-PbO2 crystals, which can provide more active sites to generate more ·OH radicals.44
 |
| Fig. 5 Fluorescence spectra changes observed during electro-catalytic oxidation processes in aqueous solution of 0.5 mmol L−1 terephthalic acid. (a) Traditional PbO2 electrode; (b) CNT–PbO2-5 min; (c) CNT–PbO2-10 min; (d) CNT–PbO2-15 min. | |
 |
| Fig. 6 Plots showing the induced fluorescence intensity against electrolysis time for 2-hydroxyterephthalic acid. | |
3.3 Electrochemical measurements
The electrochemical activity was related to the real surface and the active sites accessible to electrolyte when electrochemical reaction occurs.36,44 The voltammetric charge quantity (q*) is related to real surface area and the number of active sites.45,46 Thus, we estimated q* using cyclic voltammograms obtained in 0.5 M H2SO4 solution to reflect the electrochemical activity of electrodes. Fig. 7 shows cyclic voltammograms of traditional PbO2, CNT–PbO2-5 min, CNT–PbO2-10 min and CNT–PbO2-15 min electrodes measured at different scan rates. The relation of q* against the square root of scan rate is shown in Fig. 8. The q* was obtained by integration of cyclic voltammetric curves over the whole potential range from 0.5 to 2 V. It can be observed that the q* decreased as the potential scan rate v increased, because the access of the electrolyte ions to the inner regions of oxide film became more difficult at a faster scan rate.47 It also can be observed from Fig. 8 that the CNT–PbO2-5 min electrode had the highest voltammetric charge quantity q* among all electrodes, indicating the highest active surface area of CNT–PbO2-5 min electrode. This may be the result of a large number of exposed CNTs on the CNT–PbO2-5 min electrode.
 |
| Fig. 7 Cyclic voltammograms of different PbO2 electrodes in 0.5 mol L−1 H2SO4 solution at different scan rates. (a) Traditional PbO2 electrode; (b) CNT–PbO2-5 min; (c) CNT–PbO2-10 min; (d) CNT–PbO2-15 min. | |
 |
| Fig. 8 Relationship of voltammetric charge quantity (q*) versus the square root of scan rate. | |
EIS was also used to investigate the electrochemical properties of traditional PbO2, CNT–PbO2-5 min, CNT–PbO2-10 min and CNT–PbO2-15 min electrodes. Fig. 9 presents the Nyquist plots of different electrodes in a frequency range of 0.01 Hz to 100 kHz. It can be clearly observed that all electrodes exhibit one big semicircle. To calculate the resistance value to the electrode–electrolyte interphase, the Nyquist plots are fitted and interpreted with the help of an equivalent electric circuit, as shown in the inset of Fig. 9. The intersection of plots with the real axis at the high-frequency end is bulk resistance (Rs), the semicircle represents the charge transfer resistance (Rct) at the contact interface between the electrode and the electrolyte solution, and Qdl correspond to the constant phase element (CPE) which is introduced to replace the electric double layer capacitance.7,40,44 The calculated values of Rs, Rct, and Qdl are listed in Table 2. The charge transfer resistance decreased in the order: CNT–PbO2-5 min < CNT–PbO2-10 min < traditional PbO2 < CNT–PbO2-15 min. This indicates that the transfer of electrons was easier on CNT than the PbO2. Thus, the adding of CNT interlayer should improve the activity of PbO2 electrode.
 |
| Fig. 9 Nyquist diagrams of traditional PbO2, CNT–PbO2-5 min, CNT–PbO2-10 min, and CNT–PbO2-15 min electrodes. Inset: equivalent circuit used in the analysis of experimental EIS data. | |
Table 2 Electrochemical parameters of electrodes
Samples |
Rs (Ω) |
Rct (Ω) |
Qdl |
Traditional PbO2 |
4.703 |
69.3 |
0.00441 |
CNT–PbO2-5 min |
5.971 |
34.14 |
0.01479 |
CNT–PbO2-10 min |
4.689 |
45.35 |
0.004384 |
CNT–PbO2-15 min |
4.715 |
70.1 |
0.004548 |
Fig. 10 displays the cyclic voltammograms of traditional PbO2, CNT–PbO2-5 min, CNT–PbO2-10 min and CNT–PbO2-15 min electrodes in 0.5 M Na2SO4 solution with 200 mg L−1 4-CP at a scan rate of 50 mV s−1, which was used to determine the direct oxidation capacity of electrodes for organic pollutants degradation. It can be observed from cyclic voltammetric curves that a well-defined oxidation peak appeared between 0.8 and 1.2 V during positive sweeps for all electrodes, due to the direct electro-oxidation of 4-CP. The peak current for oxidation process exhibited a higher value with the adding of CNT interlayer. The anodic peak current decreased in the following order: CNT–PbO2-10 min, CNT–PbO2-5 min, CNT–PbO2-15 min and traditional PbO2. A decrease of the oxidation peak potential was also observed, and the potentials of the peaks moved to more negative direction according to the order: CNT–PbO2-15 min, traditional PbO2, CNT–PbO2-10 min, and CNT–PbO2-5 min. These results indicate that the CNT–PbO2-10 min electrodes should have the higher direct oxidation capacity for 4-CP degradation than other electrodes. This may be related to the larger surface area of β-PbO2 on CNT–PbO2-10 min electrodes.
 |
| Fig. 10 Cyclic voltammograms of different PbO2 electrodes in 0.5 mol L−1 Na2SO4 solution with 200 mg L−1 4-CP at a scan rate of 50 mV s−1. | |
3.4 Electrochemical degradation of 4-CP
To explore the electro-catalytic degradation activity of traditional PbO2, CNT–PbO2-5 min, CNT–PbO2-10 min and CNT–PbO2-15 min electrodes, the degradation of 4-CP was tested using these electrodes as anode. The 4-CP removal efficiency data for these anodes are shown in Fig. 11a. It can be clearly seen that 96.28% of 4-CP removal ratio was achieved on the CNT–PbO2-10 min electrode after the electrolysis of 2 h, and only 67.13%, 90.45% and 71.27% for the traditional PbO2, CNT–PbO2-5 min and CNT–PbO2-15 min electrodes, respectively. The removal efficiency of 4-CP on CNT–PbO2-10 min electrode was compared with that reported in literatures26,48 at similar conditions, the electrochemical degradation of 4-CP was carried out on La–PbO2 electrode and Ti/Sb–SnO2 electrode at an effective reactor volume of 500 mL and 400 mL, at a current density of 20 mA cm−2 for an initial 1 mM L−1 4-CP (electrode surface area of 15 cm2). The result showed that 4-CP efficiency reached only 50% and 51% after 3 h, respectively. Besides, the 4-CP removal ratio of 96.28% (an initial concentration of 50 mg L−1) is also close to that obtained on LAS–CNT–PbO2 electrode34 for an initial 50 mg L−1 4-CP, other conditions are same. Obviously, the CNT–PbO2-10 min electrode is more active. The regression analysis of the concentration vs. reaction time for 4-CP degradation on all electrodes was also examined with a pseudo-first-order model: dC4-CP/dt = −kC4-CP. As shown in Fig. 11b, good linear correlation between the logarithm values of the normalized concentration and treatment time can be obtained for all electrodes. The pseudo-first-order rate constant value (kapp) for the CNT–PbO2-10 min electrode was 0.0268 min−1, which was 2.7, 1.4, and 2.5 times those of traditional PbO2, CNT–PbO2-5 min, and CNT–PbO2-15 min electrodes, respectively. So, the CNT–PbO2-10 min electrode exhibited a better degradation performance than other three electrodes. This result was mainly related with the different morphology of electrodes. It can be seen in Fig. 3, the grain size of CNT–PbO2-5 min is significantly smaller than the others. The smaller the grain size of β-PbO2, the higher the specific surface area of β-PbO2 layer should be. However, it also can be seen from Fig. 3, the formed β-PbO2 crystals on CNT–PbO2-5 min are much fewer than CNT–PbO2-10 min and a large number of CNTs are exposed. More β-PbO2 crystals of CNT–PbO2-10 min can provide more active sites to generate more ˙OH radicals. Therefore, the CNT–PbO2-5 min electrode have higher voltammetric charge quantity q* (Fig. 7 and 8) and the smaller charge transfer resistance (Fig. 9) due to more exposed CNTs, but the CNT–PbO2-10 min electrode has a much higher production rate of ˙OH radicals (Fig. 5 and 6) and stronger direct oxidation capacity for 4-CP (Fig. 10) than CNT–PbO2-5 min electrode. Thus, the higher electro-catalytic performance of CNT–PbO2-10 min electrode in electrochemical degradation of 4-CP was mainly ascribed to its higher production rate of ˙OH and stronger direct oxidation capacity for 4-CP degradation.
 |
| Fig. 11 Variation of 4-CP removal efficiency with reaction time (a) and first order kinetics fitting curves (b) during electrochemical oxidation. | |
3.5 Electrode stability
The stability of traditional PbO2, CNT–PbO2-5 min, CNT–PbO2-10 min and CNT–PbO2-15 min electrodes were compared by accelerated life tests. As shown in Fig. 12, the service lifetime of CNT–PbO2-5 min, CNT–PbO2-10 min and CNT–PbO2-15 min electrodes is 72, 95 and 104 h, respectively, and all longer than 56 h of traditional PbO2 electrode. The higher electrochemical stability of CNT–PbO2 electrodes may be attributed to their specific β-PbO2 layer consisting of β-PbO2 inner layer, CNT interlayer and β-PbO2 outer layer. The β-PbO2 outer layer and β-PbO2 inner layer provides double protection to inhibit the electrolyte penetrate to substrate, which can be proved by the increase of service lifetime with the increase of electrodeposition time of β-PbO2 outer layer. It also can be observed from Fig. 12, the anode potential increase for CNT–PbO2-5 min, CNT–PbO2-10 min and CNT–PbO2-15 min electrodes took place in two stages. The first stage occurred at 5, 30 and 45 h with a slightly increase, which should be caused by the stripping of β-PbO2 outer layer and CNT interlayer. The second stage occurred at 67, 93 and 101 h, involves a rapid and great rise. The corresponding potential increase should be attributed to the stripping of β-PbO2 inner layer, α-PbO2 inner layer and SnO2–Sb2O3 layer. This phenomenon also proved the double protection of β-PbO2 outer layer and β-PbO2 inner layer.
 |
| Fig. 12 Variation of anode potential (vs. Ag/AgCl) with the testing time in the accelerated life test for different PbO2 electrodes. | |
4 Conclusions
A novel PbO2 electrode (marked as CNT–PbO2) was prepared by fabricating a CNT interlayer between β-PbO2 inner layer and β-PbO2 outer layer using electrophoretic deposition technology. The grain size of β-PbO2 formed on CNT interlayer was significantly smaller than that of traditional PbO2 electrode. The CNT–PbO2-5 min electrode has higher voltammetric charge quantity q* and lower charge transfer resistance than traditional PbO2, CNT–PbO2-10 min, and CNT–PbO2-15 min electrodes due to a large number of exposed CNTs. However, the CNT–PbO2-10 min electrode demonstrated a superior electrochemical oxidation ability for degradation of 4-CP, whose apparent rate constant was 2.7, 1.4, and 2.5 times those of traditional PbO2, CNT–PbO2-5 min, and CNT–PbO2-15 min electrodes, respectively, due to its stronger ability of ·OH production and higher direct oxidation capacity for 4-CP degradation than traditional PbO2, CNT–PbO2-5 min, and CNT–PbO2-15 min electrodes. Besides, the results of accelerated life tests showed that the service lifetime of CNT–PbO2-10 min electrode was 95 h, much longer than 56 h of traditional PbO2 electrode. Thus, the proposed CNT–PbO2-10 min electrode in this study is a promising anode for electrochemical oxidation of refractory toxic organic pollutants.
Acknowledgements
This project was supported financially by the Young People Fund (20150520079JH) and Natural Science Fund (20140101215JC) of Jilin Science and Technology Department, China. This work was also supported by the Development Program (2014055) of Siping Technology Bureau, China.
References
- R. Vargas, S. Díaz, L. Viele, O. Núñez, C. Borrás, J. Mostany and B. R. Scharifker, Appl. Catal., B, 2014, 144, 107–111 CrossRef CAS.
- G. R. P. Malpass, D. W. Miwa, S. A. S. Machado and A. J. Motheo, J. Hazard. Mater., 2010, 180, 145–151 CrossRef CAS PubMed.
- F. Zaviska, P. Drogui, J. F. Blais, G. Mercier and P. Lafrance, J. Hazard. Mater., 2011, 185, 1499–1507 CrossRef CAS PubMed.
- Á. Anglada, A. Urtiaga, I. Ortiz, D. Mantzavinos and E. Diamadopoulos, Water Res., 2011, 45, 828–838 CrossRef PubMed.
- Y. Yavuz, A. S. Koparal and Ü. B. Öğütveren, Desalination, 2010, 258, 201–205 CrossRef CAS.
- G. V. Kornienko, N. V. Chaenko, N. G. Maksimov, V. L. Kornienko and V. P. Varnin, Russ. J. Electrochem., 2011, 47, 240–245 CrossRef.
- Y. Liu, H. Liu, J. Ma and J. Li, J. Hazard. Mater., 2012, 213–214, 222–229 CrossRef CAS PubMed.
- F. d. A. A. de Figueredo-Sobrinho, F. W. de Souza Lucas, T. P. Fill, E. Rodrigues-Filho, L. H. Mascaro, P. N. da Silva Casciano, P. de Lima-neto and A. N. Correia, Electrochim. Acta, 2015, 154, 278–286 CrossRef.
- Y. Samet, L. Agengui and R. Abdelhédi, Chem. Eng. J., 2010, 161, 167–172 CrossRef CAS.
- X. Li, X. Li, W. Yang, X. Chen, W. Li, B. Luo and K. Wang, Electrochim. Acta, 2014, 146, 15–22 CrossRef CAS.
- S. Song, J. Fan, Z. He, L. Zhan, Z. Liu, J. Chen and X. Xu, Electrochim. Acta, 2010, 55, 3606–3613 CrossRef CAS.
- M. Panizza and C. A. Martinez-Huitle, Chemosphere, 2013, 90, 1455–1460 CrossRef CAS PubMed.
- G. Zhao, Y. Pang, L. Liu, J. Gao and B. Lv, J. Hazard. Mater., 2010, 179, 1078–1083 CrossRef CAS PubMed.
- A. Mukimin, H. Vistanty and N. Zen, Chem. Eng. J., 2015, 259, 430–437 CrossRef CAS.
- G. Darabizad, M. S. Rahmanifar, M. F. Mousavi and A. Pendashteh, Mater. Chem. Phys., 2015, 156, 121–128 CrossRef CAS.
- O. B. Shmychkova, T. V. Luk'yanenko, R. Amadelli and A. B. Velichenko, Prot. Met. Phys. Chem. Surf., 2014, 50, 493–498 CrossRef CAS.
- L. Vazquez-Gomez, A. de Battisti, S. Ferro, M. Cerro, S. Reyna, C. A. Martínez-Huitle and M. A. Quiroz, Clean: Soil, Air, Water, 2012, 40, 408–415 CrossRef CAS.
- O. Shmychkova, T. Luk'yanenko, A. Velichenko, L. Meda and R. Amadelli, Electrochim. Acta, 2013, 111, 332–338 CrossRef CAS.
- W. Yang, W. Yang and X. Lin, Appl. Surf. Sci., 2012, 258, 5716–5722 CrossRef CAS.
- I. Sirés, C. T. J. Low, C. Ponce-de León and F. C. Walsh, Electrochem. Commun., 2010, 12, 70–74 CrossRef.
- F. Caldara, A. Delmastro, G. Fracchia and M. Maja, J. Electrochem. Soc., 1980, 127, 1869–1876 CrossRef CAS.
- Y. Liu, H. Liu and Y. Li, Appl. Catal., B, 2008, 84, 297–302 CrossRef CAS.
- A. B. Velichenko, D. V. Girenko, N. V. Nikolenko, R. Amadelli, E. A. Baranova and F. I. Danilov, Russ. J. Electrochem., 2000, 36, 1216–1220 CrossRef CAS.
- R. Amadelli, L. Armelao, A. B. Velichenko, N. V. Nikolenko, D. V. Girenko, S. V. Kovalyov and F. I. Danilov, Electrochim. Acta, 1999, 45, 713–720 CrossRef CAS.
- Y. Yao, C. Zhao and J. Zhu, Electrochim. Acta, 2012, 69, 146–151 CrossRef CAS.
- J. Kong, S. Shi, L. Kong, X. Zhu and J. Ni, Electrochim. Acta, 2007, 53, 2048–2054 CrossRef CAS.
- A. B. Velichenko, R. Amadelli, V. A. Knysh, T. V. Luk'yanenko and F. I. Danilov, J. Electroanal. Chem., 2009, 632, 192–196 CrossRef CAS.
- M. Zhou, Q. Dai, L. Lei, C. Ma and D. Wang, Environ. Sci. Technol., 2005, 39, 363–370 CrossRef CAS PubMed.
- Y. Wang, Z. Shen, Y. Li and J. Niu, Chemosphere, 2010, 79, 987–996 CrossRef CAS PubMed.
- S. P. Tong, C. A. Ma and H. Feng, Electrochim. Acta, 2008, 53, 3002–3006 CrossRef CAS.
- L. Zhang, L. Xu, J. He and J. Zhang, Electrochim. Acta, 2014, 117, 192–201 CrossRef CAS.
- M. Ferreira, M. F. Pinto, I. C. Neves, A. M. Fonseca, O. S. G. P. Soares, J. J. M. Órfão, M. F. R. Pereira, J. L. Figueiredo and P. Parpot, Chem. Eng. J., 2015, 260, 309–315 CrossRef CAS.
- Y. Zhang, X. Zhang, X. Lu, J. Yang and K. Wu, Food Chem., 2010, 122, 909–913 CrossRef CAS.
- X. Duan, F. Ma, Z. Yuan, L. Chang and X. Jin, Electrochim. Acta, 2012, 76, 333–343 CrossRef CAS.
- X. Duan, F. Ma, Z. Yuan, L. Chang and X. Jin, J. Taiwan Inst. Chem. Eng., 2013, 44, 95–102 CrossRef CAS.
- H. Xu, D. Shao, Q. Zhang, H. Yang and Y. Wei, RSC Adv., 2014, 4, 25011–25017 RSC.
- R. Amadelli, L. Armelao, E. Tondello, S. Daolio, M. Fabrizio and C. Pagura, Appl. Surf. Sci., 1999, 142, 200–203 CrossRef CAS.
- O. Shmychkova, T. Luk'yanenko, A. Yakubenko, R. Amadelli and A. Velichenko, Appl. Catal., B, 2015, 162, 346–351 CrossRef CAS.
- K. Ishibashi, A. Fujishima, T. Watanabe and K. Hashimoto, J. Photochem. Photobiol., A, 2000, 134, 139–142 CrossRef CAS.
- W. Zhao, J. Xing, D. Chen, Z. Bai and Y. Xia, RSC Adv., 2015, 5, 26530–26539 RSC.
- J. Xing, D. Chen, W. Zhao, X. Peng, Z. Bai, W. Zhang and X. Zhao, RSC Adv., 2015, 5, 53504–53513 RSC.
- X. Duan, F. Ma, Z. Yuan, L. Chang and X. Jin, J. Electroanal. Chem., 2012, 677–680, 90–100 CrossRef CAS.
- L. Chang, Y. Zhou, X. Duan, W. Liu and D. Xu, J. Taiwan Inst. Chem. Eng., 2014, 45, 1338–1346 CrossRef CAS.
- H. Xu, Q. Yuan, D. Shao, H. Yang, J. Liang, J. Feng and W. Yan, J. Hazard. Mater., 2015, 286, 509–516 CrossRef PubMed.
- H. Kong, W. Huang, H. Lin, H. Lu and W. Zhang, Chin. J. Chem., 2012, 30, 2059–2065 CrossRef CAS.
- H. Kong, H. Lu, W. Zhang, H. Lin and W. Huang, J. Mater. Sci., 2012, 47, 6709–6715 CrossRef CAS.
- Y. Chen, L. Hong, H. Xue, W. Han, L. Wang, X. Sun and J. Li, J. Electroanal. Chem., 2010, 648, 119–127 CrossRef CAS.
- J. Kong, S. Shi, X. Zhu and J. Ni, J. Environ. Sci., 2007, 19, 1380–1386 CrossRef CAS.
Footnote |
† Electronic supplementary information (ESI) available. See DOI: 10.1039/c6ra02857h |
|
This journal is © The Royal Society of Chemistry 2016 |
Click here to see how this site uses Cookies. View our privacy policy here.