Migration behavior of anionic polyurethane dispersion during infiltration and redistribution in sand

Yunxiao Zangab, Hao Xieab, Wei Gongab, Zechuan Duab, Bailing Liu*a and Hualin Chena
aR&D Center of Materials and Technology for Ecological Sand-fixing, Chengdu Institute of Organic Chemistry, Chinese Academy of Sciences, Chengdu, 610041, PR China. E-mail: blliuchem@hotmail.com; Fax: +86-28-85260436; Tel: +86-28-85260436
bGraduate University of Chinese Academy of Sciences, Beijing, 100049, PR China

Received 30th January 2016 , Accepted 17th April 2016

First published on 19th April 2016


Abstract

Migration behavior strongly affects the properties of the chemical sand stabilization (CSS) crust by determining the distribution of the stabilizing material in sand. A simple method was established to investigate the migration behavior of anionic polyurethane (APU) dispersion (APUD) in sand, based on weight measurement. The movements of APU particles and water were found to differentiate during the redistribution, as a result of the size restriction of film water. By analyzing the interaction between the sand surface, APU particles, and water, four patterns of the migration of APU particles were illustrated. Factors that might affect the migration, such as temperature, APU particle size, and concentration of APUD, were investigated. A semi-empirical formula was deduced for the thickness of the CSS crust, which demonstrates the relationship among sand, water, and the stabilizing material.

1. Introduction

Sandy desertification, land degradation characterized by wind erosion mainly resulting from excessive human activities, is a severe environmental problem in the arid, semi-arid, and a portion of sub-humid regions.1 Due to its tremendous damage to the environmental system, social stability, and economic development, sandy desertification has drawn worldwide attention and great efforts have been made to mitigate its encroachment.2–5 The main strategies to combat sandy desertification can be concluded as better preservation of original dry land ecosystems and desert restoration.6 Chemical sand stabilization (CSS) has shown potential in desert restoration due to its quickness and low labor cost, compared to other technologies such as engineering sand stabilization7–9 and vegetal sand stabilization.10,11 As a technology to improve the anti-wind erosion ability of sand, CSS is carried out by forming a consolidated crust on the sand surface with a binding material.12

Plenty of kinds of materials have been developed for CSS, ranging from inorganic materials such as cement paste13 and sodium silicate,14 organic materials like asphalt emulsion,15 polyacrylamide (PAM)16 and polyvinyl acetate (PVAc),17 to organic–inorganic composite materials.18 The inorganic materials are inexpensive but can only form rigid crusts, which are too hard for seed germination and crisp to crack.19 But the synthetic polymers, which benefit from their broad modulus, can form rigid, plastic, or elastic crusts according to the demand. Polyurethane (PU) is a kind of polymer with excellent properties in a versatile range, which ensures its various applications,20 and for this reason it has been introduced into CSS in recent years.21,22 Waterborne polyurethane dispersion (PUD) has an environmentally friendly nature and low content of volatile organic chemicals (VOCs) and hazardous air pollutants (HAPs),23 moreover, its viscosity is relatively low and this offers good permeability in sand. It was found in our former study that cationic dispersions may restrain the growth of plants; thereby we employed anionic polyurethane (APU) dispersion (APUD) in our study.

Although CSS has potential in desert restoration, the fundamental research on its working mechanism is quite deficient, especially on the migration behavior of the stabilizing material in sand. The important properties of CSS crusts, such as thickness, porosity, and hardness, are strongly affected by the distribution of sand-stabilizing materials in sand, which relies on the migration of the material particles. Therefore it is vital to get a better understanding of the migration, which is closely connected with the CSS operating method and the structure characteristics of sand.

Spraying, with sand-stabilizing material in the form of aqueous dispersion, is the most preferable in the application of CSS,24 which decides that the mix of the material and sand mainly depends on the natural penetration of the material. While sand naturally has internal macropores which have been proven to be the primary channels for water flow in soil,25 it provides a good penetration condition for the sand-stabilizing material. It was found that the thickness and the porosity of the CSS crust show dependence on the spray amount of the sand-stabilizing material,26 and the thicknesses are also different between different kinds of materials.27 Unlike solute transport in soil which has been studied for years,28 the movement of polymer particles in soil has been rarely reported. Even in the field of irrigation, where polymers have drawn researchers’ interests due to their effect on soil preservation, most of the studies are concerned with its improvement on the water infiltration rate and relative mechanisms.29–32 Generally, the movements of water or aqueous dispersions in porous systems can be divided into two stages: the infiltration stage and the redistribution stage.33 The studies on irrigation, whether in the field or simulated in the laboratory, were conducted to investigate the infiltration process under a continuous water supply. But for CSS, due to the finite spray amount, the infiltration process is very short, such as within several minutes,34 while the redistribution process may last much longer because it usually takes tens of hours for the materials to cure.35 As can be inferred, the redistribution process should play a role no less important than the infiltration process does in the migration of the sand-stabilizing material.

The objectives of this study were to: (i) determine the migration of APUD in sand, especially the APU particles; (ii) establish a practical method to investigate and evaluate the migration of the aqueous sand-stabilizing materials in sand; (iii) identify the relationship between the CSS crust thickness and the spray amount.

2 Experimental

2.1 Materials

Sand used in the study was fetched from Kerqin Sandy Land, Inner Mongolia, PR China. Its natural moisture content θm = 0.24%. The specific gravity is Gs = 2.60. The bulk density and pack density are measured as ρb = 1.50 g cm−3 and ρp = 1.73 g cm−3, with corresponding porosities of eb = (1 − ρb/Gs) × 100 = 42.3% and ep = (1 − ρp/Gs) × 100 = 32.7%. The grain size distribution of the sand is shown in Fig. 1. It has a mean grain size, D50 = 0.17 mm, coefficient of uniformity, Cu = D60/D10 = 1.50, and coefficient of curvature, Cc = (D30)2/(D10D60) = 1.19.
image file: c6ra02764d-f1.tif
Fig. 1 Grain size distribution of sand acquired from Kerqin Sandy Land.

APUD was prepared with toluene diisocyanate (TDI), polypropylene glycol (PPG), and chain extenders. Its hydrophilicity comes from the anionic chain extender, dimethylol propionic acid (DMPA). Its main characteristics are presented in Table 1.

Table 1 Characteristics of APUD
No. Particle size/nm –COO−1/mmol g−1 Zeta potential/mV
APUD-1 35.46 0.37 33.05
APUD-2 47.94 0.37 36.55
APUD-3 118.30 0.37 48.75
APUD-4 214.15 0.37 55.85
APUD-5 225.75 0.37 52.85


2.2 Experimental setup for penetration

The experimental setup is shown in Fig. 2. Sand was filled into a glass tube 30 mm in diameter and 150 mm long, which was tied to a piece of gauze with a rubber band at the bottom for ventilation, and covered with a piece of circular filter paper on top to avoid impact of the liquid. The liquid used in the experiment, water or APUD, was measured by a measuring cylinder first, and then transferred to sand by a dropper in 1–2 minutes (dosage used was 6 L m−2 for APUD, and 12 L m−2 for water in order to make different stages of its penetration clearer). Once all the liquid on the filter paper got in, the tube was sealed with a piece of plastic wrap on its top to avoid evaporation, and then set on a substrate for penetration (the substrate also had holes for ventilation). The penetration of the liquid was separated into two stages: before the water on the paper disappeared was the infiltration stage; after that, it entered the redistribution stage.
image file: c6ra02764d-f2.tif
Fig. 2 Experimental setup for the penetration of APUD in sand.

Considering the complexity of water movement in sand, two measures were taken to simplify the experimental conditions: one was precluding evaporation by sealing the tube used in the experiment; the other was lowering water steam in sand by carrying out the experiment at a temperature below 20 °C.

2.3 Weight measurement of sand and moisture

The amounts of sand and moisture were measured by weight. Four kinds of weight needed to be measured directly in this study. The weight of the container, including the tube with filter paper, was measured as m0 before sand-filling. After a period of penetration, the tube was removed from the gauze and plastic wrap and canted about 45 degrees with a smooth rotation till the dry sand slid out, then the weight of the tube with wet sand was measured as m1. After that, the tube was put in an oven at 50 °C for 48 h, and then the tube with dry sand was weighed as m2. In the case of the APUD used, the tube would be tapped by a wood block, the residue would be reloaded after sieving the dropped loose part of the sand with a 20 mesh sieve, and weighed together with the adhered sand as m3. Each value of weight was the average result of three parallel tests.

There are three kinds of weight that need to be calculated according to the following formulas:

 
mm = m1m2 (1)
 
ms = m2m0 (2)
 
msa = m3m0 (3)
where mm is the weight of the moisture in sand in g, ms is the dry weight of sand moistened in g and msa is the dry weight of stabilized sand in g.

2.4 Characterization apparatus

The particle size of APUD was analyzed by dynamic light scattering with a Zetasizer®-HS laser particle analyzer (Malvern Instruments, UK), which uses a coherent monochromatic He–Ne laser (633 nm) as a light source and a detector detecting the scattered light at an angle of 90 degrees. And the zeta potential of APUD was measured by laser Doppler electrophoresis with the same apparatus. The samples were diluted with deionized water to a concentration of 0.1% before testing.

The microscopy pictures of sand were taken with a camera connected to an optical microscope. Light was given over the side of the sample with a flashlight. Each picture was merged with several pictures taken at different depths of field.

Detailed surface structures of the stabilized sand samples were investigated by scanning electron microscopy (SEM) with a JSM-7500F (JEOL, Japan). The samples were treated by spay-gold before testing.

3 Results and discussion

3.1 Water redistribution and morphology change

As the disperse medium of APUD, water provides both impetus and space for dispersed APU particles to move. That determines the migration dependence of APU particles on water movement, which varies with the different morphologies of water in sand. Therefore, we initiated our study with the investigation on the movement and morphology of water in sand.

Since the bottom surface of the wet sand was irregular and hard to measure, we introduced a new index, penetration efficiency denoted by ψ, to characterize the migration of liquid in sand. Its definition is the dry weight of sand moistened by per unit volume of liquid. The value of ψ can reflect the permeability of liquid and its penetration ability when time is considered. Its calculation formula is shown as the following:

 
image file: c6ra02764d-t1.tif(4)
in which ψ is the penetration efficiency in g mL−1, ms is the dry weight of sand moistened in g, and Vl is the volume of the liquid in mL.

We denoted the ψ of water with ψw and plotted it versus time as shown in Fig. 3a. In this form, the result shows a positive correlation with penetration development, and it makes the understanding of water movement more direct. Symbols ψs and ψf are used to represent ψ of saturated sand and sand with maximum capillary handing water, respectively. The plot initiates a little above ψs and increase rapidly in the first 2 h. When approaching ψf, the increasing velocity slows down and nearly ceases at ψf for 2 h. Then it proceeds to rise till the end of testing. Fig. 3b is a microscopy picture of the sand surface with different amounts of water. It can be seen that before infiltration the water in sand is invisible, existing as hygroscopic water. After infiltration, different kinds of water morphologies, visible or invisible, emerge in sand and keep evolving with the redistribution process.


image file: c6ra02764d-f3.tif
Fig. 3 (a) Water redistribution in sand described by the chart of ψt (16 °C, 12 L m−2). Symbols ψs and ψf represent ψ of saturated sand and sand with maximum capillary handing water, respectively. (b) Microscopy picture of the sand surface. The upper half is of dry sand, which shows no visible liquid anywhere. The lower half is of moistened sand, which shows visible liquid between the gaps of sand grains.

Different values of ψw correspond to different movements and morphologies of water. This correspondence is illustrated in Fig. 4. At ψ = ψs (Fig. 4a), the pores in sand are filled with water, which moves under the action of gravity and is thus called gravity water. In the range of ψsψf (Fig. 4b), gaps emerge and enlarge when water flows from upper to lower to supply a new moistened area expanded by the wetting front, and this process may be prolonged when the infiltration amount increases. At ψ = ψf (Fig. 4c), all of the gravity water turns into capillary handing water and film water, and the capillary water diminishes with ψ increasing. When ψψf (Fig. 4d), the capillary handing water nearly disappears and there is mainly film water in the sand.


image file: c6ra02764d-f4.tif
Fig. 4 Water morphology change during redistribution in sand: (a) at the beginning of the redistribution, the sand pores are full of gravity water and ψ = ψs; (b) with the redistribution, the sand pores are no longer full of gravity water since bubbles emerge inside the water and ψ increases from ψs to ψf; (c) after the gravity water is redistributed, the capillary water replaces the gravity water to become the main part of water in sand pores and ψψf; (d) in the extreme case, only film water is left and ψψf.

3.2 Differentiation of water and APU particles during penetration

Both the capillary force from water and the adhesive force from APU particles may contribute to the formation of a wet sand block, and it is hard to tell the difference when the block is wet. But the capillary force will vanish when water is expelled by drying. Therefore, the part with few or even no APU particles can be easily returned back to sander by sieving the dried block. And, in this way, we can tell the migration of APU particles from the migration of water in APUD.

In this part, ψw is still used to represent the migration of water in APUD. Referring to ψw, we brought in another index, migration efficiency denoted by ψa, to evaluate the movement of APU particles in sand. It is defined as the dry weight of sand stabilized by per unit volume of liquid as shown below:

 
image file: c6ra02764d-t2.tif(5)
where ψa is the migration efficiency in g mL−1, msa is the dry weight of sand stabilized, g, and Vl is the volume of the liquid in mL.

We plotted ψw and ψa of APUD-1 versus time in Fig. 5a. Both ψw and ψa initiate from 4.8 g mL−1 which is approximately the value of ψs, indicating that APU particles and water do not show a difference in movement during the infiltration process. This is ascribed to the excellent carrying capacity of gravity water, which composes the main part of the infiltration water. Fig. 5b is the microscopy picture of sand added with APUD, and the marked areas show various morphologies of APUD just like water.


image file: c6ra02764d-f5.tif
Fig. 5 (a) Migration of APUD-1 during the redistribution in sand described by the chart of ψt (16 °C, 6 L m−2). (b) Microscopy picture of the sand surface in the redistribution of APUD-1. The zone marked with 1 is saturated sand pores, the zone marked with 2 is grains connected by an APUD-1 capillary, and the zone marked with 3 is grain wetted by APUD-1.

With time going on, both ψw and ψa increase, but ψa increases slower than ψw. It means that differentiation emerges between the movements of water and APU particles during the redistribution process. Although the Brownian movement of water molecules is stronger than that of APU particles, it is not the main reason for the differentiation. That can be supported by the fact that ψa nearly does not change after 8 h while ψw keeps increasing for more than 24 h. Therefore, what plays a decisive role in the differentiation should be another factor, which we ascribed to the morphology change of water during the redistribution.

Water molecules can migrate through all the morphologies of pore water, including saturated gravity water, unsaturated gravity water, capillary water, or film water. But APU particles cannot, because the transporting ability of different water morphologies may vary a lot from powerful to none.

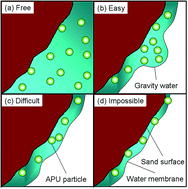
APU particles are generally hundreds of times bigger than water molecules, and their movement will be affected greatly by the space provided by water. Gravity water may either leave APU particles free to move in saturated sand as discussed above (illustrated in Fig. 6a), or expand its flowing channel to make APU particles easy to move in unsaturated sand (illustrated in Fig. 6b). But the film water, composed of hundreds of water molecule layers adsorbed by the sand surface, is near to one APU particle or less in thickness, and hard to extend in a normal direction. Therefore, it imposes a size restriction on APU particles. This restriction is amplified by the APU particles adsorbed in the passageway, and makes it more difficult (illustrated in Fig. 6c) or even impossible (illustrated in Fig. 6d) for APU particles to pass. Therefore, the movement of APU particles mainly follows the flow of gravity water and thicker water film. The termination time of the increase of ψa coincides with the vanishing of gravity water.


image file: c6ra02764d-f6.tif
Fig. 6 Four difficulty levels of the downward migration of APU particles depending on water morphologies: (a) free in saturated gravity water; (b) easy in unsaturated gravity water; (c) difficult in thick film water; (d) impossible in thin film water.

Compared with pure water, APUD provides a higher value of ψw. This means APU particles have an effect on improving water penetration. As we know, the adsorption capacity of the sand surface is the foundation to hold film water and capillary handing water. However, APU particles may also be adsorbed by the sand surface, and thus consume the adsorption capacity of sand to water molecules. Therefore, less water will be held as film water and capillary handing water, and more water will be free to go.

3.3 Effect of temperature on the migration

Temperature decides the activity of the thermal motion of water molecules, and thus further affects the Brownian movement of APU molecules. This may result in a depression of the migration of APUD in sand at a lower temperature. The migration of water, presented by ψw, is obviously depressed at 5 °C compared to its performance at 12 °C as shown in Fig. 7a, though there is no significant change between ψw at 12 °C and 16 °C. Compared to water, APU particles suffered more due to their larger volume and performed more sensitively to the change of temperature. As can be seen from Fig. 7b, ψa of APUD-1 increases less than its initial value when the temperature goes down from 16 °C to 12 °C, and even barely changes with time at 5 °C, which means APU particles almost stopped migrating in the redistribution.
image file: c6ra02764d-f7.tif
Fig. 7 Effect of temperature on the migration of APUD in sand: (a) the ψwt chart of APUD-1 at 5 °C, 12 °C and 16 °C; (b) the ψat chart of APUD-1 at 5 °C, 12 °C and 16 °C.

3.4 Effect of APU particle size on migration

Since the size restriction exists, the penetration of APUDs with different particle sizes should perform differently. Fig. 8 shows their performance. It can be seen that all the APUDs have the same ψ0, stating that APU particles in this range (35–226 nm) can migrate following the surrounding water molecules without restriction in the infiltration process.
image file: c6ra02764d-f8.tif
Fig. 8 Penetration behavior of APUDs with different particle size. ψ0 is the value of ψ after infiltration; ψa and ψw reflect the migration of APUDs after a 12 h redistribution (12 °C, 6 L m−2).

Though the smallest value of ψw is more than twice that of ψ0, the values show a significant drop with increasing APU particle size. This trend results from the influence of the size on the adsorption of water by the sand surface.

Theoretically, a bigger size means less specific surface area and less amount of bound water. However, at such a low concentration of 3%, its influence on increasing free water can be ignored. Therefore, the main reason for that trend can only be ascribed to the adsorption change on the sand surface. The sand surface generally shows negative charge and is repulsive to the same charged APU particles; thereby, the increasing negative zeta potential of APU particles with the increasing size will strengthen the repulsive force and reduce the adsorption of the particles. Once the adsorption of APU particles is weakened, the adsorption of water molecules is enhanced and more water will be restrained from penetration.

Like ψw, ψa also shows a dampened increment of ψ0 with the increasing particle size, but its increase is very limited. The migration of bigger APU particles is subdued more by the size restriction of film water. Below 100 nm, ψa increases about 40%; at about 118 nm, it increases about 35%; above 200 nm, only less than a 10% increment is achieved.

3.5 Effect of the concentration on migration

We also investigated the migration behavior of APUD-1 with different concentrations of 3%, 6%, 9%, 12%, and 15% at 12 °C. The result is shown in Fig. 9. As can be seen, both ψw and ψa decrease with the increasing concentration. The change of ψw results from the reduction of free water in promoted concentrations. As we know, the total water in APUD is composed of the bound water which is affiliated to APU particles, and the free water which is free to move. With the increasing concentration, not only the total water but also the ratio of free water in it is reduced, due to the promoted ratio of the bound water by the increased APU particle intensity. These two adverse factors lessen the amount of free water for penetration and result in the declining trend of ψw. The reduction of free water also affects the migration of APU particles, not in a direct way but through the reduction of gravity water which can transport APU particles. Therefore, the change of ψa does not display immediately like ψw, but shows when the difference in free water becomes too large.
image file: c6ra02764d-f9.tif
Fig. 9 APUD concentration effect on migration, with schematic diagrams illustrating the relationship between free water and the concentration (each square represents dispersion, the number of spheres indicates the concentration of the dispersion, and the part of the square unoccupied by the spheres is free water): the ψt chart of APUD-1(12 °C, 6 L m−2, 12 h).

Fig. 10 is the SEM pictures of the sand surface stabilized with different concentrations of APUD. In Fig. 10a, the sand in the control displays as loose sander, each grain has a clear outline. When the sand was treated with APUD of 2% as shown in Fig. 10b, it shows a packed surface, and although we confirm that it is the cured APU that connects the grains, we cannot see it in the adjacent grains and the outline of each grain is quite clear. With a higher concentration of APUD of 4% as shown in Fig. 10c, the cured APU becomes visible in the edges of the grains and bedims the outline of the grains. In Fig. 10d–f, the cured APU is even more visible with the increased APUD concentration from 6% to 10%. The morphology of the cured APU in sand coincides with the relationship between ψa and the concentration of APUD. Since ψa barely shows any increase with increasing concentration, more APU particles will stay in the adhered sand to stack in the pores, and this makes the cured APU more and more visible.


image file: c6ra02764d-f10.tif
Fig. 10 SEM pictures of sand stabilized with different concentrations of APUD: (a) 0%; (b) 2%; (c) 4%; (d) 6%; (e) 8%; (f) 10%.

3.6 Thickness formulation of the CSS crust

Based on the results and discussion above, we deduced a semi-empirical formula for the thickness of the CSS crust, by equating it to the depth that APU particles reach.

The depth that APU particles reach is denoted by H, and it consists of the depth of infiltration denoted by Hi, and the depth of redistribution denoted by Hr, as shown in eqn (6):

 
H = Hi + Hr (6)
in which H is the reaching depth of APU particles in cm, Hi is the reaching depth of APU particles after infiltration in cm, and Hr is the reaching depth of APU particles after redistribution in cm.

The sand after infiltration is treated as saturated, and the volume of infiltrated APUD can be expressed as follows:

 
V = Hi × S × e (7)
where V is the volume of APUD sprayed on sand in L, S is the sprayed area of sand in m2, and e is the porosity of sand in %. As we know, V is also expressed as:
 
V = Q × S (8)
in which Q is the amount of liquid per unit area of sprayed sand in L m−2. Then eqn (7) and (8) can be coupled and Hi is expressed as:
 
image file: c6ra02764d-t3.tif(9)

Bringing eqn (9) into eqn (6), H is expressed as:

 
image file: c6ra02764d-t4.tif(10)

If we express Hr with Hi as following:

 
Hr = aHi (11)
where a is the ratio coefficient of Hr to Hi, it is relevant to the properties of APU, and normally ranges from 0 to 1. Then H can be expressed as a function of Q, e, and a:
 
image file: c6ra02764d-t5.tif(12)

Eqn (12) combines influences from sand, water, and sand stabilizing material. It can be used to evaluate the amount of material needed to get a given value of crust thickness, or the crust thickness achieved by a given amount of material.

4 Conclusions

Overall, this study reveals the migration behavior of APUD during the infiltration and redistribution in sand, by using a newly founded method. It is stated that the APU particles move together with water in the infiltration process, but migrate behind water in the redistribution process and terminate much earlier than water. This is ascribed to the water morphology deduction in sand, which was set up as four difficulty levels for APU particles to migrate inside as illustrated. Gravity water is found to be the main carrier of the transport of APU particles, while film water shows a strict size restriction, which results in the lagging of APU particles behind water in redistribution. This restriction may be amplified at lower temperature or due to APU particles of larger size. Besides, the adsorption of APU particles on the sand surface may reduce the adsorption of water and result in acceleration of water penetration. A semi-empirical formula for the thickness of the CSS crust is deduced concerning all three participants of sand, water, and the stabilizing material, which is instructive for application and material design. Considering the simplified experimental conditions like evaporation, steam movement in sand, and the volume shrinkage of moistened sand, further investigations need to be taken in the future. However, this study not only helps to get a better understanding of CSS, it also gives a view on the movements of particles at larger sizes of tens to hundreds of nm in porous systems, which will raise attention with the development of applications of polymer dispersion in soil.

References

  1. T. Wang, Z. Zhu and W. Wu, Sci. China, Ser. D: Earth Sci., 2002, 45, 23–34 CrossRef.
  2. J. Hill, M. Stellmes, T. Udelhoven, A. Röder and S. Sommer, Global Planet. Change, 2008, 64, 146–157 CrossRef.
  3. S. Cao, Environ. Sci. Technol., 2008, 42, 1826–1831 CrossRef CAS PubMed.
  4. R. Becerril-Piña, C. A. Mastachi-Loza, E. González-Sosa, C. Díaz-Delgado and K. M. Bâ, Journal of Arid Environments, 2015, 120, 4–13 CrossRef.
  5. L. C. Stringer, J. C. Dyer, M. S. Reed, A. J. Dougill, C. Twyman and D. Mkwambisi, Environ. Sci. Policy, 2009, 12, 748–765 CrossRef.
  6. J. Duan, E. Litwiller, S.-H. Choi and I. Pinnau, J. Membr. Sci., 2014, 453, 463–470 CrossRef CAS.
  7. X. Li, H. Xiao, M. He and J. Zhang, Ecol. Eng., 2006, 28, 149–157 CrossRef.
  8. X. Li, Catena, 2003, 52, 105–127 CrossRef.
  9. G. Qiu, I.-B. Lee, H. Shimizu, Y. Gao and G. Ding, Journal of Arid Environments, 2004, 56, 449–464 CrossRef.
  10. T. Zhang, H. Zhao, S. Li, F. Li, Y. Shirato, T. Ohkuro and I. Taniyama, Journal of Arid Environments, 2004, 58, 203–214 CrossRef.
  11. Y. Li, J. Cui, T. Zhang, T. Okuro and S. Drake, Ecol. Eng., 2009, 35, 118–127 CrossRef.
  12. Y.-X. Zang, W. Gong, H. Xie, B.-L. Liu and H.-L. Chen, Environ. Technol. Rev., 2015, 4, 119–132 CrossRef.
  13. S. A. Aiban, Eng. Geol., 1994, 38, 65–79 CrossRef.
  14. K. Granat, D. Nowak, M. Pigiel, M. Stachowicz and R. Wikiera, Arch. Foundry Eng., 2007, 7, 79–82 CAS.
  15. A. Mitchell, Int. J. Biometeorol., 1974, 18, 168–173 CrossRef.
  16. Z. Han, T. Wang, Z. Dong, Y. Hu and Z. Yao, Journal of Arid Environments, 2007, 68, 260–270 CrossRef.
  17. X. Meng, G. Peng, B. Liu, B. Wang, H. Chen, R. Luo, Z. Dong, Y. Li, B. Zhang and L. Luo, Polym.-Plast. Technol. Eng., 2013, 52, 931–939 CrossRef CAS.
  18. K. Yang, Z. Tang, Z. Zhao, J. Feng, P. Guo and T. Ding, Trans. Chin. Soc. Agric. Eng., 2012, 28, 54–59 Search PubMed.
  19. A. R. Zandieh and S. S. Yasrobi, Geotech Geol Eng, 2010, 28, 139–145 CrossRef.
  20. C. Zhang, Y. Xia, R. Chen, S. Huh, P. A. Johnston and M. R. Kessler, Green Chem., 2013, 15, 1477–1484 RSC.
  21. Z. Wu, K. Iwashita, Z. Wu and H. Inagaki, J. Soc. Mater. Sci., Jpn., 2011, 60, 554–559 CrossRef.
  22. J. Liu, B. Shi, K. Gu, H. Jiang and H. I. Inyang, Bull. Assoc. Int. Geol. Ing. Environ., 2012, 71, 537–544 CrossRef CAS.
  23. R. Chen, C. Zhang and M. R. Kessler, RSC Adv., 2014, 4, 35476–35483 RSC.
  24. J. Yang, H. Cao, F. Wang and T. Tan, Environ. Pollut., 2007, 150, 381–384 CrossRef CAS PubMed.
  25. K. Beven and P. Germann, Water Resour. Res., 2013, 49, 3071–3092 CrossRef.
  26. Z. Wu, W. Gao, Z. Wu, K. Iwashita and C. Yang, J. Soc. Mater. Sci., Jpn., 2011, 60, 674–679 CrossRef CAS.
  27. Z. Han, Y. Hu, G. Chen, Z. Yao and G. Shao, J. Environ. Sci., 2000, 21, 86–88 Search PubMed.
  28. N. Jarvis, Eur. J. Soil Sci., 2007, 58, 523–546 CrossRef.
  29. A. Sepaskhah and A. Bazrafshan-Jahromi, Biosystems Eng., 2006, 93, 469–474 CrossRef.
  30. T. Trout, R. Sojka and R. Lentz, Trans. ASAE, 1995, 38, 761–765 CrossRef.
  31. V. S. Green, D. Stott, L. Norton and J. Graveel, Soil Sci. Soc. Am. J., 2000, 64, 1786–1791 CrossRef CAS.
  32. H. A. Ajwa and T. J. Trout, Soil Sci. Soc. Am. J., 2006, 70, 643–650 CrossRef CAS.
  33. H.-q. Dou, T.-c. Han, X.-n. Gong and J. Zhang, Eng. Geol., 2014, 183, 1–13 CrossRef.
  34. G. Weimin, W. Zhiren and W. Zhishen, J. Environ. Prot., 2012, 3, 1025–1033 CrossRef.
  35. K. Yang and Z. Tang, Water, Air, Soil Pollut., 2012, 223, 4065–4074 CrossRef CAS.

This journal is © The Royal Society of Chemistry 2016