DOI:
10.1039/C6RA02717B
(Paper)
RSC Adv., 2016,
6, 39080-39094
Antimicrobial and fluorescence finishing of woolen yarn with Terminalia arjuna natural dye as an ecofriendly substitute to synthetic antibacterial agents†
Received
29th January 2016
, Accepted 12th April 2016
First published on 14th April 2016
Abstract
The current study deals with the use of Terminalia arjuna natural dye as an ecofriendly finishing agent for producing highly functional antimicrobial and fluorescent woolen yarn along with the evaluation of kinetic and thermodynamic adsorption characteristics. The effect of pH on the adsorption was investigated, showing an increase in adsorption capacity with decreasing pH over the range of 2–9, with maximum adsorption at pH 3.5. Two kinetic equations pseudo-first order and pseudo-second order were employed for determining adsorption rates. The pseudo-second order equation provided the best fit to experimental data with an activation energy of 105.58 kJ mol−1, indicating chemisorption. The equilibrium adsorption data was fitted to Langmuir, Freundlich and Redlich–Peterson adsorption isotherms. The adsorption behavior accorded with the Redlich–Peterson isotherm with exceptionally high regression coefficients for dyeing temperatures of 50, 70 and 90 °C with dye concentration varying from 0.5–10% (o.w.f). Comparative results of the colorimetric properties (CIEL*a*b* and K/S) using a spectrophotometer under D65 illuminant (10° standard observer) and color fastness (light, wash, and rub) of dyed woolen yarns were studied to quantify the effect of metal mordants. The antimicrobial potential of Terminalia arjuna solution and dyed woolen yarn were assessed in terms of percentage inhibition of bacterial growth against a wide variety of bacterial strains, showing more than 85% inhibition. Reduction in antimicrobial activity of dyed woolen yarn was observed with mordanted samples, however they were found to retain more antimicrobial activity as compared to unmordanted samples as a function of successive washing cycles. The chemical nature of different mordants and wool–mordant–dye complex forming ability were found to have significant impact on the colorimetric and fluorescence characteristics of dyed woolen yarn.
1. Introduction
Multifunctional textiles and polymers have been receiving increased attention over the last few decades due to varied health benefits regarding their uses in textile, medical, engineering, pharmaceutical, agricultural, and food industries. The sustainable and environment friendly bioresource materials produced mainly from non-food crops have revolutionized all industrial sectors particularly the textile industry.1,2 Natural textile materials like wool and cotton are prone to deterioration caused by mildew and bacteria resulting in discoloration, objectionable odor, dermal infection, product deterioration, allergic responses and other related diseases as they provide basic requirements for growth and multiplication of growing microorganisms.3,4 Functionalization of textile materials with different antibacterial finishing agents in order to get technical textiles are gaining popularity all over the world as they provide consumers with greater comfort, remain fresh and odor free in everyday use.5 Active barrier antimicrobial technology may be an effective strategy for preventing cross contamination by reducing the load of infectious microorganisms on the surface of healthcare apparel.6
In this regard, rapid development of health, safety, ecology, and environmental legislations led to a dynamic increase in the production of technical textiles like sutures, bandages, specialized wound dressings, gauze, masks and surgical gowns.7–9 Because of the toxic and non-biodegradable nature of synthetic antibacterial agents such as triclosan, metals and their salts, organometallics, phenols, etc., textile industry is looking for eco-friendly substitutes such as chitosan, chitosan derivatives, nanoparticles, nano-composite finishing and antimicrobial natural dyes that can eliminate environmental risks posed by synthetic ones.10–14 Environmental concerns, including the health hazard, associated with the use of biocide and biostatic antimicrobial finishing agents for textile fibers were indicated in several regulatory measures.15 Using antimicrobial dyes in textile industry integrates the dyeing and finishing processes resulting in more efficient technique in terms of less water and energy usage.
Unlike the synthetic dyes, natural colorants are thought to be safe because of their non-toxic, non-carcinogenic and bio-degradable nature.5 Natural dyes having other preferable properties such as insect repellent,16 deodorizing,17 flame retardant,18 UV protection,19,20 fluorescence21,22 and antimicrobial activity23–25 besides being bio-compatible, bio-degradable, renewable, and non-toxic, are gaining popularity all around the world for producing more appealing and highly functional value-added textiles. This is the result of the stringent ecological standards imposed by many countries in response to toxic and allergic reactions associated with synthetic dyes especially benzidine and azo compounds.26 Recently several investigations have been undertaken on the dyeing of textile materials using various functional finishing agents along with the evaluations of thermodynamics and kinetic parameters for improving dyeing performance of natural dyes.22,27–30 Dyeing of textile materials with natural colorants/dyes is a promising field of research which needs to be explored systematically and scientifically for producing diversified smart textiles.
Terminalia arjuna (Arjun), a well-known ayurvedic cardioactive drug, indigenous to Indian Peninsula abundantly found in Sub-Himalayan tract, is a rich source of polyphenols (60–70%) including flavones, flavonols, tannins (20–24%), and used medicinally as tonic.31,32 The oleanane triterpenes arjunic acid, arjungenin and their glucosides, arjunetin and arjunglucoside II, have been isolated from the bark of plant as primary constituents.32 The main coloring components are baicalein and ellagic acid, structures given in Fig. 1.33,34
|
| Fig. 1 Structures of main coloring components of T. arjuna. | |
Bark of T. arjuna has been used in traditional system of medicine as cardiotonics for the treatment of various cardiovascular disorders.32,35,36
So, the aim of present research is to explore the potential of T. arjuna in the development of highly antimicrobial and fluorescent textile material along with basic understanding of thermodynamic and kinetic aspects of dyeing. Fastness properties of dyed woolen yarn samples were assessed with respect to light, washing, and rubbing. Colorimetric (CIEL*a*b* and K/S values) and emission properties of dyed woolen yarn were also recorded. Different metal salts (ferrous sulfate, stannous chloride, alum and magnesium sulfate) have been used to improve the color characteristics and antimicrobial finishing of woolen yarn as many heavy metals and their salts have been used in recent past with excellent antimicrobial finish.25,37–40 In near future these materials are promising candidates for applications in the biomedical field as sutures, bandages, scaffolds, wound dressing, masks and surgical gowns.
2. Experimental
2.1. Materials
100% pure New Zealand semi worsted woolen yarn (60 counts) was procured from MAMB Woollens Ltd. Bhadohi, India. Powdered extract of T. arjuna dye was purchased from Sir Biotech India Ltd. Kanpur, (U.P.) India and used as such without further purification. Metallic salt mordants, ferrous sulfate (FeSO4·5H2O), stannous chloride (SnCl2·2H2O), potash alum (K2Al2(SO4)4·24H2O) and magnesium sulfate (MgSO4·5H2O), used for mordanting were of laboratory grade.
For antimicrobial testing, four different bacterial strains namely Staphylococcus aureus subsp. aureus (MTCC 902), Pseudomonas aeruginosa (MTCC 2453), Escherichia coli (MTCC 443), and Bacillus subtilis (MTCC 736) were selected due to their popularity and suitability of being selected as test organisms.
2.2. Instruments
UV-visible spectrophotometer (T80 + UV/Vis Spectrometer, PG Instruments Ltd.) was employed for recording the absorbances and electronic spectra of dye solutions. A pH/mV Meter (BD 1011) from Decibel digital technologies was used for measuring pH of dye solutions.
2.3. Methods
2.3.1. Adsorption experiments.
2.3.1.1. Effect of pH on the adsorption of Terminalia arjuna extract onto woolen yarn. Woolen yarn samples were treated with 10% (o.w.f.) (on the weight of yarn/fabric) of T. arjuna extract at 90 °C for 60 min. The treatment solution was adjusted in the pH range of 2–9 by means of HCl and sodium bicarbonate solutions. The percentage dye uptake (%E) of T. arjuna dye onto the woolen yarn was calculated according to eqn (1). |
| (1) |
where, A0 and A1 are the absorbance at λmax 277 nm before dyeing and after dyeing, respectively.
2.3.1.2. Calculation of adsorption kinetics. The adsorption kinetics of T. arjuna natural dye (10% o.w.f.) onto woolen yarn was performed at pH 3.5, with M:L (material to liquor) ratio of 1:50, at 50, 70 and 90 °C for 180 min. The dye concentration qt (mg g−1 wool) on woolen yarn at time t min was calculated using eqn (2). |
| (2) |
where, C0 and Ct are initial dye concentration (g L−1) and dye concentration (g L−1) at dyeing time t respectively, V is the volume of dye solution (L), and W is the weight of woolen yarn (Kg).
2.3.1.3. Calculation of adsorption isotherms. The adsorption isotherms of T. arjuna dye on woolen yarn were investigated in a series of dye concentrations varying from 0.5–10% (o.w.f.) using M:L ratio of 1:50 at 50, 70 and 90 °C. The adsorption isotherms were determined for 180 min as previous tests showed that equilibrium adsorption was reached in 2–3 h. The amount of dye adsorbed per unit weight of woolen yarn at equilibrium qe (mg g−1 wool) was calculated using eqn (3). |
| (3) |
where, C0 is the initial dye concentration (g L−1), Ce is the equilibrium dye concentration (g L−1), V is the volume of dye solution (L), and W is the weight of wool yarn/fiber (kg).
2.3.2. Mordanting. Woolen yarns samples were mordanted by pre-mordanting method using alum (10% o.w.f.), ferrous sulfate (5% o.w.f), stannous chloride (1% o.w.f.) and magnesium sulphate (5% o.w.f.) as mordants. Before the application of mordants, woolen yarns were soaked in 5 mL L−1 non-ionic detergent (Safewash Wipro) as pretreatment to increase surface wettability. Pretreated woolen yarn samples were immersed in mordant solutions with M : L ratio of 1:50 at 90 °C for 45 min. Mordanted woolen yarn samples were thoroughly rinsed with tap water to remove superfluous mordants (unused).
2.3.3. Dyeing. Dyeing experiments were performed using M:L ratio of 1:50 in separate baths with manual agitation using 5% and 10% (o.w.f.) dye concentrations. Woolen yarns were drenched to dyeing baths containing warm dye solution (30 °C). Dye bath temperatures were gradually raised to 90 °C and maintained at that level for 60 min. Dyed samples were treated with 5 mL L−1 non-ionic detergent (Safewash Wipro), rinsed with tap water and dried in shade.
2.3.4. Colorimetric measurements.
2.3.4.1. Colour strength. The colorimetric properties of dyed woolen yarn samples were obtained with Gretag Macbeth Color-Eye 7000A° Spectrophotometer in terms of CIELab values (L*, a*, b*, c*, h°) and color strength (K/S). The color strength (K/S) in visible region of the spectrum (400–700) nm was calculated based on Kubelkae–Munk equation: |
| (4) |
where, (K) is adsorption coefficient, (R) is reflectance of dyed sample and (S) is scattering coefficient.
2.3.4.2. Colour fastness tests. The light fastness test of dyed woolen yarns were conducted on Digi light Nx™, as per test method AATCC 16e-1993 (2004) similar to ISO 105-B02:1994 (Amd.2:2000) and ratings were given on 1–8 grey scale. The wash fastness of dyed woolen yarn samples were measured in Digi wash SS™ (Launder-o-meter) as per the ISO 105-C06:1994 (2010) specifications. Samples were also assessed for staining on white adjacent fabrics (cotton and wool). Dry and wet rub fastness of dyed woolen yarn samples were tested using a Digi crock (Crockmeter) as per Indian standard IS 766:1988 (Reaffirmed 2004) based on ISO 105-X12:2001 by mounting the yarn/fabric on panel and giving ten strokes for both dry and wet rub fastness tests.
2.3.5. SEM analysis. Surface morphology of different woolen yarn samples before and after the application of mordants and dye was observed using LEO 435VP Scanning Electron Microscope at 10 kV accelerating voltage. Samples were glued to aluminum stubs with colloidal silver paint for conductivity and sputter coated with gold for 3 min in an argon atmosphere.
2.3.6. Antimicrobial activity of Terminalia arjuna in solution. Antimicrobial susceptibility tests were performed by recording percentage inhibition and zone of inhibition (ZOI) for bacterial isolates used in this study. For percent growth inhibition study, bacterial strains procured form MTCC, Chandigarh, India, were inoculated into their respective Luria Broth (LB) medium and grown overnight at 37 °C. Secondary cultures with 0.5 McFarland equivalent growths were diluted 100 times and 10 μL of cultures were used to inoculate 96 well microtiter plates containing test sample at varied concentrations. After an incubation of 12–14 h at 37 °C in an automated incubator shaker OD was measured at 595 nm. Luria Broth was taken as reference medium and ampicillin (100 mg mL−1) as control drug.Zone of inhibition studies were performed using same bacterial isolates by preparing lawns on Muller Hinton Agar plates. On to the spreaded plates 6 mm diameter wells were made using sterilized metal borer at appropriate distance and 10 μL of test sample with different concentration was inoculated. Para-film sealed plates were incubated at 37 °C for 12–14 h and inhibition zone diameter was measured in millimeter (mm).
2.3.7. Determination of antimicrobial activity on dyed woolen yarn. Antimicrobial efficacy of dyed woolen yarn was carried out using absorbance method by recording the optical density of incubated culture medium at 595 nm. Enhancement in microbial growth is directly proportional to turbidity and optical density, which are directly related to the number of microbial cells in media.3,5,24 Susceptibility test of microbial strains to dyed and mordanted woolen yarn were done by introducing 2.54 cm2 dyed yarn in 50 mL nutrient broth inoculated with desired microbe and incubated overnight at 37 °C in automated incubator shaker (Orbitek, Scigenics). A broth was inoculated similarly with distilled water as control.The reduction of microbial growth by dyed yarn was expressed as follows:
|
| (5) |
where
R = % reduction in microbial population;
B = absorbance of media inoculated with microbe and undyed yarn;
A = absorbance of media inoculated with microbe and dyed yarn.
2.3.8. Determination of durability of antimicrobial finishing to washing. Antimicrobial activity of dyed woolen yarn was further evaluated after being subjected to several washing cycles and durability of antimicrobial finish was calculated in terms of % retention of antimicrobial activity by using formula: |
| (6) |
where, Rn = % microbial reduction after n wash cycles and R0 = % microbial reduction before washing. One washing cycle corresponds to 45 min of continuous washing at 40 °C.In order to access durability of antimicrobial finish quantitatively, rate of antimicrobial reduction upon several laundering (washing) cycles and half life period of antimicrobial finish was determined through first-order and second-order kinetic models.
2.3.9. Fluorescence measurements. Fluorescent spectrometer F900, Edinburgh Instruments Ltd., integrated with UltraScan III spectroscopy software fitted with Xe900 Lamp having a spectral width of 1.0 cm−1 was used for performing site directed steady state fluorescence spectroscopy of dyed woolen yarn mounted on rectangular solid support under excitation wavelength of 277 nm. The fluorescence was recorded at temperature of 25 ± 0.61 °C with dwell time of 0.50 s.
2.3.10. Rate of fluorescence fading of dyed woolen yarn. Durability of fluorescence finish on washing and exposure to UV radiation from Xenon Lamp of 254 nm wavelength were conducted by measuring the fluorescence emission intensities of dyed woolen yarn at different time intervals.The rate of first-order decay of fluorescence can be expressed as41
|
| (7) |
where,
F0 and
Ft refer to the fluorescent emission intensities measured initially and at
t min;
K1 is first order rate constant.
Second-order decay of fluorescence emission intensity can be expressed by the following expression:
|
| (8) |
where,
F0 and
Ft refer to the fluorescent emission intensities measured initially and at
t min;
K2 is second order rate constant.
3. Result and discussion
3.1. Determination of dye concentration
The absorbances as well as the absorbance spectra of T. arjuna dye solutions were measured with the UV-visible spectrophotometer (T80 + UV/Vis Spectrometer, PG Instruments Ltd.). From Fig. 2, it is clearly seen that Terminalia arjuna displayed a strong absorption band with peak value recorded at 277 nm. The concentrations of dye in the dye solutions were measured at λmax 277 nm based on Beer–Lambert law having a relation of y = 58.04x with regression coefficient (R2) of value of 0.996.
|
| Fig. 2 UV-visible spectrum of T. arjuna dye extract. | |
3.2. Effect of pH on the adsorption of T. arjuna extract onto woolen yarn
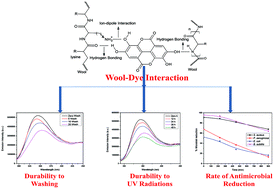
The effect of dye solution pH on the adsorption of T. arjuna extract onto woolen yarn with initial dye concentration of 10% (o.w.f) at 90 °C for 60 min, M:L ratio of 1:50 is shown in Fig. 3. The data presented in Fig. 3 indicates that the adsorption of dye onto woolen yarn has increased with decreasing pH in the range of 2–9 with maximum adsorption capacity (27.08%) at pH 3.5. This is mainly due to protonation of amino groups of wool under acidic conditions, which are beneficial for ion–dipole interactions with the hydroxyl group of T. arjuna chemical components while carboxylic groups are essentially unionised at lower pH values.28,30 Additionally, hydroxyl groups of baicalein and ellagic acid can form hydrogen bonding with the protonated amine functionalities of woolen yarn (Fig. 4). Decrease in dye exhaustion was observed at pH values lower than 3.5. The percentage dye exhaustion dropped to 15.19% at neutral pH, showing weak electrostatic interactions between woolen yarn functional groups and dye components. At pH values above than 8, some of the side chain hydroxyl groups (serine and tyrosine) present in wool fiber may also ionize, increasing the negative charge significantly.
|
| Fig. 3 Effect of pH on the adsorption of T. arjuna extract onto woolen yarn. | |
|
| Fig. 4 Schematic representation of the hydrogen bonding and ionic interaction. | |
The negative charges fibre surface repels the polyphenolic groups creating an unfavourable situation for the adsorption of dye components onto wool fiber.30 Moreover, results from the reflectance spectroscopy of dyed woolen yarn samples under different pH conditions shows same results of higher color strength values (K/S) at pH value of 3.5 (Fig. 5). The pH of dye solution in all adsorption and kinetic experiments was fixed at 3.5, adjusted with hydrochloric acid (HCl).
|
| Fig. 5 Color strength values of 10% T. arjuna dyed woolen yarn at different pH values. | |
3.3. Adsorption kinetics
The kinetic adsorption of T. arjuna onto woolen yarn was studied in order to evaluate the rate of adsorption and to design an appropriate adsorption system which control the mechanism of adsorption of 50, 70 and 90 °C and is illustrated in Fig. 6. Two kinetic equations, pseudo-first order and pseudo-second order equations were fitted to the experimental data using nonlinear least-squares fitting procedure for assessment of potential rate controlling steps of T. arjuna adsorption onto woolen yarn.
|
| Fig. 6 Adsorption kinetics of T. arjuna onto woolen yarn at different temperature. | |
For pseudo first-order kinetic the linearized rate equation is expressed as:
|
In(qe − qt) = lnqe − K1t
| (9) |
where,
qe (g kg
−1) and
qt (g kg
−1) are the amount of absorbed dye onto wool at equilibrium and at time
t, respectively. The
K1 (min
−1) is the adsorption rate constant of pseudo first-order.
The integrated pseudo-second order rate equation is expressed as follows:
|
| (10) |
where,
K2 (kg g
−1 min
−1) is the equilibrium rate constant of pseudo-second-order processes.
In contrast to pseudo-first order model, pseudo-second order model fitted the experimental adsorption data well, with high regression coefficient (Table 1) giving an indication that the rate limiting step for this adsorption process may be chemisorption. The suitability and fitness of pseudo-second-order model for interpreting kinetic profile of T. arjuna adsorption onto woolen yarn was further confirmed by linear relation of rate constant as a function of increasing temperature. The straight lines in the plots of t/qt verses t at different temperatures shows exceptionally high regression coefficients indicating adequate fitting of adsorption data (Fig. 7). The slopes and intercepts of plots of t/qt verses t were used to determine the equilibrium adsorption amount qe,cal and the pseudo second-order rate constant K2, listed in Table 1. With increasing temperature from 50 °C to 90 °C, rate constant decreases giving an indication of exothermic nature of adsorption process. From the experimental results presented in Table 1, adsorption capacity of woolen yarn was found to reduce from 0.161 g kg−1 to 0.156 g kg−1 with increasing temperature from 50 °C to 70 °C. Further increase in temperature from 70 °C to 90 °C, increasing adsorption capacity from 0.156 g kg−1 to 0.167 g kg−1.
Table 1 Kinetic parameters for the adsorption of T. arjuna dye onto woolen yarn
Pseudo-first order model |
Pseudo-second order model |
Initial dye conc. % (o.w.f) |
Temp. (K) |
qe,cal (g kg−1) |
R2 |
K1 (min−1) |
qe,cal (g kg−1) |
R2 |
K2 (kg g−1 min−1) |
Ea (kJ mol−1) |
R2 |
10 |
323 |
6.29 |
0.974 |
0.030 |
0.161 |
0.998 |
0.231 |
105.58 |
0.998 |
343 |
6.36 |
0.971 |
0.029 |
0.156 |
0.991 |
0.23105 |
363 |
6.17 |
0.978 |
0.030 |
0.167 |
0.998 |
0.230 |
|
| Fig. 7 Plot of the pseudo second-order equation at different temperature. | |
This may be attributed to the weakening of hydrogen bonds and van der Waal's forces of attractions between adsorbed dye and woolen yarn with increasing temperature. Further increase in temperature increases adsorption capacity due to increasing kinetic energy of dye molecules and higher extent of wool swelling.
3.4. Activation parameters
Pseudo-second order rate constant at different temperatures were used to determine apparent activation energy of adsorption using Arrhenius equation: |
| (11) |
where Ea (kJ mol−1), R, T (K) and A are the Arrhenius activation energy, gas constant, absolute temperature and the Arrhenius factor, respectively.
Activation energy (Ea) can be calculated from the slope of straight line of lnK2 verses 1/T (R2 = 0.997). The activation energy was found to be 105.58 kJ mol−1, indicating nature of adsorption of T. arjuna onto woolen yarn is chemisorption which offers the evidence in support of pseudo second-order equation.
3.5. Adsorption isotherms
The fitting of equilibrium adsorption data to various experimental isotherm models is an important step in establishing the most appropriate model for designing of dye adsorption onto wool system. So, the equilibrium adsorption data of T. arjuna onto woolen yarn was fitted to Langmuir, Freundlich and Redlich–Peterson isotherm models.
The linear expression of Langmuir isotherm is as follows:
|
| (12) |
where,
Ce (g L
−1) and
qe (g kg
−1) are the concentrations of dye in the solution and on wool at equilibrium, respectively;
qm is the amount of dye at complete monolayer coverage (g kg
−1) and gives the maximum adsorption capacity of wool fiber, and
KL (L g
−1) is the Langmuir isotherm constant which is related to the energy of adsorption.
Another isotherm is Freundlich isotherm model, suitable for heterogeneous surface systems and expressed as:
|
| (13) |
The constants KF and 1/n are Freundlich constants denoting the appropriate indicator of the adsorption capacity and intensity of adsorption, respectively.
The linear form of Redlich–Peterson isotherm is represented:
|
| (14) |
where,
KR (L g
−1) and
aR (L g
−1) are Redlich–Peterson constants, and
β is an exponent in the range of 0–1.
To find the most appropriate model for the adsorption of T. arjuna onto woolen yarn, all the adsorption isotherms were fitted to experimental data at all temperatures using non-linear least square analysis. By comparing correlation coefficients of all fitted curves, it was concluded that Redlich–Peterson isotherm model gave the best fit to experimental data; where as other isotherm models did not gave the best fit to experimental data (Table 2, Fig. 8). Redlich–Peterson isotherm adsorption mechanism is a hybrid of Langmuir and Freundlich isotherm model and does not form an ideal monolayer adsorption. It approaches to Freundlich isotherm model at high concentration (as the exponent β tends to zero) and is in accordance with the low concentration limit of the ideal Langmuir condition (as the β values are all close to one).42,43
Table 2 Thermodynamic parameters for the adsorption of T. arjuna dye onto woolen yarn
Initial dye conc. % (o.w.f) = 10% |
Temperature (K) |
323 |
343 |
363 |
Langmuir model |
qm (g kg−1 wool) |
1.99 × 10⁻⁵ |
1.54 × 10⁻⁵ |
1.77 × 10⁻⁵ |
KL (L g−1) |
152.07 |
130.03 |
129.87 |
R2 |
0.96 |
0.97 |
0.96 |
Freundlich model |
Kf (g kg−1 wool) |
51.93 |
131.63 |
96.54 |
n |
0.035 |
0.031 |
0.032 |
R2 |
0.98 |
0.98 |
0.98 |
Redlich–Peterson model |
KR (10−3 L g−1) |
159 |
169 |
169 |
aR (10−3 L g−1) |
0.217 |
0.238 |
0.193 |
KR/aR (g kg−1) |
731.24 |
708.74 |
875.48 |
β |
0.501 |
0.525 |
0.530 |
R2 |
0.99 |
0.99 |
0.99 |
|
| Fig. 8 Redlich–Peterson isotherm of T. arjuna dye onto wool at different temperatures. | |
Forces of attraction responsible for the adsorption of dye onto woolen yarn are ion–ion forces of attraction operating between hydroxyl groups of dye components and protonated amino groups under acidic conditions.20,30 Also, hydrogen bonding and van der Wall's forces contributes much to the adsorption of T. arjuna onto woolen yarn (Fig. 4). Isotherm parameters for Redlich–Peterson model from curve fittings at all temperatures is given in Table 2. Redlich–Peterson constant aR first increases and then decreases where as KR first increases and then remains constant with increase in temperature from 50 °C to 90 °C in contrary to β which increases with increase in temperature. Equilibrium monolayer absorption (KR/aR) follows the reverse trend as that of aR with exceptionally high value at 90 °C.
3.6. Colorimetric properties
Table 3 displays CIEL*a*b* and CIEL*c*h° values of T. arjuna dyed woolen yarn. Application of T. arjuna extract on woolen yarn produced shades lying in the yellow-red coordinate of color space diagram with high lightness (L*) and low chroma (c*) values, indicating light and bright yellow shades of hue angle ranging between 48° to 62°.
Table 3 CIELab values of woolen yarn dyed with T. arjuna
Dye (T. arjuna) |
Mordant |
L* |
a* |
b* |
c* |
h° |
% E |
5% |
Unmordanted |
54.93 |
7.82 |
12.26 |
14.54 |
57.47 |
15.07 |
5% iron |
59.70 |
7.09 |
13.01 |
14.81 |
61.41 |
18.97 |
1% tin |
59.52 |
9.05 |
14.01 |
16.68 |
57.14 |
23.17 |
10% alum |
46.52 |
11.00 |
14.47 |
18.17 |
52.75 |
46.80 |
5% magnesium |
60.98 |
8.79 |
14.23 |
16.72 |
58.29 |
15.75 |
10% |
Unmordanted |
52.22 |
8.56 |
12.86 |
15.45 |
56.35 |
30.30 |
5% iron |
57.72 |
7.69 |
13.38 |
15.43 |
60.11 |
48.95 |
1% tin |
56.10 |
9.34 |
14.69 |
17.41 |
57.55 |
62.84 |
10% alum |
36.81 |
10.43 |
11.98 |
15.88 |
48.95 |
69.09 |
5% magnesium |
56.98 |
8.96 |
14.20 |
16.79 |
57.75 |
38.53 |
From a*–b* plot (Fig. 9), it is evident that mordanting have little effect on colorimetric properties as marginal changes were observed in L*, a*, b*, c* and ho values for mordanted samples in comparison to unmordanted ones. 5% (o.w.f.) iron mordanted samples have shifted towards yellow zone of color space diagram. Fig. 10 represents color strength (K/S) values for all samples dyed with 5% and 10% (o.w.f.) dye concentration. Alum mordanted samples show intense color depth as compared to unmordanted ones having more pronouncing effect at higher dye concentration. The mordant activity sequence was found to be alum > SnCl2 > FeSO4 > MgSO4 > control. Metal mordants especially d-block elements have coordination complex forming ability and therefore readily chelate with the dye molecules forming ternary complexes eventually resulting in higher color strength values.24,44
|
| Fig. 9 a*–b* plot of dyed woolen yarn. | |
|
| Fig. 10 Effect of mordants on the color strength (K/S) of T. arjuna dyed woolen yarn. | |
3.7. Fastness properties
Table 4 represents fastness properties of woolen yarn samples dyed with 10% (o.w.f.) T. arjuna. In the color fastness test to artificial UV light, it was found that there is no difference in light fastness values of unmordanted and mordanted dyed samples. All mordanted as well as unmordanted samples show very good light fastness rating of 5.
Table 4 Fastness properties of wool dyed with T. arjunaa
Dye (T. arjuna) |
Mordant |
Light fastness |
Wash fastness |
Rub fastness |
c.c. |
c.s. |
c.w. |
Dry |
Wet |
c.c. = colour change, c.s. = colour staining of cotton, c.w. = colour staining of wool, wt% of mordant and dye raw material is taken with respect to o.w.f. (i.e., 50 g). |
5% |
Unmordanted |
5 |
4 |
5 |
5 |
4–5 |
4 |
5% iron |
5 |
4–5 |
5 |
5 |
5 |
4–5 |
1% tin |
5 |
4–5 |
5 |
5 |
5 |
4–5 |
10% alum |
5 |
4–5 |
5 |
5 |
5 |
4–5 |
5% magnesium |
5 |
4–5 |
5 |
5 |
5 |
4–5 |
10% |
Unmordanted |
5 |
4 |
5 |
5 |
4–5 |
4–5 |
5% iron |
5 |
4–5 |
5 |
5 |
5 |
4–5 |
1% tin |
5 |
4–5 |
5 |
5 |
5 |
4–5 |
10% alum |
5 |
4–5 |
5 |
5 |
5 |
4–5 |
5% magnesium |
5 |
4–5 |
5 |
5 |
5 |
4–5 |
Wash fastness tests of dyed woolen yarns for unmordanted and mordanted samples were performed and showed good to very good wash fastness ratings of 4–5 on grey scale. T. arjuna show color change and staining of 4–5 on adjacent cotton and wool fabrics.
For dry rubbing fastness, there was no considerable difference in results when dyed wool yarns mordanted with different mordants; however, mordanted woolen yarn samples showed better rub fastness of 5 as compared to un-mordanted ones (4–5). However, dry rub fastness values (5) were found to be relatively better than wet rub fastness values (4–5). Rub fastness data indicate that mordanting have increased resistance of transfer of color to adjacent fabrics.
3.8. Surface morphology of woolen yarn
The surface morphological features of undyed, mordanted and dyed woolen yarn samples are shown in Fig. 11. SEM images of native wool fiber show normal surface morphology (Fig. 11a). It can be clearly seen that mordanting and dyeing processes does not alter surface morphology of woolen yarn. However, images of mordanted woolen yarn samples reveals coarser surfaces due to deposition of well dispersed metal particles with little aggregation (Fig. 11b–e). Fig. 11f shows that unmordanted woolen yarn dyed with 10% (o.w.f.) T. arjuna showed deposition of dye molecules on its surface.
|
| Fig. 11 SEM images of woolen yarn. | |
Surface morphology of mordanted dyed woolen yarn samples showed darkening effect due to the deposition of more dye molecules which clearly indicates role of metal ions in increasing color strength (coating) of dyed woolen yarn (Fig. 11g–j).
3.9. Antibacterial activity of T. arjuna extract
The procedure of antibacterial activity of T. arjuna dye extract was followed from previous literatures.23–25 Significant antibacterial activity was shown by T. arjuna dye solution when tested upon four different bacterial isolates; gram-positive (S. aureus and B. subtilis) and gram-negative bacteria (P. aeruginosa and E. coli). Antibacterial potential of T. arjuna dye extract was screened by recording percentage inhibition of bacterial growth and zone of inhibition in diameter (mm).
3.9.1. Percentage inhibition. Table 5 displays the results of percentage inhibition of bacterial growth with respect to standard antibacterial drug ampicillin. Inhibition patterns clearly indicate the potency of T. arjuna dye extract over all tested bacterial strains.
Table 5 Percentage inhibition and zone of inhibition (mm)
Microbe |
Percentage inhibition |
Zone of inhibition (mm) |
Ampicillin |
5 mg mL−1 |
10 mg mL−1 |
Ampicillin |
5 mg mL−1 |
10 mg mL−1 |
Bacillus subtilis (MTCC 736) |
100 |
85.00 |
100.00 |
16.0 |
9.0 |
10.0 |
E. coli (MTCC 443) |
100 |
46.21 |
53.68 |
15.0 |
8.0 |
9.0 |
Staphylococcus aureus subsp. aureus (MTCC 902) |
100 |
100.00 |
100.00 |
18.0 |
11.0 |
12.0 |
Pseudomonas aeruginosa (MTCC 2453) |
85 |
61.19 |
70.53 |
10.0 |
7.0 |
8.0 |
Increase in the concentration of dye extract from 5 mg mL−1 to 10 mg mL−1, increases percentage inhibition against all tested microbes showing linear relationship between dye concentration and antimicrobial activity.
With ample reports on antimicrobial activity of several other plants from the same family, modest information is available on antibacterial potential of T. arjuna.45–47 This antibacterial activity could be attributed to the high tannin content present in them with specific mechanism of action still unclear. However, it has been suggested non-specific interactions (hydrogen bonding and hydrophobic effects or reaction with sulfhydryl groups as well as by covalent bond formation) between tannins and proteins are responsible for loss of structural integration and functioning of bacterial cell wall proteins.48–50
Different antimicrobial agents have different inactivation threshold levels for different types of microbes. Importantly, it has been observed that gram positive bacteria were more susceptible to antimicrobial agent T. arjuna as compared to gram negative bacteria with maximum inhibition seen in Bacillus subtilis (MTCC 736) and Staphylococcus aureus subsp. aureus (MTCC 902). These findings can be explained by different cell wall components present in these bacteria. Gram-negative bacteria possess an outer phospholipidic membrane with highly negative charged structural lipopolysaccharide components which acts as extra barrier for entry of polyphenolics bioactive components.51,52
3.9.2. Disc diffusion assay. Fig. 12 shows antimicrobial activity of impregnated dye solutions with different concentrations of T. arjuna dye compared to standard antimicrobial drug ampicillin through agar diffusion assay.
|
| Fig. 12 Disc diffusion assay of different bacterial strains. | |
Dye solutions impregnated in disk paper placed on the bacteria-inoculated surfaces killed most of the bacteria under and around them, generating clear and distinct zones of inhibitions (ZOI) with maximum activity against Staphylococcus aureus subsp. aureus. The results of diffusion assay are given in Table 5 in terms of diameter of zone of inhibition (mm). Diameter of zone of inhibition was found to increase with increasing dye concentration from 5 mg mL−1 to 10 mg mL−1, showing a linear relationship in concordance with percentage growth inhibition that may be attributed to the availability of more tannin content of dye to interact with bacterial cell wall components.
3.10. Antimicrobial activity of T. arjuna dyed woolen yarn
Antibacterial action of T. arjuna dye after application on woolen yarn was investigated against all four tested microbes as quite satisfactory results were achieved in solution phase. For this reason 5% (o.w.f.) and 10% (o.w.f.) dye concentration were applied on woolen yarn for screening of antibacterial potential of T. arjuna dye. Woolen yarn samples were also pretreated with different ecofriendly metal salts within the range of ecologically permitted concentration levels, as natural dyes need mordants for enhancing their color characteristic properties.37,38,44 Results of antibacterial activity of dyed woolen yarn have been summarized in Table 6. From the experimental results, T. arjuna dyed woolen yarn displayed encouraging results of antibacterial action against Escherichia coli (MTCC 443), Bacillus subtilis (MTCC 736), Staphylococcus aureus subsp. aureus (MTCC 902), and Pseudomonas aeruginosa (MTCC 2453), respectively and are presented in Fig. 13.
Table 6 Percentage microbial reduction of T. arjuna dyed woolen yarn
|
S. aureus |
P. aeruginosa |
E. coli |
B. subtilis |
Ampicillin (positive control) |
100 |
85 |
100 |
100 |
Untreated wool |
−0.3 |
−4.5 |
−1.4 |
−3.6 |
5% T. arjuna |
Un-mordanted |
87.48 |
59.44 |
32.86 |
91.43 |
5% FeSO4 |
85.91 |
45.80 |
25.13 |
89.69 |
1% SnCl2 |
84.78 |
38.29 |
20.89 |
88.86 |
10% alum |
83.76 |
29.54 |
19.69 |
88.19 |
5% MgSO4 |
86.70 |
53.73 |
26.06 |
90.93 |
10% T. arjuna |
Un-mordanted |
90.97 |
67.65 |
52.17 |
95.67 |
5% FeSO4 |
90.05 |
55.89 |
50.97 |
93.10 |
1% SnCl2 |
88.75 |
52.88 |
29.86 |
92.68 |
10% alum |
88.10 |
47.75 |
36.67 |
91.93 |
5% MgSO4 |
90.59 |
57.52 |
51.08 |
93.84 |
|
| Fig. 13 Antimicrobial activity of the woolen yarn dyed with T. arjuna. | |
Comparing antimicrobial results on wide range of shades obtained with un-mordanted as well as mordanted samples, highest activity was observed in case of un-mordanted samples followed by different metal mordanted samples. The activity sequence of mordanted samples was unmordanted > MgSO4 > FeSO4 > SnCl2 > alum against for all tested microbes. Decrease in antimicrobial activity of mordanted woolen yarn can be explained through the interaction developed between functional groups (hydroxyl) of dye color components (ellagic acid) and metal ions (Fig. 4), resulting in low microbial–tannin interaction.23,25,53 Among the bacterial isolates highest activity of dyed woolen yarn was shown against B. subtilis followed by S. aureus, E. coli and P. aeruginosa.
3.11. Durability of antimicrobial finish to washing
Durability of antimicrobial finish on textile materials is of real concern with regard to the leaching of antimicrobial agents upon repeated and frequent laundering cycles. Antibacterial activity imparted to woolen yarn by T. arjuna dye extract was found semi-durable to washing against all tested microbes. Durability of antimicrobial finish to washing treatments was tested against 5, 10 and 20 washing cycles, results shown in Table 7. It was found that mordanted samples retain more antimicrobial activity as compared to unmordanted samples. The results of the loss of antimicrobial activity on repeated washing cycles showed that there is higher leaching of dye molecules from the unmordanted fibers as compared to mordanted ones (Table 7). This can be explained on the basis of increasing interaction (chelating ability)44 between metal ions and chromophores of dye molecules which decreases the leaching of dye molecules on repeated washing cycles. Retention of antimicrobial activity as a function of repeated washing cycles follows the order: alum > SnCl2 > FeSO4 > MgSO4 > unmordanted woolen yarn, which is in direct correlation with increased dye exhaustion rates and increased interactions developed after mordanting process. Above results clearly indicates the role of metal ions in retaining the antimicrobial activity on repeated washing cycles, more details given in ESI.†
Table 7 Washing durability of antimicrobial finish of T. arjuna dyed woolen yarn
Microbe |
10% T. arjuna woolen yarn |
% Microbial reduction |
0 |
5 |
10 |
20 |
|
Un-mordanted |
90.97 |
88.58 |
81.43 |
67.76 |
Staphylococcus aureus subsp. aureus (MTCC 902) |
5% FeSO4 |
90.05 |
86.83 |
78.95 |
52.88 |
1% SnCl2 |
88.75 |
86.59 |
78.08 |
49.94 |
10% alum |
88.10 |
84.58 |
76.79 |
41.58 |
5% MgSO4 |
90.59 |
87.89 |
79.59 |
54.12 |
|
Un-mordanted |
67.65 |
51.04 |
36.62 |
13.21 |
Pseudomonas aeruginosa (MTCC 2453) |
5% FeSO4 |
55.89 |
48.88 |
29.36 |
11.79 |
1% SnCl2 |
52.88 |
43.07 |
32.27 |
9.10 |
10% alum |
47.75 |
34.71 |
24.44 |
8.82 |
5% MgSO4 |
57.52 |
50.33 |
35.84 |
12.29 |
E. coli (MTCC 443) |
Un-mordanted |
52.17 |
44.50 |
27.74 |
16.53 |
|
5% FeSO4 |
50.97 |
26.55 |
24.21 |
13.05 |
1% SnCl2 |
29.86 |
19.36 |
18.87 |
12.29 |
10% alum |
36.67 |
15.39 |
12.84 |
12.24 |
5% MgSO4 |
51.08 |
35.25 |
26.38 |
14.90 |
Bacillus subtilis (MTCC 736) |
Un-mordanted |
95.67 |
93.68 |
83.12 |
64.00 |
|
5% FeSO4 |
93.10 |
91.43 |
75.39 |
58.85 |
1% SnCl2 |
92.68 |
89.77 |
74.06 |
56.85 |
10% alum |
91.93 |
88.11 |
63.92 |
50.95 |
5% MgSO4 |
93.84 |
92.76 |
78.71 |
61.34 |
To access the effect of continuous washing cycles on antimicrobial activity of dyed woolen yarn, leaching behavior of T. arjuna dye from dyed woolen yarn was studied in terms of decrease in antimicrobial potential as a function of washing time (Fig. 14). A single washing cycle corresponds to 45 min of continuous washing at 45 °C in non-ionic detergent with a liquor ratio of 1:40.
|
| Fig. 14 Percentage microbial reduction as a function of time for un-mordanted woolen yarn. | |
In order to access relative stability quantitatively, rate of leaching and half life period of antimicrobial finish was determined. Experimental data presented in Table 7 and Fig. 14, reveal that percentage microbial reduction followed Ist-order kinetic equation and calculated rate constants and half life period of antimicrobial finish of dyed woolen yarn are presented in Table 8. Half life period and rate of decrease of antimicrobial finish analysis determines that successful antimicrobial finish have been achieved with T. arjuna dye extract.
Table 8 Ist-order kinetic parameters of antimicrobial finish of un-mordanted woolen yarn
Microbe |
Ist order kinetic parameters |
Rate constant (K1 min−1) |
Half life period (s) |
R2 |
Staphylococcus aureus subsp. aureus (MTCC 902) |
3.4 × 10⁻⁴ |
1.22 × 10⁵ |
0.951 |
Pseudomonas aeruginosa (MTCC 2453) |
1.84 × 10⁻³ |
2.25 × 10⁴ |
0.970 |
E. coli (MTCC 443) |
1.33 × 10⁻³ |
3.12 × 10⁴ |
0.968 |
Bacillus subtilis (MTCC 736) |
4.6 × 10⁻⁴ |
9.03 × 10⁴ |
0.929 |
3.12. Fluorescence of T. arjuna dye extract and dyed woolen yarn
Biocompatibility and eco-friendliness of natural dyes with least ecological concerns has motivated researchers to develop diverse and multifunctional textile material in addition to imparting fascinating shades of different hue and tone. Recently, several researchers have tried to explore the potential applications of natural dye phytoconstituents in the development of fluorescent textile materials.21,22,30 Fluorescent fabrics are being used on a fairly extensive scale in U.S.A. for swim suits, jumpers, frocks, and also for theatrical effects54 along with much scientific attention for use in textile coloration, coatings and plastics for a wide variety of textile materials.55,56 Earlier studies revealed that T. arjuna dye extract showed different colors ranging from light green to dark green under day light and UV light with different chemical reagents and solvents.57 Emission spectra of T. arjuna dye in aqueous solution shows an intense fluorescence band with peak value recorded at 509 nm under excitation wavelength of 277 nm (Fig. 15a).
|
| Fig. 15 (a) Emission spectrum of T. arjuna aqueous extract (b) woolen yarn dyed with 10% (o.w.f.) T. arjuna. | |
Earlier it was proved by Davidson that undyed wool fiber does not show any fluorescence but just displays a broad band in the region of 270–290 nm.58 However, emission spectrum of dyed woolen yarn showed interesting photoluminescence property with peak value recorded at 344 nm (Fig. 15b).
This indicates a hypsochromic shift of 165 nm with respect to dye solution and bathochromic shift of 64 nm with respect to undyed wool fiber which may be attributed to the interaction developed between T. arjuna dye components and woolen yarn samples (Fig. 4).22,30
3.13. Durability of fluorescence finish
3.13.1. Durability upon washing. Washing is standard cleaning treatment for ordinary textile material. The process of cleaning can improve long term stability of an artifact by removing water-soluble pollutants. But it is important for paper and textile conservators to understand its impact on artifacts. So, this portion of study was developed in order to assess the influence of repetitive washing cycles on emission characteristics of dyed woolen yarn. Experimental results of washing treatments clearly indicate that emission intensity has decreased upon continuous washing treatments of 5, 10 and 20 washing cycles. Loss of interaction between fluorophore of dye molecule and woolen yarn (leaching of dye) upon repeated washing treatments may be the reason for decrease in fluorescence emission intensity. Fig. 16 shows decrease in the normalized fluorescence emission intensity of dyed woolen yarn upon zero, 5, 10, and 20 washing cycles.
|
| Fig. 16 Wash durability of fluorescence finish. | |
In order to determine the effect of washing treatments on emission properties of dyed woolen yarn quantitatively, rate of leaching of fluorescent phytoconstituents was determined from the plot of emission intensity as a function of time. First-order and second-order kinetic equations were employed to determine rate of leaching and half-life of fluorescence finish upon repeated washing cycles.
From experimental results it has been found that rate of decrease in fluorescence emission on different washing cycles (0, 5, 10 and 20) follows second-order kinetic equation (R2 = 0.987) with rate constant of 2.0 × 10⁻¹² (M s)−1 and half life period of 9.61 × 10⁴ s.
3.13.2. Durability upon UV exposure. The natural aging of textile materials and their continuous exposure to sunlight contributes much to the dispersion and loss of colorimetric properties.21,22,30 Examinations of photochemical fading curves are important and useful ways of probing the interrelationship between chemical nature and physical state of dye within the fiber and its light fastness characteristics. However, external factors such as source and intensity of illumination, temperature and humidity and atmospheric pollution can affect the fading curves as well. In the present study, artificial UV radiation source from Xenon lamp was used for studying the nature and rate of fading. In fact, this type of lamp has an accelerated artificial aging effect that mimics the real conditions of exposure from sunlight. Experimental results from Fig. 17 clearly shows that normalized fluorescence emission intensity of woolen yarn dyed with 10% (o.w.f.) T. arjuna dye has decreased upon repeated exposure to artificial UV radiations from Xenon lamp.
|
| Fig. 17 Effect of UV radiation from Xenon lamp on fluorescence finish. | |
Kinetics experiments were carried out to assess relative stability of fluorescence finish quantitatively. From experimental results, decrease in fluorescence intensity of T. arjuna dyed woolen yarn upon exposure to UV radiations from xenon lamp followed first-order kinetics (R2 = 0.959) with rate constant of 4.8 × 10⁻² s−1 and half life period of 14.4 s.33 For comparison, fluorescence emission intensity data was also plotted using second-order kinetics and a linear plot was not achieved (R2 = 0.657).
4. Conclusion
The main focus of this study was to explore antibacterial and fluorescence finishing of woolen yarn with T. arjuna natural dye as an ecofriendly substitute to most of the presently used synthetic antibacterial agents. Kinetics and thermodynamic characteristics were evaluated in order to improve dyeing performance and understanding dyeing mechanisms of natural dyes. The pH has significant effect on the adsorption behaviour of dye onto woolen yarn. The main operating chemical force is chemisorption and dyeing mechanism is controlled by electrostatic interaction and hydrogen bonding as confirmed by the fitting of pseudo-second order kinetic model. Redlich–Peterson isotherm model successfully helps in understanding adsorption mechanism of T. arjuna onto woolen yarn. Using antimicrobial natural dyes in textile industry combines dyeing and finishing processes resulting in the improvement of both power and stability of antimicrobial finish. Mordanting with different metal salts have resulted in the loss of some antimicrobial activity, however mordanted samples have been found to retain more antimicrobial activity as compared to unmordanted samples subjected to repeated washing cycles. Also, pre-treatment with different metal salts produced pronounced effect on color depth (K/S), colorimetric properties (CIEL*a*b*) and emission properties of dyed woolen yarn. Durability of fluorescence finish was checked upon washing and UV radiation treatment from Xenon lamp. Both washing and UV treatment decreased fluorescence properties of dyed woolen yarn. It is concluded that the bark extract of T. arjuna may be used as an ecofriendly natural dye for protein fibers and an efficient antimicrobial and fluorescent finishing agent with very good durability.
Acknowledgements
Financial support provided by University Grants Commission, Govt. of India; New Delhi through BSR Research Fellowship in Science for Meritorious Students (Luqman Jameel Rather, Shahid-ul-Islam and Mohd Shabbir); Non-NET fellowship for Ph.D. students (Nadeem Bukhari) is thankfully acknowledged. CSIR, India is highly acknowledged for Senior Research Fellowship to author Mudsser Azam. Authors are also highly thankful to Department of Chemistry, IIT Delhi for providing testing facility for fluorescence measurements.
References
- S. Islam, M. Shahid and F. Mohammad, Ind. Eng. Chem. Res., 2013, 52, 5245 CrossRef.
- S. Islam, M. Shahid and F. Mohammad, J. Cleaner Prod., 2013, 57, 2 CrossRef.
- A. K. Prusty, T. Das, A. Nayak and N. B. Das, J. Cleaner Prod., 2010, 18, 1750 CrossRef CAS.
- M. Shahid, S. Islam and F. Mohammad, J. Cleaner Prod., 2013, 53, 310 CrossRef CAS.
- M. Yusuf, A. Ahmad, M. Shahid, M. I. Khan, S. A. Khan, N. Manzoor and F. Mohammad, J. Cleaner Prod., 2012, 27, 42 CrossRef CAS.
- A. Mitchell, M. Spencer and C. Edmiston Jr, J. Hosp. Infect., 2015, 90, 285 CrossRef CAS PubMed.
- R. Dastjerdi and M. Montazer, Colloids Surf., B, 2010, 79, 5 CrossRef CAS PubMed.
- E. Kenawy, S. D. Worley and R. Broughton, Biomacromolecules, 2007, 8, 1359–1384 CrossRef CAS PubMed.
- M. B. Mariana, V. Musat, T. Textor and B. Mahltig, RSC Adv., 2015, 5, 21562 RSC.
- Y. Gao and R. Cranston, Text. Res. J., 2008, 78, 60 CrossRef CAS.
- V. R. G. Dev, J. Venugopal, S. Sudha, G. Deepika and S. Ramakrishna, Carbohydr. Polym., 2009, 75, 646 CrossRef CAS.
- M. Joshi, S. W. Ali and R. Purwar, Indian J. Fibre Text. Res., 2009, 34, 295 CAS.
- N. R. Dhineshbabu, P. Manivasakan, A. Karthik and V. Rajendran, RSC Adv., 2014, 4, 32161 RSC.
- C. Gaëlle, G. Laurent, M. Janina, G. Jean-Pierre, K. Valérie, A. Philippe and K. Nicolas, RSC Adv., 2015, 5, 38859 RSC.
- F. Uddin, International Journal of Textile Science, 2014, 3, 15 Search PubMed.
- M. M. M. Specos, J. J. Garcia, J. Tornesello, P. Marinoa, M. D. Vecchia, M. V. D. Tesoriero and L. G. Hermida, Trans. R. Soc. Trop. Med. Hyg., 2010, 104, 653 CrossRef CAS PubMed.
- Y. Lee, J. Appl. Polym. Sci., 2007, 103, 251 CrossRef CAS.
- L. Huang, M. Gerber, J. Lu and A. E. Tonelli, Polym. Degrad. Stab., 2001, 71, 279 CrossRef CAS.
- D. Grifoni, L. Bacci, G. Zipoli, L. Albanese and F. Sabatini, Dyes Pigm., 2011, 91, 279 CrossRef CAS.
- S. Sun and R. Tang, Ind. Eng. Chem. Res., 2011, 50, 4217 CrossRef CAS.
- A. Guesmi, N. B. Hamadi, N. Ladhari, F. Saidi, H. Maaref and F. Sakli, Ind. Crops Prod., 2013, 46, 264 CrossRef CAS.
- L. J. Rather, S. Islam and F. Mohammad, Fibers Polym., 2015, 16, 1497 CrossRef CAS.
- M. I. Khan, A. Ahmad, S. A. Khan, M. Yusuf, M. Shahid, N. Manzoor and F. Mohammad, J. Cleaner Prod., 2011, 19, 1385 CrossRef CAS.
- S. A. Khan, A. Ahmad, M. I. Khan, M. Yusuf, M. Shahid, N. Manzoor and F. Mohammad, Dyes Pigm., 2012, 95, 206 CrossRef CAS.
- M. Shahid, A. Ahmad, M. Yusuf, M. I. Khan, S. A. Khan, N. Manzoor and F. Mohammad, Dyes Pigm., 2012, 95, 53 CrossRef CAS.
- L. Ahlstrom, C. S. Eskilsson and E. Bjorklund, TrAC, Trends Anal. Chem., 2005, 24, 49 CrossRef CAS.
- X. Hou, R. Yang, H. Xu and Y. Yang, Ind. Eng. Chem. Res., 2012, 51, 8341 CrossRef CAS.
- S. Rattanaphani, M. Chairat, J. B. Bremner and V. Rattanaphani, Dyes Pigm., 2007, 72, 88 CrossRef.
- R. Tang, H. Tang and C. Yang, Ind. Eng. Chem. Res., 2010, 49, 8894 CrossRef CAS.
- L. J. Rather, S. Islam, M. A. Khan and F. Mohammad, J. Environ. Chem. Eng., 2016, 4, 1780 CrossRef CAS.
- K. Kaura, S. Arora, S. Kumar and A. Nagpal, Food Chem. Toxicol., 2002, 40, 1475 CrossRef.
- S. Jain, P. Yadav, V. Gill, N. Vasudeva and N. Singla, Phytochem. Rev., 2009, 8, 491 CrossRef CAS.
- R. Bhuyan and C. N. Saikia, Indian J. Fibre Text. Res., 2004, 29, 470 CAS.
- R. Bhuyan and C. N. Saikia, Bioresour. Technol., 2005, 96, 363 CrossRef CAS PubMed.
- L. Oberoia, T. Akiyamac, K. Leec and S. J. Liu, Phytomedicine, 2011, 18, 259 CrossRef PubMed.
- A. L. Miller, Alternative Medicine Review, 1998, 3, 422 CAS.
- R. Buchhanan, Mordant safety in dyes from nature: plants & gardens, Brooklyn Botanic Garden Record, Brooklyn, New York, 1990, p. 89 Search PubMed.
- S. Subramanian and G. R. Phalgumani, Eco-friendly Textiles: Important Issues for Exports in Seminar on Eco-friendly Textiles: Challenges to the Textile Industry, Textile Committee, Ministry of Textiles, Govt. of India, 1995, p. 1 Search PubMed.
- L. Windler, M. Height and B. Nowack, Environ. Int., 2013, 53, 62 CrossRef CAS PubMed.
- S. Shahidi and J. Wiener, Antibacterial agents, Antibacterial agents in textile industry, ed. V. Bobbarala, INTECH, 2012, pp. 387–406 Search PubMed.
- G. R. Fonda, J. Opt. Soc. Am., 1936, 26, 316 CrossRef CAS.
- L. Jossens, J. M. Prausnitz, W. Fritz, E. U. Schlünder and A. L. Myers, Chem. Eng. Sci., 1978, 33, 1097 CrossRef CAS.
- Y. C. Wong, Y. S. Szeto, W. H. Cheung and G. McKay, Process Biochem., 2004, 39, 693 CrossRef CAS.
- S. Islam, L. J. Rather, M. Shahid, M. A. Khan and F. Mohammad, Ind. Crops Prod., 2014, 59, 337 CrossRef.
- R. P. Samy, S. Ignacimuthu and A. Sen, J. Ethnopharmacol., 1998, 62, 173 CrossRef.
- F. Malekzadeh, H. Ehsanifar, M. Shahamat, M. Levin and R. R. Colwell, Int. J. Antimicrob. Agents, 2001, 18, 85 CrossRef CAS PubMed.
- P. Rani and N. Khullar, Phytother. Res., 2004, 18, 670 CrossRef PubMed.
- N. Al-Zoreky, Int. J. Food Microbiol., 2009, 134, 244 CrossRef CAS PubMed.
- E. Haslam, J. Nat. Prod., 1996, 59, 205 CrossRef CAS PubMed.
- H. Akiyama, K. Fujji, O. Yamasaki, T. Oono and K. Iwatsuki, J. Antimicrob. Chemother., 2001, 48, 487 CrossRef CAS PubMed.
- B. Simoncic and B. Tomsic, Text. Res. J., 2010, 80, 1721 CrossRef CAS.
- C. Satirapathkul and T. Leela, Int. J. Biosci., Biochem. Bioinf., 2011, 1, 26 Search PubMed.
- P. Sarni-Manchado, V. Cheynier and M. Moutounet, J. Agric. Food Chem., 1999, 47, 42 CrossRef CAS PubMed.
- T. T. Baker, J. Soc. Dyers Colour., 1953, 69, 109 CrossRef CAS.
- V. Sriumaoum, J. Suesat and P. Suwanruji, Int. J. Biosci., Biochem. Bioinf., 2012, 2, 155 Search PubMed.
- B. C. Barjaa, C. A. Chesta, T. D. A. Atvars and P. F. Aramendía, Spectrochim. Acta, Part A, 2013, 116, 13 CrossRef PubMed.
- D. Desai and S. Chanda, Pharmacogn. J., 2014, 6, 15 CrossRef.
- R. S. Davidson, J. Photochem. Photobiol., B, 1996, 33, 3 CrossRef CAS.
Footnote |
† Electronic supplementary information (ESI) available. See DOI: 10.1039/c6ra02717b |
|
This journal is © The Royal Society of Chemistry 2016 |
Click here to see how this site uses Cookies. View our privacy policy here.