Structure and electrochemical properties of multilayer graphene prepared by electrochemical exfoliation of graphite in the presence of benzoate ions

Ya. I. Kurys *, O. O. Ustavytska*, V. G. Koshechko and V. D. Pokhodenko
L.V. Pysarzhevsky Institute of Physical Chemistry of NAS of Ukraine, 31 Nauky Pr., Kyiv, Ukraine. E-mail: kurys@inphyschem-nas.kiev.ua; o.ustavytska@gmail.com

Received 28th January 2016 , Accepted 23rd March 2016

First published on 24th March 2016


Abstract

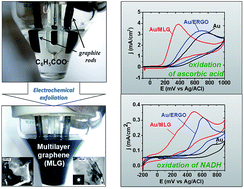
The possibility of obtaining multilayer graphenes–MLGs (11–21 single graphene layers) with slight amounts of oxygen-containing defects (C/O ratio in MLGs ranges from 9 to 25) via the electrochemical exfoliation of graphite in the presence of benzoate anions (MLG1) or benzoate and sulfate anions together (MLG2), under conditions of electrolysis with pulse changing of the electrode polarization potential was established. Composition, morphology, structure and electrochemical properties of MLGs were characterized by CHN-analysis, scanning and transmission electron microscopy, atomic force microscopy, X-ray diffraction, FTIR and UV-Vis spectroscopy, as well as cyclic voltammetry. It was shown that MLG1 and MLG2 can be used directly as electrode materials, since they provide a fast enough heterogeneous electron transfer without any additional reduction (removing of oxygen-containing groups). In particular, the electrocatalytic activity of MLGs in the processes of electrochemical oxidation of such biomarkers as ascorbic acid (MLG1 and MLG2) and NADH (MLG2) exceeds that established for the electrochemical reduced graphene oxide (ERGO), which may be due to the presence of epoxy, aldehyde, carbonyl and peroxide groups in MLGs, unlike ERGO, which can play the role of active sites.


Introduction

The constantly growing interest in graphene is related to its unique electrical, optical, mechanical, thermal and other properties.1–3 It should be noted, that the term “graphene” in modern scientific literature is often used to denote various nanoscale carbon materials3 that do not fully meet the definition of 2D carbon nanomaterials in which sp2-hybridized carbon atoms form a hexagonal lattice. For example, materials consisting of 2 or more monolayers, and also containing in their structures sp3-defects and different oxygen-containing groups3 (the amount of which is markedly lower than in graphene oxide (GO)), are referred to as “graphene”. However, for a number of applications (sensing, electrocatalysis, electroanalysis, and photocatalysis), multilayering and the presence of defects in such graphene materials can not only prevent, but also facilitate their high functional effectiveness.3–6

Significant prospects for the application of graphene and graphene-related materials in various fields2–5,7 lead to the development of inexpensive and highly productive methods for their preparation. Among the presently known approaches to obtain graphene and graphene-related materials in acceptable amounts,2–4,8 the following should be noted: a liquid phase exfoliation (under the influence of ultrasound)9–11 and electrochemical exfoliation of graphite,12,13 as well as the exfoliation of graphite oxide obtained by the chemical oxidation of graphite, followed by chemical, photochemical, thermal or electrochemical reduction of obtained GO.14,15

The electrochemical preparation of graphene and its partially oxidized analogs is a promising approach that is being intensively developed at the present time.3,8,13,16–23 It allows 2D materials to be obtained fast enough, in environmentally friendly conditions and with the possibility of managing their properties by controlling the applied current or potential. Electrochemical exfoliation of graphite is based on the anodic or cathodic intercalation/deintercalation into graphite's various anions or cations at sufficiently high potentials (currents) in aqueous or organic electrolytes. The commonly used electrolytes in such processes are aqueous solutions of sulfuric acid19–21 or sodium sulphate,21,22 as well as organic carboxylic acids (formic, acetic and oxalic)20,23 whose efficiency is determined by the size of the carboxylate anion, which is greatest for H2C2O4.20

One can assume that aromatic moieties in aromatic carboxylic acids or their salts will contribute to a more effective intercalation of carboxylate anions in the interlayer space of graphite, due to noncovalent π–π interactions. In contrast to the sulfate ions that require relatively high anodic potentials for the electrochemical exfoliation of graphite, the carboxylate ions are known to be able to undergo partial or complete decarboxylation under milder conditions. CO2, which is formed during this process, can both facilitate the separation of the graphene layers and serve as a source for the formation of additional oxygen-containing groups in the structure of the resulting graphene sheets. As far as we know, there is only one body of work devoted to the use of aromatic carboxylic acids to produce electrochemically exfoliated graphene functionalized with 9-anthracene carboxylic acid (9-ACA).24 The 9-ACA on the surface of such graphene prevents restacking of the graphene sheets. However, using harsh conditions in the anodic process (constant voltage of ∼20 V) results in a rather oxidized graphene (22.48% oxygen functionalities). On the one hand, these oxygen functionalities facilitate a reversible redox reaction, which results in high pseudocapacitance and high coulombic efficiency;24 however, on the other hand, it does not allow using 9-ACA modified graphene for a number of other electrochemical applications, in particular in the electroanalysis of important biomarkers. The overlapping of oxidation potentials of the biomarkers and 9-ACA modified graphene is quite possibly due to the high inherent electrochemical activity of such graphene, which leads to the analytes not being detectable via voltammetric techniques. In our opinion, to avoid the undesired modification of graphene by carboxylate ions, and also to reduce the number of structural and oxygen-containing defects, smaller aromatic carboxylic acids capable of effective intercalation/deintercalation in graphite, can possibly be used in the process of electrochemical exfoliation of graphite, as well as the application of anodic (oxidation) and cathodic (reduction) potentials, alternately. We do not exclude the fact that in the proposed exfoliation conditions, one can obtain few layer or multilayer graphene, due to the propensity of slightly oxidized graphene sheets for restacking. However, the amount of highly electrochemically active edge planes per volume in multilayer graphene is the same as in the single layer or few layer graphene, and only the amount of inactive basal planes decreases. Therefore, there are no notable differences when using the single layer, few layer or multilayer graphene in the electrochemical determination of a number of analytes (dopamine, ascorbic acid, uric acids etc.).3

Considering this, we have investigated the possibility of the electrochemical exfoliation of the graphite electrode in aqueous solutions of the aromatic carboxylic acid salt, sodium benzoate (in the presence and absence of Na2SO4), under electrolysis mode with pulse changing of the electrode polarization potential, and also characterized the obtained materials. Since the structure and composition of the graphene-related materials are directly related to the methods for their synthesis, and in turn determine their properties, we have examined the differences in the electrochemical characteristics of graphenes obtained in the above mentioned electrolytes, as well as their ability to exhibit electrocatalytic properties in the oxidation reactions of such biomarkers as ascorbic acid (AA) and β-nicotinamide adenine dinucleotide (NADH).

Experimental details

Electrochemical exfoliation of graphite

High purity graphite rods (Alfa Aesar, 99.9995%) and commercially available reagents (analytical grade) – Na2SO4, sodium benzoate, Na4[Fe(CN)6], AA and NADH were used in this work.

Electrochemical exfoliation of graphite was performed in an undivided cell (the working and auxiliary electrodes were graphite rods; reference electrode was Ag/AgCl (3 M KCl)), using a potentiostat PI-50-1.1 in electrolysis mode with pulse changing of the electrode polarization potential, maintaining the electrode potentials +3 and −1.5 V (30 s) with multiple changes in potential over 20 hours. Aqueous solutions of 0.1 M C6H5COOH or C6H5COONa + 0.1 M Na2SO4 were used as electrolytes. The resulting graphene materials, obtained as a dispersion, were filtered through a membrane filter with a pore diameter of 0.2 μm (SUPELCO), washed with water, ethanol and heptane, then they were transferred into water or ethanol and ultrasonically dispersed for 2 minutes in the ultrasonic washing bath (Selmi).

The graphene oxide (GO), that was used in the study for comparison was obtained by means of liquid phase exfoliation of graphite oxide, synthesized by the modified Hummers' method.25

Characterization of graphene materials, obtained by means of electrochemical exfoliation of graphite

Electron micrographs of selected areas of the surface of the synthesized graphene materials were obtained using a scanning electron microscope (Tescan Mira 3 LMU) and transmission electron microscope (TEM125K Selmi). Atomic force microscopy (AFM) of thin film graphene samples on the surface of silicon wafers coated with silicon nitride (Agar Scientific) was performed on a Nanoscope IIIa Dimension 3000TM (Digital) instrument. The X-ray diffraction patterns were recorded on a diffractometer (D8 ADVANCE, Bruker) using filtered radiation, CuKα (λ = 0.154 nm). FTIR spectra were obtained on a spectrometer (SPECTRUM ONE, Perkin Elmer) via KBr tablets. UV-Vis spectra of dispersions of graphene materials were obtained on a spectrophotometer (4802, Unico). Raman spectra were obtained with a triple spectrometer (Horiba Jobin-Yvon T64000, Ar–Kr laser, λ = 488 nm). Elemental CHN-analysis was performed using a Carlo Erba 1106 device. Electrochemical studies were carried out via computer system based on potentiostat PI-50-1.1, using a three-electrode undivided cell (working electrode was a glassy carbon disk (GC) or a gold disk (Au), with a visible surface area of 0.03 cm2; the auxiliary electrode was platinum mesh; the reference electrode was Ag/AgCl). In order to modify the electrodes, 2 μL of aqueous or alcoholic dispersion of the corresponding graphene material were dropped onto their surface, followed by drying on air.

Results and discussion

Morphology and spectroscopic properties of graphene materials obtained by means of the electrochemical exfoliation of graphite

As a result of the investigations, we have established that in the electrolysis process there is a gradual change in the color of the electrolyte, regardless of its composition, from colorless to gray, and black (Fig. 1), which indicates the exfoliation of the graphene sheets and their transition into the electrolyte.
image file: c6ra02619b-f1.tif
Fig. 1 The color change of the electrolyte during electrochemical exfoliation of the graphite electrode in 0.1 M C6H5COONa + 0.1 M Na2SO4: 0 hours (a), 5 hours (b) and 20 hours (c).

The SEM and TEM data indicate that the preferred products of the electrochemical exfoliation of graphite under the conditions used are multilayered graphenes, MLG (MLG1 when C6H5COONa was used as the electrolyte, and MLG2 if C6H5COONa + Na2SO4 were used). Fig. 2 shows typical SEM and TEM micrographs of the electrochemically obtained MLG1 and MLG2, on which multiple-layer plate structures of several microns were formed on the graphene sheets, some of which were twisted or bent. The obtained MLG have sufficiently high crystallinity as evidenced by the presence of point reflections, due to the hexagonal lattice of graphene, on the electron diffraction patterns of corresponding areas of the surface (inset of Fig. 2b and c). It is interesting to note the appearance of a system of parallel light and dark bands, the so-called Moire contrast, on TEM micrographs of the MLG1 particles (Fig. 2). A possible reason for this effect may be a slight misorientation (displacement relative to each other) of graphene layers in a multilayer package.26,27


image file: c6ra02619b-f2.tif
Fig. 2 SEM (a) and TEM (b and c) micrographs of MLG2 (a and b) and MLG1 (c) particles. Inset: selected area electron diffractions.

Compared with the original graphite on the X-ray diffraction patterns of the obtained MLG1 and MLG2, there is a significant reduction (45–90 times) in the intensity of the characteristic C002 reflex at 2θ = 26.45° (Fig. 3), and there is distinct broadening, as well as almost no observation of the less intense additional peak (C004) at 2θ = 54.60° (not shown). This is typical for multilayer graphene formation28 and indicates a decrease in the size of the crystallites in the electrochemically exfoliated samples. In addition, when moving from bulk graphite to MLG1 or MLG2, the shift of the C002 reflex toward small angles was not observed in the XRD-patterns, which may be associated with a low oxidation state of electrochemically produced graphene. Otherwise, the presence of a sufficiently high number of oxygen-containing defects in MLG1 and MLG2 should lead to the expansion of the interplanar space, as in the case of GO and partially reduced GO.29 Based on the C002 reflexes in the XRD-patterns of MLG1 and MLG2, it is possible to estimate the average size of the crystallites (La), perpendicular to the diffracting (002) planes,30 using the Debye–Scherrer equation. The calculated values (7.1 nm for MLG2; 4.4 nm for MLG1) allowed us to estimate the number of graphene layers (N) in the MLG2 and MLG1 particles, which amounted to ∼21 and ∼13, respectively, taking into account the interplanar spacing in graphite (d = 0.34 nm). Apparently, a small degree of functionalization of the electrochemically obtained graphenes promotes the manifestation of ππ-stacking interactions between the MLG particles, which leads to the formation of their agglomerates (multilayer packages) and explains the sufficiently large number of layers in MLG1 and MLG2.


image file: c6ra02619b-f3.tif
Fig. 3 C002 reflex in XRD-patterns of the original graphite, MLG2 and MLG1.

It should be noted that the values of N, calculated for the MLG1 and MLG2 particles based on the XRD data, are close to those established on the basis of studies of these materials by atomic force microscopy (AFM). According to the typical AFM micrographs (Fig. 4), the lateral size of the MLG1 and MLG2 particles from the corresponding dilute dispersions in ethanol is 2–5 μm, which is consistent with data obtained by TEM and SEM. The thickness of the MLG1 particles was determined on the basis of the corresponding cross section and amounted to ∼4 nm (Fig. 4a). At the same time, it is clearly seen that this particle is an aggregate of at least two particles lying on each other in a single plane. From this it can be assumed that the obtained MLG1 particles are few layer sheets, which are collected in the packings with the thickness of 11–12 graphene single layers, assuming layer thickness is 0.34 nm. In the case of MLG2 particles, the maximum thickness reaches 6.3 nm (Fig. 4b), corresponding to the graphene packages consisting of 18–19 layers.


image file: c6ra02619b-f4.tif
Fig. 4 AFM images and the corresponding cross-section profiles of MLG1 (a) and MLG2 (b) particles.

The differences observed in the particle size of electrochemically obtained graphenes may be related to the fact that MLG2 is less oxidized compared to MLG1, and therefore more prone to the formation of multilayer structures due to ππ-stacking. The atomic ratio of C/O in MLG2 and MLG1 (calculated on the basis of elemental analysis, which is respectively 25 and 9) is evidenced in favor of this assumption. Both MLGs are significantly less oxidized compared with the GO obtained in this work (C/O ∼ 1.6). However, the content of oxygen-containing defects in MLG1 is close to that established for chemically reduced GO (C/O ∼ 8–11),30 while it is much lower for MLG2.

We studied the Raman spectra of the obtained materials and Fig. 5 shows that the positions of the characteristic D (1361 cm−1), G (1581 cm−1) and 2D (2721–2722 cm−1) bands in the Raman spectra of MLG1 and MLG2 are virtually identical. In the MLG1 and MLG2 spectra the D′-band, which is also like a D-band associated with structural defects in graphene, is also observed. The position of the 2D-band in the Raman spectrum (>2700 cm−1) and the impossibility of its approximation via only one Lorentz-line, confirm the few-layering of electrochemically produced graphene.31 It is well known32 that determining the number of layers (N) in graphene by means of Raman spectroscopy is adequate only if the ratio I(G)/I(2D) < 1, which corresponds to N ≤ 8. The obtained values of the I(G)/I(2D) ratio for MLG1 and MLG2 are >1, which indicates the multi-layering of graphenes obtained electrochemically (N > 8) and explains the significant similarity of their Raman spectra to the spectrum of graphite. The ratio of the intensities of D and G lines in the Raman spectra of graphenes allows us to evaluate the degree of defectiveness of their structures,32,33 and the ratio of integral intensities I(D)/I(G), to calculate the sp2-domain average size of samples, using eqn (1):

 
image file: c6ra02619b-t1.tif(1)
where Lc is the sp2-domain average size in nm and λlaser is the wavelength in nm of the laser beam.34,35 The calculated value I(D)/I(G) for MLG2 (0.28) is slightly below that for MLG1 (0.30), which indicates that graphenes obtained by using an electrolyte based on C6H5COONa and Na2SO4, are less defective compared with those based on C6H5COONa only. Since the difference in I(D)/I(G) ratios for MLG1 and MLG2 is much smaller as compared with the above mentioned difference in atomic ratios of C/O in these materials, it can be assumed that the main contribution to the defectiveness of MLG1 is made by oxygen-containing groups. In the case of MLG2, large amounts of defects, caused by disordered structures not associated with such groups, are present. It is important to note that the found ratio I(D)/I(G) for MLG2 and MLG1 is less than for electrochemically obtained graphene in H2SO4 (0.42)19 in particular, and for chemically or thermally reduced GO (∼1, 2–1.5),36,37 which indicates that there is not a large amount of defects in the graphene materials obtained in this work. The average size of the ordered regions in the MLG2 particles, estimated by eqn (1), is about 16.4 nm, and the value of Lc for MLG1 (11.1 nm) is slightly lower, which is consistent with higher degree of defectiveness of MLG1.


image file: c6ra02619b-f5.tif
Fig. 5 Raman spectra of initial graphite, MLG1 and MLG2.

IR and UV-visible spectroscopy data provide confirmation of different oxidation states of graphenes obtained using different electrolytes. Fig. 6 shows the IR spectra of MLG1 and MLG2 and for comparison, a spectrum of chemically obtained GO, which is characterized by a high content of oxygen-containing fragments. The characteristic bands observed in the spectrum of the GO (Fig. 6a) are associated with the vibrations of the following bonds: C[double bond, length as m-dash]O in carboxyl and carbonyl groups (1713 cm−1), C–O in carboxyl or hydroxyl groups (1400 cm−1), C–O in epoxy and alkoxy groups (1235 cm−1 and 1047 cm−1), as well as a relatively intense band at 1579 cm−1, corresponding to the vibrations of the bands in the carbon skeleton.38–40 In contrast to the GO, in the spectra of MLG1 (Fig. 6b) and, especially, MLG2 (Fig. 6c), these bands have a much lower intensity or are almost absent. If in the spectrum of MLG1, the bands appear at 1735 (νC[double bond, length as m-dash]O), 1400 (δC–OH), 1260 (νC–O–C) and 1050 cm−1 (νC–O), then in the spectrum of MLG2 they appear only at 1740 and 1382 cm−1. The unambiguous interpretation of the band at 1630–1635 cm−1, which occurs in the spectra of MLG1 and MLG2, is difficult because it is possible to classify it as a deformation vibration of adsorbed water molecules, or as a fluctuation in the C[double bond, length as m-dash]C bonds in the unoxidized sp2-C graphene clusters.38–40 We cannot exclude the presence of peroxide groups in MLG1 and MLG2, because the characteristic bands for the vibrations of the O–O bonds in the IR spectra (within 820–890 cm−1) are very weak41 and may not occur based on the low content of such groups in graphene materials. The obtained results indicate that although the oxygen-containing groups are present in the graphene sheets of MLG, their content is much smaller than in the GO, wherein the oxidation state of MLG1 is higher compared with MLG2.


image file: c6ra02619b-f6.tif
Fig. 6 FTIR spectra of GO (a), MLG1 (b) and MLG2 (c).

Fig. 7 shows UV-Vis spectra of MLG2 and MLG1 dispersions in ethanol (0.49 and 0.35 mg ml−1, respectively). The partial oxidation of graphene material is indicated by the presence of a band with absorption maximum of 260 nm in the spectrum of MLG1 (Fig. 7b), which corresponds to the so-called van Hove singularity in the graphene density of states.42 A shoulder at about 300 nm associated with the nπ*-junction with the participation of unshared electron pairs of the oxygen atoms in hydroxyl and carbonyl groups was also observed.42 In the spectrum of MLG2 (Fig. 7) a significant shift of the maximum absorption to the red range (λmax = 270 nm) is observed, as well as the disappearance of the shoulder in the area of ∼300 nm. These facts indicate a significantly lower oxidation state of MLG2 compared with MLG1, which is consistent with the results of infrared spectroscopy and elemental analysis data. The resulting dispersions obey the Beer–Lambert law, as in the case of MLG1 (Fig. 7c).


image file: c6ra02619b-f7.tif
Fig. 7 UV-Vis spectra of the electrochemically obtained dispersions of MLG2 (a) and MLG1 (b) in ethanol. (c) The dependence of the absorption on the concentration of MLG1 at wavelength of 660 nm (c).

Electrochemical properties of MLG

The electrochemical properties of the resulting graphene materials were studied by means of cyclic voltammetry. Comparisons of the redox properties of the GO, MLG1 and MLG2 films deposited onto the glassy carbon (GC) electrode from the respective dispersions were performed in a deaerated phosphate–citrate buffer solution (pH = 7.4). As follows from Fig. 8, for the GC-electrode modified with GO film, there are three broad peaks on the cathodic branch of the cyclic voltammogram (CV) during the scanning of the potential. The broad band in the range from approximately −600 to −1150 mV may be considered as a superposition of reduction peaks of peroxide (about −700 mV) and aldehyde (about −1000 mV) groups.3,43–45 The presence of cathodic peaks at approximately −1350 and −1600 mV, according to literature data,3,43–45 can be associated with the reduction of epoxy and carbonyl moieties, respectively. The substantial currents that occur below −1600 mV can be attributed to the partial reduction of carboxyl groups, which usually require higher reduction energies.45 The absence of any peaks on the anodic branch of the CV and also cathodic peaks in the CV during the second and subsequent scanning cycles of potential, confirm the irreversibility of the electrochemical reduction of GO under these conditions.3,43
image file: c6ra02619b-f8.tif
Fig. 8 CVs of reduced GO, MLG2 (a) and MLG1 (b), deposited onto the GC-electrode; the electrolyte is phosphate–citrate buffer solution (pH = 7.4), scan rate is 100 mV s−1.

In contrast to the GO, on the first cycle of the scanning potential in the CV for MLG2 (Fig. 8a) and MLG1 (Fig. 8b), slight cathodic currents are observed, which are significantly smaller than those of the GO (if the same amount of graphene material is deposited on the electrode). This indicates the substantially lower oxidation state of MLG2 and MLG1, compared with GO. Furthermore, as follows from the cyclic voltammetry data, the nature of the dominant oxygen-containing groups in MLG1 and MLG2 may be intrinsically different. As can be seen from Fig. 8a, the defined broad peak on the cathodic CV branch for MLG2 appears at a potential of approximately −850 mV and corresponds to the reduction of peroxide and aldehyde groups.3,43–45 The reduction of MLG1 (Fig. 8b) at more negative potentials (approximately −1200 to −1700 mV) could be due to the presence of a higher amount of epoxyl, carbonyl and carboxyl functionalities.3,43–45 It should be emphasized that the assumptions about the nature of the oxygen-containing groups in MLG-1 and MLG-2, based on the cyclic voltammetry and IR spectroscopy data, are consistent with each other.

The negligible oxidation state of multilayered graphenes is also consistent with the results of the investigation of the redox properties of the Au-electrodes modified with films of initial and electrochemically reduced MLG1 and MLG2 in the classical redox system, [Fe(CN)6]3−/[Fe(CN)6]4−. The negligible reduction of such graphene materials has virtually no effect on the rate and reversibility of the specified process (Fig. 9), which opens up the possibility for using MLG1 and MLG2 directly as electrode materials. This can provide a fast enough heterogeneous electron transfer without any additional reduction (removing of oxygen-containing groups), as is necessary in the case of GO.3,46


image file: c6ra02619b-f9.tif
Fig. 9 CVs of Au-electrodes, modified with MLG2 (a) and MLG1 (b) in 2 mM Na4[Fe(CN)6] solution in 1 M KNO3. 1 represents the initial MLG, 2 represents the electrochemically reduced MLG; scan rate is 10 mV s−1.

Considering the redox properties of MLG1 and MLG2, we assumed that such materials may be of interest for a variety of electrochemical applications where, as is known,6 multilayering of graphene materials is not critical. In particular, we revealed the possibility of using the MLG1 and MLG2 as the electrocatalysts for the electrochemical oxidation of such important biomarkers as ascorbic acid (AA) and β-nicotinamide adenine dinucleotide (NADH). For comparison, unmodified Au-electrode, and Au-electrode modified with a film of electrochemically reduced GO (ERGO) were also examined in the indicated processes.

As a result of electrochemical studies, it was found that the modification of the Au-electrode with ERGO film leads to a cathodic shift of the maximum of the irreversible anodic peak by about 80 mV, corresponding to the oxidation of AA (Emax), although the emergence of catalytic currents (Eonset) occurs at approximately the same potentials (Fig. 10a, Table 1).


image file: c6ra02619b-f10.tif
Fig. 10 CVs of bare Au electrode and Au-electrodes, modified with graphene materials in electrolytes: 1 M KCl + 20 mM AA (a) and 0.2 phosphate buffer solution (pH 6.8) + 5 mM NADH; scan rate – 50 mV s−1 (a) and 20 mV s−1 (b).
Table 1 The values of potentials corresponding to the beginning of the processes (Eonset) and maximum currents (Emax) of the AA and NADH oxidation on the bare Au-electrode, and Au-electrodes modified with ERGO, MLG1 and MLG2
  AA NADH
Eonset, mV Emax, mV Eonset, mV Emax, mV
Au bare 230 750 570 730
Au/ERGO 220 670 260 610
Au/MLG1 140 375 0 480
Au/MLG2 190 550 430 700


Modification of the electrode with MLG1 film not only leads to a shift of Emax toward negative potentials relative to Au- and Au/ERGO electrodes (200 and 120 mV, respectively), but also to the cathodic shift of Eonset by 30–40 mV (Fig. 10a, Table 1). More significantly, this effect occurs when using the Au/MLG2-electrodes, which indicates high electrocatalytic activity of MLG2 in the specified process. In this case, the displacements of Eonset and Emax to the cathodic region, as compared with the Au/MLG1-electrode are 50 and 175 mV, respectively (Fig. 10a, Table 1). The essential decrease of the overvoltage during the electrochemical oxidation of AA on electrodes modified with MLG1 and especially MLG2, compared with ERGO, is probably connected on the one hand, to a smaller total amount of oxygen-containing groups in MLG, which provides higher electrical conductivity of the film and as a consequence, the rate of heterogeneous electron transfer.3 On the other hand, it may be connected to the presence of the epoxy, aldehyde, carbonyl and peroxide groups, which can play the role of catalytically active sites. The effectiveness of the use of GO is limited by its low electrical conductivity, and the ERGO, by the low content of the above-mentioned oxygen-containing groups, most of which are removed during its formation from GO by means of electrochemical reduction.

The electrocatalytic activity of ERGO, MLG2 and MLG1 in the oxidation process of NADH is somewhat different from the one discussed above toward the oxidation of AA. As can be seen from Fig. 10b and the data presented in Table 1, modification of the Au-electrode by ERGO film causes the cathodic shift of Emax (∼120 mV), Eonset (∼310 mV) and also the significant increase in catalytic current. The modification of the electrode MLG2 was much more effective, allowing the decrease in the overvoltage, in the oxidation of the reduced form of NADH to NAD+ at ∼250 (Emax) and ∼570 mV (Eonset), as compared to the unmodified Au-electrode (Fig. 10b, Table 1). At the same time, MLG1 as the electrocatalyst of the indicated process is inferior in its activity, not only for MLG2, as in the case of the AA oxidation, but also for ERGO (Fig. 10b, Table 1). Perhaps the greater electrocatalytic effect for MLG2 and less for MLG1, compared to ERGO are related to the different natures of the dominant oxygen-containing groups in such MLGs, which can promote or prevent electrochemical oxidation of NADH.

Conclusions

It can be concluded that the electrochemical exfoliation of graphite in the presence of benzoate anions under conditions of electrolysis with pulse changing of the electrode polarization potential, allows the formation of multilayer graphene (11–21 single graphene layers) with slight amounts of oxygen-containing defects. Varying the synthesis conditions makes it possible to change the C/O ratio in graphene from 9 (close to that in chemically or thermally reduced GO) to 25. It was found that the use of MLGs as the electrode materials provides a fast enough heterogeneous electron transfer without it being necessary to reduce the oxygen-containing groups, as in the case of the GO, which opens up prospects for their use in various electrochemical applications. It is shown that the electrocatalytic activity of MLGs in the electrochemical oxidation reactions of such biomarkers as AA (MLG1 and MLG2) and NADH (MLG2) exceeds the results established for the electrochemically reduced GO.

Acknowledgements

The work was partly financially supported by the Target Complex Programs of Scientific Research of National Academy of Sciences of Ukraine “Fundamental problems of production of new chemical substances and materials” (project no. 14), “Fundamental problems of creation of new nanomaterials and nanotechnologies” (project no. 30). The authors are grateful to Dr A. Korchovyi and Y. Stubrov (V.E. Lashkaryov Institute of Semiconductor Physics NAS of Ukraine) for the technical assistance in the AFM and Raman spectra measurements.

References

  1. K. S. Novoselov, A. K. Geim, S. V. Morozov, D. Jiang, Y. Zhang, S. V. Dubonos, I. V. Grigorieva and A. A. Firsov, Science, 2004, 306, 666–669 CrossRef CAS PubMed.
  2. V. Singh, D. Joung, L. Zhai, S. Das, S. I. Khondaker and S. Seal, Prog. Mater. Sci., 2011, 56, 1178–1271 CrossRef CAS.
  3. A. Ambrosi, C. K. Chua, A. Bonanni and M. Pumera, Chem. Rev., 2014, 114, 7150–7188 CrossRef CAS PubMed.
  4. D. A. C. Brownson, D. K. Kampouris and C. E. Banks, Chem. Soc. Rev., 2012, 41, 6944–6976 RSC.
  5. Y. Liu, X. Dong and P. Chen, Chem. Soc. Rev., 2012, 41, 2283–2307 RSC.
  6. M. S. Goh and M. Pumera, Chem.–Asian J., 2010, 5, 2355–2357 CrossRef CAS PubMed.
  7. B. F. Machado and P. Serp, Catal. Sci. Technol., 2012, 2, 54–75 CAS.
  8. Y. L. Zhong, Z. Tian, G. P. Simon and D. Li, Mater. Today, 2015, 18, 73–78 CrossRef CAS.
  9. J. N. Coleman, Acc. Chem. Res., 2013, 46, 14–22 CrossRef CAS PubMed.
  10. Y. Wei and Z. Sun, Curr. Opin. Colloid Interface Sci., 2015, 20, 311–321 CrossRef CAS.
  11. A. Ciesielski and P. Samorì, Chem. Soc. Rev., 2014, 43, 381–398 RSC.
  12. J. Lu, J.-X. Yang, J. Wang, A. Lim, S. Wang and K. P. Loh, ACS Nano, 2009, 3, 2367–2375 CrossRef CAS PubMed.
  13. N. Liu, F. Luo, H. X. Wu, Y. H. Liu, C. Zhang and J. Chen, Adv. Funct. Mater., 2008, 18, 1518–1525 CrossRef CAS.
  14. W. S. Hummers and R. E. Offeman, J. Am. Chem. Soc., 1958, 80, 1339 CrossRef CAS.
  15. S. Park and R. S. Ruoff, Nat. Nanotechnol., 2009, 4, 217–224 CrossRef CAS PubMed.
  16. J. Wang, K. K. Manga, Q. Bao and K. P. Loh, J. Am. Chem. Soc., 2011, 133, 8888–8891 CrossRef CAS PubMed.
  17. M. Alanyalioglu, J. J. Segura, J. Oro-Sole and N. Casan-Pastor, Carbon, 2012, 50, 142–152 CrossRef CAS.
  18. C.-Y. Su, A.-Y. Lu, Y. Xu, F.-R. Chen, A. N. Khlobystov and L.-J. Li, ACS Nano, 2011, 5, 2332–2339 CrossRef CAS PubMed.
  19. K. Parvez, R. Li, S. R. Puniredd, Y. Hernandez, F. Hinkel, S. Wang, X. Feng and K. Müllen, ACS Nano, 2013, 7, 3598–3606 CrossRef CAS PubMed.
  20. J. Liu, C. K. Poh, D. Zhan, L. Lai, S. H. Lim, L. Wang, X. Liu, N. G. Sahoo, C. Li, Z. Shen and J. Lin, Nano Energy, 2013, 2, 377–386 CrossRef CAS.
  21. B. Qi, L. He, X. Bo, H. Yang and L. Guo, Chem. Eng. J., 2011, 171, 340–344 CrossRef CAS.
  22. K. Parvez, Z.-S. Wu, R. Li, X. Liu, R. Graf, X. Fengn and K. Müllen, J. Am. Chem. Soc., 2014, 136, 6083–6091 CrossRef CAS PubMed.
  23. P. Mahanandia, F. Simon, G. Heinrich and K. K. Nanda, Chem. Commun., 2014, 50, 4613–4615 RSC.
  24. P. Khanra, T. Kuila, S. H. Bae, N. H. Kim and J. H. Lee, J. Mater. Chem., 2012, 22, 24403–24410 RSC.
  25. N. I. Kovtyukhova, P. J. Ollivier, B. R. Martin, T. E. Mallouk, S. A. Chizhik, E. V. Buzaneva and A. D. Gorchinskiy, Chem. Mater., 1999, 11, 771–778 CrossRef CAS.
  26. D. L. Miller, K. D. Kubista, G. M. Rutter, M. Ruan, W. A. de Heer, P. N. First and J. A. Stroscio, Phys. Rev. B: Condens. Matter Mater. Phys., 2010, 81, 125427 CrossRef.
  27. P. Xu, D. Qi, J. K. Schoelz, J. Thompson, P. M. Thibado, V. D. Wheeler, L. O. Nyakiti, R. L. Myers-Ward, C. R. Eddy Jr, D. K. Gaskill, M. Neek-Amal and F. M. Peeters, Carbon, 2014, 80, 75–81 CrossRef CAS.
  28. Z. Sun, S. Poller, X. Huang, D. Guschin, C. Taetz, P. Ebbinghaus, J. Masa, A. Erbe, A. Kilzer, W. Schuhmann and M. Muhler, Carbon, 2013, 64, 288–294 CrossRef CAS.
  29. T. Kuila, S. Bose, P. Khanra, A. K. Mishra, N. H. Kim and J. H. Lee, Carbon, 2012, 50, 914–921 CrossRef CAS.
  30. T. Szabó, A. Szeri and I. Dékány, Carbon, 2005, 43, 87–94 CrossRef.
  31. Z. Ni, Y. Wang, T. Yu and Z. Shen, Nano Res., 2010, 1, 273–291 CrossRef.
  32. A. Das, B. Chakraboty and A. K. Sood, Bull. Mater. Sci., 2008, 31, 579 CrossRef CAS.
  33. Y. Min, Z. Shen, X. Zhang and S. Ma, J. Phys. D: Appl. Phys., 2013, 46, 025301 CrossRef.
  34. M. A. Pimenta, G. Dresselhaus, M. S. Dresselhaus, L. G. Cancado, A. Jorio and R. Saito, Phys. Chem. Chem. Phys., 2007, 9, 1276 RSC.
  35. N. Camara, G. Rius, J.-R. Huntzinger, A. Tiberj, N. Mestres, P. Godignon and J. Camassel, Appl. Phys. Lett., 2008, 93, 503 Search PubMed.
  36. V. López, R. S. Sundaram, C. G. Navarro, D. Olea, M. Burghard, J. G. Herrero, F. Zamora and K. Kern, Adv. Mater., 2009, 21, 4683–4686 CrossRef.
  37. C. Mattevi, G. Eda, S. Agnoli, S. Miller, K. A. Mkhoyan, O. Celik, D. Mastrogiovanni, G. Granozzi, E. Garfunkel and M. Chhowalla, Adv. Funct. Mater., 2009, 19, 2577–2583 CrossRef CAS.
  38. S. Park, J. An, I. Jung, R. D. Piner, S. J. An, X. Li, A. Velamakanni and R. S. Ruoff, Nano Lett., 2009, 9, 1593–1597 CrossRef CAS PubMed.
  39. T. Szabó, O. Berkesi and I. Dékány, Carbon, 2005, 43, 3186 CrossRef.
  40. H.-L. Guo, X.-F. Wang, Q.-Y. Qian, F.-B. Wang and X.-H. Xia, ACS Nano, 2009, 3, 2653–2659 CrossRef CAS PubMed.
  41. Interpretation of Infrared Spectra, A Practical Approach John Coates in Encyclopedia of Analytical Chemistry, ed. R. A. Meyers, John Wiley & Sons Ltd, Chichester, 2000 Search PubMed.
  42. F. Bonaccorso, Z. Sun, T. Hasan and A. C. Ferrari, Nat. Photonics, 2010, 4, 611–622 CrossRef CAS.
  43. E. Lay, K. Chang and M. Pumera, Chem.–Asian J., 2011, 6, 2899–2901 CrossRef PubMed.
  44. A. Y. S. Eng, A. Ambrosi, C. K. Chua, F. Šaněk, Z. Sofer and M. Pumera, Chem.–Eur. J., 2013, 19, 12673–12683 CrossRef CAS PubMed.
  45. C. K. Chua, Z. Sofer and M. Pumera, Chem.–Eur. J., 2012, 18, 13453–13459 CrossRef CAS PubMed.
  46. A. Ambrosi, A. Bonanni, Z. Sofer, J. S. Cross and M. Pumera, Chem.–Eur. J., 2011, 17, 10763–10770 CrossRef CAS PubMed.

Footnote

Ya. I. Kurys and O. O. Ustavytska contributed equally to this work.

This journal is © The Royal Society of Chemistry 2016