AIE active triphenylamine–benzothiazole based motifs: ESIPT or ICT emission

Vikas S. Padalkar*a, Daisuke Sakamakia, Kenji Kuwadaa, Norimitsu Tohnaib, Tomoyuki Akutagawac, Ken-ichi Sakaid and Shu Seki*a
aDepartment of Molecular Engineering, Graduate School of Engineering, Kyoto University, Nishikyo-ku, Kyoto, 615-8510, Japan. E-mail: vikaspadalkar@gmail.com; seki@moleng.kyoto-u.ac.jp
bDepartment of Material and Life Science, Graduate School of Engineering, Osaka University, Suita, Osaka 565-0871, Japan
cInstitute of Multidisciplinary Research for Advanced Materials, Tohoku University, Sendai, 980-8577, Japan
dDepartment of Bio- & Material Photonics, Chitose Institute of Science and Technology, Chitose 066-8655, Japan

Received 27th January 2016 , Accepted 1st March 2016

First published on 2nd March 2016


Abstract

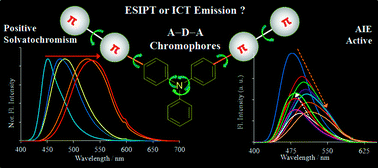
Two novel donor–π bridge–acceptor compounds containing excited state intramolecular proton transfer (ESIPT) and non-ESIPT units based on triphenylamine–benzothiazole were synthesized via Suzuki coupling reaction. Their photophysical properties were studied in the solid state as well as in solutions with solvents of different polarities. The fluorophores showed absorption in the UV region and emission in the visible region in both solutions and solid state. The optical properties of these compounds are highly dependent on solvent polarity. Significant positive solvatochromism (∼30 nm absorption and ∼80 nm emission red shift in polar solvents) were observed for both the compounds. Large Stokes shift (∼15[thin space (1/6-em)]000 cm−1), polarity sensitive optical properties and very high quantum efficiencies (∼90%) in solvents and the solid state are the striking features of the synthesized compounds. Intramolecular charge transfer (ICT) characteristics of the compounds were supported experimentally and computationally. Halochromism and the intermolecular charge transfer phenomenon were used for investigation of ESIPT emission for compound 9 over ICT emission.


Introduction

Organic luminescent materials have attracted continuous attention in recent years, due to their wide range of applications in various fields such as in optics,1 electronics2 and in newer arenas of biotechnology.3–6 Several π-conjugated systems, donor–acceptor systems and polymeric fluorescent systems have been used for the above applications.7 Generally, these organic materials exhibited very strong fluorescence in dilute solution but are weakly or non-emissive when they are aggregated in the solid states, due to both strong intermolecular π–π stacking interactions and non-radiative decay.8 This quenching phenomenon is called aggregation-caused quenching (ACQ)9 which has been serious problem that has severely obstructed advancement in the development of optoelectronic devices. Development of luminescent materials which are strongly emissive in the solid and aggregated states is still a challenging issue due ACQ and other non-radiative pathways occurring in the excited state. Recently a novel class of the compounds which are non-emissive or weakly emissive in dilute solution but strongly emissive in aggregate state, has been reported. The mechanism behind this is called aggregation-induced emission (AIE) or aggregation induced emission enhancement (AIEE).10–12 A large variety of AIE/AIEE active chromophores have been reported for various applications such as ion sensors,13 explosive sensors,14 OLEDs,15 fingerprint visualization,16 wave guiding,17 liquid crystal,18 bioassay,6 stimuli responsive materials,19 DNA visualization,20 protein fibrillation detection,21 membrane imaging,22 mitochondria,23 bacteria,24 tissue imaging and photodynamic therapy.25 However, photophysical phenomena associated with AIE or AIEE chromophores in aggregate state have not yet been understood completely.12 Since the discovery of the AIE concept in 2001 by Tang et al.26 series of AIE/AIEE active chromophores have been reported by researchers.10–12 Various mechanistic pathways such as conformational planarization, J-aggregate formation, E/Z isomerization, twisted intramolecular charge transfer (TICT), excited state intramolecular proton transfer (ESIPT),27 restriction of intramolecular rotation (RIR), restriction of intramolecular vibration (RIV), and restriction of intramolecular motion (RIM) have been explored to achieve AIE by hampering the intermolecular π–π stacking interaction.10–12 However, none of the above can be fully supported by the experimental data to all the reported AIE active systems.10,12 Understanding the molecular structure and their detailed photophysical properties is therefore essential for designing of novel solid state luminescent materials.

Designing of donor–acceptor (D–A)/donor–π–acceptor (D–π–A)/acceptor–donor–acceptor (A–D–A) type of chromophore is more desirable approach for tuning the optical properties of the chromophores by controlling the strength of donor or/and acceptor and length of π-conjugated system.28,29 Plenty of chromophores have been reported in last two decade for potential applications based on these frameworks because of efficient intramolecular charge transfer properties of these types of molecules.30 Various donors (carbazole, aromatic amines, thiophenes, thienothiophenes, etc.) and acceptors (cyanoacrylic acids, azoles, diketopyrrolopyrrole, bithiazole, iso-indigo, benzothiadiazole, benzotriazole, and quinoxalines, etc.) have been explored for designing such chromophores.28–34 With appropriate choices of the donor and acceptors, the levels of the highest occupied molecular orbital (HOMO) and lowest unoccupied molecular orbital (LUMO) as well as the emission color of the D–A, D–π–A, D–A–D, and A–D–A molecule can be tuned by chemical alteration.35,36 Among them, most functional chromophores typically feature a hydrophobic electron-donating triphenylamine (TPA) moiety connected to different electron accepting units through π-system.30

TPA is well known as an electron donating unit providing simultaneously hole-transporting pathways in luminescent material, however it suffers from the effect of ACQ in condensed state.37 Recently, significant efforts have been put on transformation of ACQ active TPA chromophores to AIE active chromophores having excellent luminescent properties in the aggregate and solid state10,38–40 by introducing AIEgens units. Benzothiazole (BT) is a heterocyclic unit with electron-rich sulfur and nitrogen atom having electron acceptor property. 2-Hydroxy analogue of BT is known for excited state intramolecular proton transfer (ESIPT) process.41 Large Stokes shift due to ESIPT emission (keto tautomer) without self-absorption is a unique property of ESIPT systems.42 This characteristic can be used as a new design strategy for producing fluorescent organic materials to reduce self-quenching using ESIPT properties.43 Considering the advantages of the combination of TPA and BT respectively as electron-donating and accepting units, in the present study we have synthesized two push-full chromophores and studied their photophysical properties systematically.

Experimental details

Materials

Phosphorus trichloride, 4-bromo-2-hydroxybenzoic acid, 2-aminothiophenol, 4,4′-dibromotriphenylamine, 1,3-propanediol, Pd(PPh3)4, K2CO3, n-BuLi, trimethylborate, pyridine, acetic anhydride, KOH, trifluoroacetic acid (TFA) and 2,3-dichloro-5,6-dicyano-1,4-benzoquinone (DDQ) were purchased from Tokyo Chemical Industries (TCI), Japan. All the solvents used for the synthesis were from Wako Pure Chemical Industries Ltd., Japan. All the reagents were used without further purification.

Characterizations

All the synthesized compounds were purified by column chromatography on silica gel. Compounds 8 and 9 were purified by column chromatography followed by recycle preparative HPLC system (Japan Analytical Industry Co., Ltd., LC-9210NEXT with JaiGel-1H/-2H) using chloroform as eluent with flow rate 3.0 mL min−1. The intermediates and compounds were characterized by NMR, MALDI-TOF (matrix-assisted laser desorption ionization time-of-flight) and elemental analysis techniques. The 1H-NMR and 13C-NMR spectra were recorded on a JEOL 400SS (400 MHz) spectrometer and all spectra were recorded in a CDCl3 solvent using TMS as an internal reference standard at room temperature (20 °C). Chemical shifts of NMR spectra are given in parts per million (ppm). Low and high resolution matrix-assisted-laser-desorption/ionization (MALDI) mass spectra (MS) were obtained on Bruker Daltonics ultraflex using dithranol as a matrix. All steady state absorption spectra were recorded on a JASCO V-570 UV-vis spectrophotometer. Fluorescence spectra were measured on fluorescence spectrophotometer (F-2700, Hitachi High-Technologies). Relative quantum yield measurements were performed using FP-6500 spectrofluorometer (JASCO). Absolute quantum yields in solid state were measured on FP-6500 spectrofluorometer with an ISF-513 fluorescence integrate sphere unit (JASCO). DSC measurements were performed on a PerkinElmer model DSC 8000 differential scanning calorimeter. Powder-XRD measurements were performed on MiniFlex 600, Rigaku make in the range of 2θ = 2–30°. All theoretical calculations were performed using Gaussian 09 package [same methods and techniques were used].41

Synthesis details

2-(Benzo[d]thiazol-2-yl)-5-bromophenol 3. Phosphorus trichloride (0.63 g, 4.6 mmol) was added dropwise to a solution of 4-bromo-2-hydroxybenzoic acid 2 (1.0 g, 4.6 mmol) and 2-aminothiophenol 1 (0.69 g, 5.5 mmol) in toluene (40.0 mL), maintaining the temperature below 40 °C. The mixture was refluxed for 8 h. After completion of reaction as monitored by TLC, reaction mixture was neutralized with aqueous sodium carbonate solution (20% w/v). Toluene was removed by vacuum distillation and crude product was extracted in chloroform which was further purified by column chromatography on silica gel (hexane–ethylacetate: 90[thin space (1/6-em)]:[thin space (1/6-em)]10) to yield 2-(benzo[d]thiazol-2-yl)-5-bromophenol 3 as white solid.44

Yield after column chromatography: 52%, white solid.

1H-NMR (400 MHz, CDCl3, 20 °C): δ ppm 12.70 (s, 1H, –OH), 7.97–7.99 (d, J = 8.0 Hz, 1H), 7.89–7.91 (d, J = 8.0 Hz, 1H), 7.49–7.54 (m, 2H), 7.40–7.44 (m, 1H), 7.29 (d, J = 2.0 Hz, 1H), 7.10–7.07 (dd, J1 = 2.0 Hz, J2 = 8.0 Hz, 1H).

MALDI-TOF (m/z): calculated: 304.95, found: 305.92.

2-(Benzo[d]thiazol-2-yl)-5-bromophenyl acetate 4. Mixture of 2-(benzo[d]thiazol-2-yl)-5-bromophenol 3 (4.0 g, 13.0 mmol), pyridine (4.0 mL) and acetic anhydride (10.0 mL) were stirred in dichloromethane (80.0 mL) at room temperature for 24 h. After completion, the reaction mixture was quenched in ice and product was extracted with dichloromethane. The dichloromethane layer was concentrated under vacuum to yield crude 2-(benzo[d]thiazol-2-yl)-5-bromophenyl acetate 4 which was further purified by column chromatography on silica gel (hexane–ethylacetate: 97[thin space (1/6-em)]:[thin space (1/6-em)]3).

Yield after column chromatography: 58%, white solid.

1H-NMR (400 MHz, CDCl3, 20 °C): δ ppm 8.19–8.21 (d, J = 8.0 Hz, 1H), 8.06–8.08 (d, J = 8.0 Hz, 1H), 7.91–7.93 (d, J = 8.0 Hz, 1H), 7.49–7.54 (m, 2H), 7.39–7.44 (m, 2H), 2.48 (s, 3H).

MALDI-TOF (m/z): calculated: 348.21, found: 349.97.

N-4-(1,3,2-Dioxaborinan-2-yl)phenyl-4-(1,3,2-dioxaborinan-2-yl)-N-phenylaniline 7. n-BuLi (1.6 M in hexane, 5.6 mL) was added drop wise into a solution of 4,4′-dibromotriphenylamine 5 (3.0 g, 7.4 mmol) in anhydrous THF (90.0 mL) at −78 °C. The reaction mixture was stirred for 2 h prior to the addition of tri-methyl borate (7.7 g, 74.0 mmol) in one portion. The mixture was stirred at −78 °C for 2 h after addition of tri-methyl borate and warmed to room temperature and stirred for 12 h. The reaction mass was poured into crushed ice containing 2 M HCl (200.0 mL) with constant stirring. The reaction mixture was extracted with diethyl ether (100 mL × 3) and the combined extracts were evaporated to give white colored solid as a diboronic acid 6. The obtained crude solid was refluxed with 1,3-propanediol (2.3 g, 29.0 mmol) in 80.0 mL toluene for 12 h. The reaction mass was concentrated under vacuum and the obtained solid was purified by column chromatography (on silica gel and chloroform as the eluent) to obtain a white solid 7. Boronic ester was prepared instead of boronic acid to enhance the solubility of reactant for the next step (i.e. Suzuki-coupling reaction) in toluene solvent.

Yield after column chromatography: 45%, buff white solid.

1H-NMR (400 MHz, CDCl3, 20 °C): δ ppm 7.60–7.65 (m, 2H), 7.21–7.23 (m, 2H), 7.02–7.14 (m, 7H), 4.09–4.15 (t, 8H), 2.00–2.06 (m, 4H).

MALDI-TOF (m/z): calculated: 413.08, found: 413.22.

Phenylazanediyl-bis(4-(benzo[d]thiazol-2-yl)-[1,1′-biphenyl]-4′,3-diyl) diacetate 8. N-4-(1,3,2-Dioxaborinan-2-yl)phenyl-4-(1,3,2-dioxaborinan-2-yl)-N-phenylaniline 7 (0.3 g, 0.72 mmol), 2-(benzo[d]thiazol-2-yl)-5-bromophenyl acetate 4 (0.5 g, 1.4 mmol), and Pd(PPh3)4 (0.01 g, 0.009 mmol) were added to a mixture of 50.0 mL degassed toluene (three times) and aqueous (degassed water 4.0 mL) 2 M K2CO3 under nitrogen atmosphere. The mixture was stirred at 110 °C for 48 h. After completion of reaction (monitored by TLC) the mixture was cooled to room temperature, and poured into deionized water (200.0 mL). The aqueous layer was extracted thrice with dichloromethane. The combined organic layers were washed with water and dried over sodium sulfate. The organic layer was concentrated under vacuum, to obtain a yellow colored solid. The crude product was purified by column chromatography on silica gel (hexane–ethylacetate: 90[thin space (1/6-em)]:[thin space (1/6-em)]10) followed by preparative recyclable HPLC (mobile phase: chloroform).

Yield after column chromatography: 48%, yellow solid.

1H-NMR (400 MHz, CDCl3, 20 °C): δ ppm 8.35–8.37 (d, J = 8.0 Hz, 2H), 8.08–8.10 (d, J = 8.0 Hz, 2H), 7.92–7.94 (d, J = 8.0 Hz, 2H), 7.61–7.63 (d, J = 8.0 Hz, 2H), 7.53–7.58 (m, 4H), 7.49–7.51 (t, 2H), 7.45–7.46 (d, J = 2.4 Hz, 2H), 7.39–7.43 (t, 2H), 7.31–7.35 (t, 2H), 7.19–7.21 (m, 6H), 7.10–7.13 (t, 1H), 2.53 (s, 6H).

13C-NMR (100 MHz, CDCl3, 20 °C): δ ppm 169.24, 162.36, 153.05, 148.61, 147.72, 147.01, 143.87, 135.25, 133.12, 130.60, 129.53, 127.97, 126.34, 125.29, 125.19, 124.38, 124.30, 124.00, 123.86, 123.27, 121.52, 21.76.

MALDI-TOF (m/z): calculated: 779.19, found: 779.30.

Elemental analysis; mol. formula: C48H33N3O4S2 (actual: C: 73.92, H: 4.26, S: 8.22, N: 5.39; found: C: 73.86, H: 4.27, S: 7.94, N: 5.22).

4-(Benzo[d]thiazol-2-yl)-4′-((4′-(benzo[d]thiazol-2-yl)-3′-hydroxy-[1,1′-biphenyl]-4-yl)(phenyl)amino)-[1,1′-biphenyl]-3-yl acetate 9. Phenylazanediyl-bis(4-(benzo[d]thiazol-2-yl)-[1,1′-biphenyl]-4′,3-diyl)diacetate 8 (0.25 g, 0.2 mmol) was refluxed with potassium hydroxide (0.01 g, 0.2 mmol) in dichloromethane (20.0 mL) for 12 h. After completion of reaction (monitored by TLC) the mixture was cooled to room temperature, and poured into ice (50.0 g). Hydrolysis reaction ends with mixture of mono-hydroxy and di-hydroxy products (only mono-hydroxy product was isolated by column chromatography for our research interest). The crude products were extracted thrice with dichloromethane. The combined organic layers were washed with water and dried over sodium sulfate. The organic layer was concentrated under vacuum to obtain a yellow colored solid. The crude product 9 was purified by column chromatography on silica gel (hexane–ethylacetate: 90[thin space (1/6-em)]:[thin space (1/6-em)]10) followed by preparative recyclable HPLC (mobile phase: chloroform).

Yield after column chromatography: 76%, yellow solid.

1H-NMR (400 MHz, CDCl3, 20 °C): δ ppm 12.56 (s, 1H, –OH), 8.35–8.37 (d, J = 8.0 Hz, 1H), 8.08–8.10 (d, J = 8.0 Hz, 1H), 7.99–8.01 (d, J = 8.0 Hz, 1H), 7.90–7.94 (t, 2H), 7.73–7.75 (d, J = 8.0 Hz, 1H), 7.49–7.63 (m, 8H), 7.46 (d, J = 12.0 Hz, 1H), 7.39–7.43 (t, 2H), 7.29–7.34 (m, 3H), 7.20–7.22 (m, 6H), 7.10–7.13 (t, 1H), 2.53 (s, 3H).

13C-NMR (100 MHz, CDCl3, 20 °C): δ ppm 169.25, 169.05, 162.38, 162.34, 158.21, 153.05, 151.90, 148.60, 147.77, 147.57, 147.05, 144.85, 143.90, 135.25, 133.90, 133.01, 132.55, 130.61, 129.52, 128.85, 127.95, 127.89, 126.70, 126.32, 125.45, 125.30, 125.19, 124.38, 124.28, 123.99, 123.95, 123.83, 123.27, 122.08, 121.52, 121.35, 117.98, 115.43, 115.29, 21.81.

MALDI-TOF (m/z): calculated: 737.89, found: 737.31.

Elemental analysis; mol. formula: C46H31N3O3S2 (actual: C: 74.87, H: 4.23, S: 8.69, N: 5.69; found: C: 74.67, H: 4.27, S: 8.22, N: 5.33).

Result and discussion

Design and synthesis of compounds

The synthesis details of the compounds 8 and 9 are presented in Scheme 1. The intermediate 4 was synthesized from 2-aminothiophenol 1 and 4-bromo-2-hydroxybenzoic acid 2 by acid catalyzed cyclisation followed by acetylating with acetic anhydride. Boronic ester 7 was prepared from 4,4′-dibromotriphenylamine by n-BuLi reaction at −78 °C followed by substitution reaction of trimethylborate and 1,3-propanediol. The main aim of conversion of boronic acid to boronic ester was to increase the solubility of reactant for Suzuki coupling reaction. The intermediate 4 was coupled with boronic ester 7 via Suzuki coupling reaction using Pd(PPh3)4 under alkaline condition to obtain compound 8. The compound 8 was treated with potassium hydroxide in dichloromethane at reflux temperature to obtain 9 with good yield. The presence of –OH peak at δ 12.56 ppm in NMR spectrum of compound 9 confirms the deprotonation. The intermediates 4, 7 and compounds 8, 9 were purified by column chromatography and well characterized by spectral techniques. 1H and 13C-NMR spectra of compounds are provided in ESI (Fig. S11–S14).
image file: c6ra02417c-s1.tif
Scheme 1 Synthesis of phenylazanediyl-bis(4-(benzo[d]thiazol-2-yl)-[1,1′-biphenyl]-4′,3-diyl) diacetate 8 and 4-(benzo[d]thiazol-2-yl)-4′-((4′-(benzo[d]thiazol-2-yl)-3′-hydroxy-[1,1′-biphenyl]-4-yl)(phenyl)amino)-[1,1′-biphenyl]-3-yl acetate 9.

Optical properties

Steady state measurements. Optical properties of the compounds 8 and 9 were investigated by UV-visible and fluorescence spectroscopy. Both the compounds had good solubility in common organic solvents such as THF, chloroform, toluene, acetonitrile, and DMSO, partial solubility in protic solvents (methanol and ethanol) and are insoluble in water. The effects of solvent polarity on the absorption and emission properties were evaluated in different solvents (Table 1).
Table 1 Summery of optical properties of the compounds 8 and 9 in different solvents and solid state
Comps Medium λabsmax (nm) ε (mol−1 dm3 cm−1) λemmax (nm) Stoke shift (nm) Stoke shift (cm−1) Quantum efficiency Φ (%)
a Measured on thin film, spin-cast from (1 wt%) dichloromethane solution.b Measured from 10−5 M solution.c Absolute quantum yields in solid state.d Quantum yields measured by relative method using quinine sulphate standard (10−5 M).e Not calculated.
8 Solid filma 405, 311 e 493 88, 182 4407, 11[thin space (1/6-em)]870 21c
Tolueneb 389, 302 65[thin space (1/6-em)]600 448 59, 146 3385, 10[thin space (1/6-em)]790 86d
40[thin space (1/6-em)]000
THFb 389, 300 69[thin space (1/6-em)]000 478 89, 178 4786, 12[thin space (1/6-em)]412 85d
43[thin space (1/6-em)]300
Chloroformb 390, 299 64[thin space (1/6-em)]700 475 85, 176 4588, 12[thin space (1/6-em)]392 88d
44[thin space (1/6-em)]700
Acetonitrileb 385, 300 68[thin space (1/6-em)]100 526 141, 226 6962, 14[thin space (1/6-em)]321 75d
43[thin space (1/6-em)]000
DMSOb 395, 305 63[thin space (1/6-em)]900 528 133, 223 6377, 13[thin space (1/6-em)]847 78d
43[thin space (1/6-em)]400
9 Solid filma 409, 305 e 490 81, 185 4041, 12[thin space (1/6-em)]378 21c
Tolueneb 394, 297 62[thin space (1/6-em)]700 450 56, 153 3158, 11[thin space (1/6-em)]447 75d
33[thin space (1/6-em)]200
THFb 393, 295 63[thin space (1/6-em)]900 483 90, 188 4741, 13[thin space (1/6-em)]194 78d
35[thin space (1/6-em)]500
Chloroformb 394, 297 63[thin space (1/6-em)]000 474 80, 177 4283, 12[thin space (1/6-em)]572 80d
36[thin space (1/6-em)]600
Acetonitrileb 388, 295 64[thin space (1/6-em)]600 525 137, 230 6725, 14[thin space (1/6-em)]850 67d
35[thin space (1/6-em)]000
DMSOb 394, 302 56[thin space (1/6-em)]300 533 139, 231 6618, 14[thin space (1/6-em)]350 69d
33[thin space (1/6-em)]900


UV-visible absorption spectra of compounds 8 and 9 are presented in Fig. 1 and S1. Both compounds have the same donor and acceptor and differ only by the substitution at 2-position of the benzothiazole unit. Both the compounds show two absorption bands in near UV and visible region in various solvents between 270 to 450 nm. The absorption band located ∼300 nm can be assigned to π–π* electronic transition of the respective TPA and BT units, and ∼390 nm due to the transition of the conjugated TPA–BT backbone. Spectral peak positions of the absorption bands were almost unchanged for both the compounds in polar (acetonitrile and DMSO), non-polar (toluene and chloroform), and moderately polar (THF) solvents with small contribution from tailing of the lower transition energies. This indicates that there is little influence of solvent polarity on the ground state and a negligible charge transfer process between the TPA donor and BT acceptor in the ground state. In acetonitrile absorption maxima was 385 and 388 nm for compound 8 and 9 respectively, while slightly red shifted absorption was observed in other studied solvents. In solid state, compounds 8 and 9 showed absorption maxima at 405 and 409 nm respectively which were ∼20 nm red shifted absorptions as compared to absorption maxima in acetonitrile (Fig. S2).


image file: c6ra02417c-f1.tif
Fig. 1 Steady state absorption spectra of compounds: 8 (left) and 9 (right) in different solvents (10−5 M concentration) at room temperature.

Interestingly, the emission properties of the compounds are dependent on solvent polarity (Fig. 2). In all the studied solvents both the compounds showed single emission maxima with very large Stokes shift. Both compounds show positive solvatochromism effect, indicating the significant dipole moment change in the excited state. In toluene compounds emitted ∼450 nm, while in DMSO it was ∼530 nm which is ∼80 nm red shifted (Fig. 3), suggesting intramolecular charge transfer emission for these compounds in solution.45


image file: c6ra02417c-f2.tif
Fig. 2 Steady state emission spectra of compounds 8 (left) and 9 (right) in different solvents (10−5 M concentration) at room temperature (λex: 380 nm).

image file: c6ra02417c-f3.tif
Fig. 3 Normalised emission spectra of compounds 8 (left) and 9 (right) in different solvents (10−5 M concentration) at room temperature (λex: 380 nm).

As compound 9 contains ESIPT unit, it was expected to have different emission pattern than compound 8. However, the emission patterns of the compounds 9 and 8 are almost identical. In non-polar solvents (toluene and chloroform), 9 showed emission maxima at 450 and 474 nm, red-shifting gradually at 483 nm in moderately polar solvent (THF) and at 525 and 533 nm in polar solvents (acetonitrile and DMSO). These emissions are due to cis-enol emission or cis-keto emission (ESIPT) or intramolecular charge transfer emissions? The identical emission pattern of the ESIPT compound 9 and non-ESIPT compound 8 suggests that the emissions of the compound 9 would be due to ICT emission but not due to ESIPT process. Emission spectra of compound 9 in different solvents indicate that intramolecular charge transfer is dominating over ESIPT process. To understand the emission properties of the compound 9, systematic studies have been performed to control ICT process over ESIPT. Initially, considering difference in basicity of amine nitrogen and thiazole nitrogen, effect of acidity on absorption and emission properties were studied by assuming stepwise protonation mechanism of nitrogen atoms (i.e. protonation of TPA nitrogen first which would block the intramolecular charge transfer (ICT) and ESIPT process would be expected). However, the absorption and emission spectra of compound 9 in presence of different equivalent of TFA indicates that protonation occur simultaneously (Fig. 4) instead of stepwise. In absence of TFA, 9 showed absorption bands at ∼290 and ∼390 nm, while upon increase in concentration of TFA the intensity of 290 nm band slightly decrease with red shift and intensity of 394 nm significantly decreases with blue shift in absorption. Appearance of new band with gradual increase of TFA was observed at 490 nm with isosbestic point at 353 and 425 nm with 394 nm absorption band. New absorption peak at 490 nm can be assigned to protonated species of compound 9 (Scheme S1).


image file: c6ra02417c-f4.tif
Fig. 4 (Left) Absorption spectra, (right) emission spectra of compound 9 in presences of various eq. of TFA; (10−5 M concentration, room temperature); λex: 380 nm.

In case of emission spectra, the fluorescence intensity decreases gradually (Fig. 4) upon addition of TFA and compound 9 became non fluorescent at high concentration of TFA without piece of information about presence of ESIPT process (Fig. S3). To have more understanding of ICT versus ESIPT emission in compound 9 another control experiment was performed by addition of electron acceptor (DDQ) compound which would participate in intermolecular charge transfer between TPA and DDQ and will control the intramolecular charge process. TPA is electron rich unit and DDQ is more electron deficient unit. Charge complexes can be formed by combinations of particular donor with acceptor.46 UV-visible and fluorescence spectra were recorded for compound 9 in presence of various amount of DDQ (Fig. S4). The absorption, emission intensity and wavelength of compound 9 remain same even after addition of 10 eq. of DDQ. These results conclude that intermolecular charge transfer process is not occurring between TPA and DDQ and observed emission is due to intermolecular charge transfer from TPA to BT unit. ICT or ESIPT emission for 9 is still under investigation.

Both the compounds are highly emissive in solvents of different polarity with very high fluorescence quantum efficiencies. In non-polar (Φf: 86–88% and Φf: 75–80% for 8 and 9 resp.) and moderately polar (Φf: 85% for 8 and Φf: 75% for 9) solvents compounds show high fluorescence quantum efficiencies in comparison to polar solvents (Φf: 75–78% for 8 and Φf: 67–69% for 9) indicating a better stabilization of the emitting species in non-polar or THF solvents. The slight quenching of quantum efficiencies in polar solvents may be due to slight twisting of the donor acceptor units in the excited state due to high solvent polarity which is a common characteristic of the molecules exhibiting high dipole moment in the excited state.47

Similar to emission properties in the solvents, compounds 8 and 9 are also emissive in the solid state. The emission spectra of the compounds 8 and 9 in the solid state are shown in Fig. 5 and S5. In solid state compounds 8 and 9 emit at 493 and 490 nm respectively, which is red shifted emission in comparison to non-polar solvents and blue shifted in comparison to polar solvents. The fluorescence images of the compounds 8 and 9 in solution, solid state and in film state are shown in Fig. 6.


image file: c6ra02417c-f5.tif
Fig. 5 Solid state emission of compounds 8 and 9 (λex: 380 nm).

image file: c6ra02417c-f6.tif
Fig. 6 Day light and UV light images (365 nm) of the compounds in solid state, in solution (chloroform) and on film (quartz).
Aggregation induced emission (AIE) study. In literature TPA based derivatives were reported as AIE active molecules.12 To examine whether compounds 8 and 9 are AIE active or not, aggregation induced emission study was performed for both the compounds. Mixture of THF and water was used for preparation of nanoaggregates by increasing the percentage of water in the THF solution. The results of AIE study are summarized in Fig. 7–10 and S6 and Table S1. In THF, compounds 8 and 9 show absorption maxima at 389 and 394 nm and emission maxima at 478 and 483 nm respectively. The absorption maxima remain same in the presence of water fraction ranging from 10–60% for both the compounds, which are similar to absorption in pure THF (Fig. 7). When water fraction (fw) is further increased to 70%, compounds showed red shifted absorption (Mie light scattering)48 with significant drop in the absorption intensity (Fig. S6). These observations suggest that molecules begin to aggregate at 70% water:THF composition. In case of emission spectra, with the increase of water percentage from 10–60%, the compounds showed red-shifted emission from 478 nm to 516 nm for compound 8 and from 483 nm to 511 nm for compound 9 with gradual decrease of fluorescence intensity (Fig. 8 and 9). This change in the emission properties are not due to aggregation but attributed due to the increase of solvent polarity.49 In this process interaction between solutes and polar solvents facilitate the intermolecular charge transfer effect.50 When the water fraction (fw) further increased from 70 to 95%, the fluorescence emission was blue shifted from 519 nm to 484 nm for the compound 8 and from 511 nm to 480 nm for the compound 9 (Fig. 9).
image file: c6ra02417c-f7.tif
Fig. 7 Normalised absorption spectra of compounds 8 (left) and 9 (right) in THF and THF–water mixture (10−5 M concentration, room temperature, water fraction (vol%)).

image file: c6ra02417c-f8.tif
Fig. 8 Emission spectra of compounds 8 (left) and 9 (right) in THF and THF–water mixture (10−5 M concentration, room temperature, λex: 380 nm, water fraction (vol%)).

image file: c6ra02417c-f9.tif
Fig. 9 Normalised emission spectra of compounds 8 (left) and 9 (right) in THF and THF–water mixture (10−5 M concentration, room temperature, λex: 380 nm, water fraction (vol%)).

This blue shifted emission with increase in the fluorescence intensity is assigned to formation of aggregates by suppression of ICT effect.51 Compounds 8 and 9 exist in aggregate state when the water percentage is more than 60% (fw ≥ 60%). In this state, ICT process cannot be stabilized due to hydrophobic environment generated in the aggregate state which suppresses the ICT process.50 The fluorescence intensity is high at 80% water fraction, but it again decreases in 90 and 95% water (Fig. 10). This can be assigned to formation of more nanocrystalline particles at 80% water fraction and in random agglomerate at 90 and 95% water fraction. This change in fluorescence behavior is due to the change in the packing mode of molecules in the aggregates.52 At 80% water fraction, the molecules may steadily assemble in an ordered fashion to form more emissive crystalline aggregates. In the mixture with 90–95% water fraction, however, the molecules may quickly agglomerate in a random way to form less emissive smaller (amorphous) particles. Amorphous particles cause lowering of fluorescence intensity while crystalline particles leads to enhancement.52 This observation concludes that both the compounds are AIE active. In aggregate state, ∼20 nm red shift in absorption was observed due to formation of J-type of aggregates which is a typical characteristic of J-aggregation10–12 (Fig. 7). In order to confirm type of molecular packing for compounds 8 and 9 many attempts were performed to develop single crystal in different solvents/mixture of solvents but we were unable to obtain single crystals suitable for X-ray analysis. However, optimized structures by DFT computations to support this observation are discussed in next section. The phase transition from crystalline to amorphous in aggregate state may be the probable reason for quenching of fluorescence quantum efficiencies in the solid state. The amorphous nature of the compounds in solid state is confirmed by powder-XRD measurement Fig. 11 and S7. The powder XRD result concludes that compound 9 is comparatively more amorphous in nature than compound 8.


image file: c6ra02417c-f10.tif
Fig. 10 Fluorescence intensity versus percentage of water fraction.

image file: c6ra02417c-f11.tif
Fig. 11 Powder-XRD data of compounds 8 and 9.

Structural properties

The morphological transitions of the compounds 8 and 9 were studied by differential scanning calorimetry (DSC) technique. DSC analysis was performed on the pure solid materials under nitrogen atmosphere. The DSC curves of the compounds are shown in Fig. 12. In the first heating cycle, compound 8 showed a significant melting endothermic peak at 209 °C. However compound 9 did not show endothermic transition upto 300 °C for both the DSC cycles Fig. S8. The DSC results of compound 9 indicates that compound 9 did not show any phase transition for two successive heating and cooling DSC cycles and remained in glass state (amorphous state). The powder-XRD results of the compound 9 supports this experimental finding about phase transition. In case of compound 8, after melting endothermic transition at 209 °C, it remained in glass state even after cooling to room temperature and further second heating cycle. However, during cooling process of DSC second cycle a small exothermic peak was observed at 150 °C. This may be due to slight change within the glass state. The DSC data concludes that the phase transition in compound 8 is irreversible (crystalline → amorphous) while compound 9 did not show phase transition.
image file: c6ra02417c-f12.tif
Fig. 12 DSC heating and cooling cycles for compounds 8 and 9 (left) first cycle; (right) second cycle.

Theoretical calculations

Geometries and molecular orbitals. To have a better insight into structural properties and intramolecular charge transfer emission process, the density functional theory (DFT) computations were performed. The structures of the compounds were optimised using B3LYP functional and 6-31 G(d,p) basis set.53 Compounds 8 and 9 were optimized in gas phase and these optimised structures were used for structural parameter investigations and energies of molecular orbitals. The molecular orbitals of both the compounds are shown in Fig. 13. Only the highest occupied and lowest unoccupied orbitals are presented here. The orbital distribution was similar for the molecules. The HOMOs of both the compounds are localized entirely on the TPA core and LUMOs on BT and part of TPA core. This better charge separation indicates that a typical intramolecular charge transfer (ICT) effect is observed from TPA unit to BT unit.54 This supports the emission behavior of compounds in solvents of different polarities. The HOMO–LUMO gap of compounds 8 and 9 are 3.31 eV and 3.23 eV respectively which are almost identical. This also supports the evidence for identical absorption spectra of the compounds.
image file: c6ra02417c-f13.tif
Fig. 13 Frontier molecular orbitals with energies (HOMO and LUMO) of compounds 8 and 9.

Optimized geometries of both the compounds are shown in Fig. S9. Both the compounds adopt twisted conformations. The torsion between any two phenyl rings in TPA core is ∼40°. Such twisted and non-planar conformations would hamper the strong π–π stacking which enable to emit the molecules in the condensed state efficiently. The TPA core and benzothiazole core of both the molecules are slightly twisted (θ ∼ 30°), which makes the chromophores moderately conjugated, which results in efficient intramolecular charge transfer process within the system. In short, twisted co-planar conformations make these molecules emissive in solid and aggregated states. Compounds 8 and 9 contain two benzothiazole units attached to TPA core. The orbital distribution of HOMOs and LUMOs conclude that transfer of charge density from TPA to BT units takes place simultaneously. Compound 8 is symmetrical V-shaped framework contain same acceptor groups on TPA core, hence charge transfer probability is equal for both the side as confirmed by Mulliken charge distribution (Fig. S10). However, in case of compound 9, acceptors are different. As confirmed by HOMO and LUMOs, charge transfer takes place for both the side but may not be in equal probability. Mulliken charge distribution also suggest that BT unit with –OH group at 2 position is comparatively strong acceptor (N: −0.617|e|) than BT unit with –OCOCH3 group (N: −0.505|e|) (Fig. S10).

Conclusion

In summary, we designed and synthesized two A–D–A molecules with triphenylamine as a donor and benzothiazole as an acceptor. Compounds 8 and 9 showed strong positive solvatochromism of the emission with ∼80 nm red shift (nonpolar → polar solvents). The AIE study reveals that compounds are AIE active and aggregates with J-type of aggregations when the percentage of water is ≥70%. The compounds are highly emissive in solution, aggregate and solid state. Both the compounds have large HOMO–LUMO gaps (∼3.23 to 3.31 eV) as confirmed by DFT computations. Twisting, non-planar conformation hampers the strong π–π stacking resulting in emissive nature of compounds in aggregate and solid state. These compounds emit in the same region just as emission wavelength in solution which overcomes the limitation of traditional D–A chromophores (red shift in solid state with ACQ). Compound 9 show halochromic property in presence of TFA. Large Stokes shift, solvent dependent emission properties, halochromism and high fluorescence quantum yields would be exciting candidates for functional materials.

Acknowledgements

V. S. P. and D. S. thank the JSPS Research Fellowship. This work was partly supported by a Grant-in-Aid for Scientific Research (No. 2604063, 26102011, 26810023, 26102001) from the Japan Society for the Promotion of Science (JSPS).

Notes and references

  1. L. Xiao, Z. Chen, B. Qu, J. Luo, S. Kong, Q. Gong and J. Kido, Adv. Mater., 2011, 23, 926–952 CrossRef CAS PubMed.
  2. T. M. Figueira-Duarte and K. Müllen, Chem. Rev., 2011, 111, 7260–7314 CrossRef CAS PubMed.
  3. S. Silvi and A. Credi, Chem. Soc. Rev., 2015, 44, 4275–4289 RSC.
  4. J. Yao, M. Yang and Y. Duan, Chem. Rev., 2014, 114, 6130–6178 CrossRef CAS PubMed.
  5. J. A. Cotruvo, A. T. Aron, K. M. Ramos-Torres and C. J. Chang, Chem. Soc. Rev., 2015, 44, 4400–4414 RSC.
  6. R. T. K. Kwok, C. W. T. Leung, J. W. Y. Lam and B. Z. Tang, Chem. Soc. Rev., 2015, 44, 4228–4238 RSC.
  7. X. Feng, L. Liu, S. Wang and D. Zhu, Chem. Soc. Rev., 2010, 39, 2411–2419 RSC.
  8. X. Ma, R. Sun, J. Cheng, J. Liu, F. Gou, H. Xiang and X. Zhou, J. Chem. Educ., 2016, 93, 345–350 CrossRef CAS.
  9. R. Jakubiak, J. Phys. Chem. A, 1999, 103, 2394–2398 CrossRef CAS.
  10. J. Mei, Y. Hong, J. W. Y. Lam, A. Qin, Y. Tang and B. Z. Tang, Adv. Mater., 2014, 26, 5429–5479 CrossRef CAS PubMed.
  11. Y. Hong, J. W. Y. Lam and B. Z. Tang, Chem. Soc. Rev., 2011, 40, 5361–5388 RSC.
  12. J. Mei, N. L. C. Leung, R. T. K. Kwok, J. W. Y. Lam and B. Z. Tang, Chem. Rev., 2015, 115, 11718–11940 CrossRef CAS PubMed.
  13. N. Zhao, J. W. Y. Lam, H. H. Y. Sung, H. M. Su, I. D. Williams, K. S. Wong and B. Z. Tang, Chem.–Eur. J., 2014, 20, 133–138 CrossRef CAS PubMed.
  14. R. Hu, J. W. Y. Lam, J. Liu, H. H. Y. Sung, I. D. Williams, Z. Yue, K. S. Wong, M. M. F. Yuen and B. Z. Tang, Polym. Chem., 2012, 3, 1481–1489 RSC.
  15. Z. Zhao, J. W. Y. Lam and B. Z. Tang, J. Mater. Chem., 2012, 22, 23726–23740 RSC.
  16. Y. Li, L. Xu and B. Su, Chem. Commun., 2012, 48, 4109–4111 RSC.
  17. E. Wang, J. W. Y. Lam, R. Hu, C. Zhang, Y. S. Zhao and B. Z. Tang, J. Mater. Chem. C, 2014, 2, 1801–1807 RSC.
  18. D. Zhao, F. Fan, J. Cheng, Y. Zhang, K. S. Wong, V. G. Chigrinov, H. S. Kwok, L. Guo and B. Z. Tang, Adv. Opt. Mater., 2015, 3, 199–202 CrossRef CAS.
  19. Z. Chi, X. Zhang, B. Xu, X. Zhou, C. Ma, Y. Zhang, S. Liu and J. Xu, Chem. Soc. Rev., 2012, 41, 3878–3896 RSC.
  20. Y. Hong, S. Chen, C. W. T. Leung, J. W. Y. Lam and B. Z. Tang, Chem.–Asian J., 2013, 8, 1806–1812 CrossRef CAS PubMed.
  21. Y. Hong, L. Meng, S. Chen, C. W. T. Leung, L.-T. Da, M. Faisal, D.-A. Silva, J. Liu, J. W. Y. Lam, X. Huang and B. Z. Tang, J. Am. Chem. Soc., 2012, 134, 1680–1689 CrossRef CAS PubMed.
  22. C. Zhang, S. Jin, K. Yang, X. Xue, Z. Li, Y. Jiang, W.-Q. Chen, L. Dai, G. Zou and X.-J. Liang, ACS Appl. Mater. Interfaces, 2014, 6, 8971–8975 CAS.
  23. N. Zhao, M. Li, Y. Yan, J. W. Y. Lam, Y. L. Zhang, Y. S. Zhao, K. S. Wong and B. Z. Tang, J. Mater. Chem. C, 2013, 1, 4640–4646 RSC.
  24. E. Zhao, Y. Hong, S. Chen, C. W. T. Leung, C. Y. K. Chan, R. T. K. Kwok, J. W. Y. Lam and B. Z. Tang, Adv. Healthcare Mater., 2014, 3, 88–96 CrossRef CAS PubMed.
  25. Y. Yuan, G. Feng, W. Qin, B. Z. Tang and B. Liu, Chem. Commun., 2014, 50, 8757–8760 RSC.
  26. J. Luo, Z. Xie, J. W. Y. Lam, L. Cheng, B. Z. Tang, H. Chen, C. Qiu, H. S. Kwok, X. Zhan, Y. Liu and D. Zhu, Chem. Commun., 2001, 381, 1740–1741 RSC.
  27. V. S. Padalkar and S. Seki, Chem. Soc. Rev., 2016, 45, 169–202 RSC.
  28. X. Qian, Y. Z. Zhu, J. Song, X. P. Gao and J. Y. Zheng, Org. Lett., 2013, 15, 6034–6037 CrossRef CAS PubMed.
  29. J. Yang, P. Ganesan, J. Teuscher, T. Moehl, Y. J. Kim, C. Yi, P. Comte, K. Pei, T. W. Holcombe, M. K. Nazeeruddin, J. Hua, S. M. Zakeeruddin, H. Tian and M. Grätzel, J. Am. Chem. Soc., 2014, 136, 5722–5730 CrossRef CAS PubMed.
  30. S. Haid, M. Marszalek, A. Mishra, M. Wielopolski, J. Teuscher, J. E. Moser, R. Humphry-Baker, S. M. Zakeeruddin, M. Grätzel and P. Bäuerle, Adv. Funct. Mater., 2012, 22, 1291–1302 CrossRef CAS.
  31. N. Zhou, K. Prabakaran, B. Lee, S. H. Chang, B. Harutyunyan, P. Guo, M. R. Butler, A. Timalsina, M. J. Bedzyk, M. A. Ratner, S. Vegiraju, S. Yau, C.-G. Wu, R. P. H. Chang, A. Facchetti, M.-C. Chen and T. J. Marks, J. Am. Chem. Soc., 2015, 137, 4414–4423 CrossRef CAS PubMed.
  32. S. Qu, C. Qin, A. Islam, Y. Wu, W. Zhu, J. Hua, H. Tian and L. Han, Chem. Commun., 2012, 48, 6972–6974 RSC.
  33. W. Ying, F. Guo, J. Li, Q. Zhang, W. Wu, H. Tian and J. Hua, ACS Appl. Mater. Interfaces, 2012, 4, 4215–4224 CAS.
  34. W. Zhu, Y. Wu, S. Wang, W. Li, X. Li, J. Chen, Z. S. Wang and H. Tian, Adv. Funct. Mater., 2011, 21, 756–763 CrossRef CAS.
  35. H.-Y. Wang, G. Chen, X.-P. Xu and S.-J. Ji, Synth. Met., 2010, 160, 1065–1072 CrossRef CAS.
  36. P. E. D. Acceptor, R. V. April, V. Re, M. Recei and V. August, Chem. Mater., 2005, 17, 2004–2006 Search PubMed.
  37. Y. Liu, S. Chen, J. W. Y. Lam, P. Lu, R. T. K. Kwok, F. Mahtab, H. S. Kwok and B. Z. Tang, Chem. Mater., 2011, 23, 2536–2544 CrossRef CAS.
  38. W. Z. Yuan, P. Lu, S. Chen, J. W. Y. Lam, Z. Wang, Y. Liu, H. S. Kwok, M. Yuguang and B. Z. Tang, Adv. Mater., 2010, 22, 2159–2163 CrossRef CAS PubMed.
  39. R. Hu, E. Lager, A. Aguilar-Aguilar, J. Liu, J. W. Y. Lam, H. H. Y. Sung, I. D. Williams, Y. Zhong, K. S. Wong, E. Peña-Cabrera and B. Z. Tang, J. Phys. Chem. C, 2009, 113, 15845–15853 CAS.
  40. C. Y. K. Chan, J. W. Y. Lam, Z. Zhao, S. Chen, P. Lu, H. H. Y. Sung, H. S. Kwok, Y. Ma, I. D. Williams and B. Z. Tang, J. Mater. Chem. C, 2014, 2, 4320–4327 RSC.
  41. V. S. Padalkar, D. Sakamaki, N. Tohnai, T. Akutagawa, K. Sakai and S. Seki, RSC Adv., 2015, 5, 80283–80296 RSC.
  42. A. Douhal, F. Lahmani and A. H. Zewail, Chem. Phys., 1996, 207, 477–498 CrossRef CAS.
  43. Y. H. Kim, S.-G. Roh, S.-D. Jung, M.-A. Chung, H. K. Kim and D. W. Cho, Photochem. Photobiol. Sci., 2010, 9, 722–729 CAS.
  44. K. Anthony, R. G. Brown, J. D. Hepworth, K. W. Hodgson, B. May and M. A. West, J. Chem. Soc., Perkin Trans. 2, 1984, 2111–2117 RSC.
  45. C. H. Zhao, A. Wakamiya, Y. Inukai and S. Yamaguchi, J. Am. Chem. Soc., 2006, 128, 15934–15935 CrossRef CAS PubMed.
  46. N. S. S. Kumar, M. D. Gujrati and J. N. Wilson, Chem. Commun., 2010, 46, 5464–5466 RSC.
  47. G. Singh, V. Bhalla and M. Kumar, Phys. Chem. Chem. Phys., 2015, 17, 22079–22089 RSC.
  48. H. Auweter, H. Haberkorn, W. Heckmann, D. Horn, E. Lüddecke, J. Rieger and H. Weiss, Angew. Chem., Int. Ed. Engl., 1999, 38, 2188–2191 CrossRef CAS.
  49. W. Qin, D. Ding, J. Liu, W. Z. Yuan, Y. Hu, B. Liu and B. Z. Tang, Adv. Funct. Mater., 2012, 22, 771–779 CrossRef CAS.
  50. Z.-Q. Liang, X.-M. Wang, G.-L. Dai, C.-Q. Ye, Y.-Y. Zhou and X.-T. Tao, New J. Chem., 2015, 39, 8874–8880 RSC.
  51. Y. Zhang, J. Sun, G. Bian, Y. Chen, M. Ouyang, B. Hu and C. Zhang, Photochem. Photobiol. Sci., 2012, 11, 1414–1421 CAS.
  52. M. Yang, D. Xu, W. Xi, L. Wang, J. Zheng, J. Huang, J. Zhang, H. Zhou, J. Wu and Y. Tian, J. Org. Chem., 2013, 78, 10344–10359 CrossRef CAS PubMed.
  53. M. Frish, H. B. Trucks, H. B. Schlegel, G. S. Scuseria, M. A. Robb, J. R. Cheeseman, G. Scalmani, V. Barone, B. Mennucci and G. A. Paterson, Guassian 09, revision 02, Inc, Wallingford CT, 2009, p. 34.
  54. Z. R. Grabowski, K. Rotkiewicz and W. Rettig, Chem. Rev., 2003, 103, 3899–4031 CrossRef PubMed.

Footnotes

Electronic supplementary information (ESI) available: Optical properties, powder-XRD data, DSC data and DFT optimised structures of compounds 8 and 9. See DOI: 10.1039/c6ra02417c
Investigation of intramolecular charge transfer emission over ESIPT emission is still under study for compound 9.

This journal is © The Royal Society of Chemistry 2016
Click here to see how this site uses Cookies. View our privacy policy here.