Polyethylenimine incorporation into hydrogel nanomatrices for enhancing nanoparticle-assisted chemotherapy
Teppei Shirakura†
,
Aniruddha Ray‡
and
Raoul Kopelman*
Biophysics and Chemistry, The University of Michigan, 930 N. University Avenue, Ann Arbor, MI 48109-1055, USA. E-mail: kopelman@umich.edu
First published on 9th May 2016
Abstract
The efficacy of drug-loaded nanoparticles (NPs) for cancer therapy is related to (1) the cellular uptake of the NPs, (2) the ability to control drug release, and (3) the ability to deliver drugs to the cytosol, while evading the endosomal compartments. Here we present a NP carrier of cisplatin, made of poly(acrylamide-co-N-(3-aminopropyl)methacrylamide) (PAA) and a branched polyethylenimine (PEI), a source of primary, secondary, as well as tertiary amine groups. We found that (1) the cellular uptake of the NPs was highly enhanced by the PEI incorporation. However, surprisingly, this is not due to significant changes to the NP surface charge (zeta potential). Also, the PEI-incorporation into the PAA NPs resulted in (2) an accelerated release kinetics, (3) an ability to destabilize the endosomal/lysosomal membrane, and (4) a marginal increase in drug loading. The combination of the 4 aforementioned effects seems to account for the observed significant increase in the cytotoxicity of these cisplatin-loaded PEI-incorporated NPs, when applied to the 9L glioma cell line.
Introduction
Chemotherapy is one of the most widely used forms of cancer treatment.1 It is noninvasive, and can be used for various types of tumors, especially those that are difficult to treat with surgery, or do not respond to radiation therapy. However, it is also known that chemotherapy is usually accompanied by serious side effects, especially by damaging healthy cells that are rapidly dividing, due to high systemic doses of the drug and its nonspecificity.1,2 In order to reduce adverse side effects, it is necessary to deliver the chemotherapeutic agents selectively to the tumor areas, i.e., achieve a high local dose at the tumor site, with still a low systemic dose. Achieving a high therapeutic index is thus one of the key challenges in chemotherapy.3Nanoparticle (NP)-based chemotherapy has been a widely used strategy to achieve selective delivery of drugs to the tumor tissues. The NPs can accumulate in the tumor tissue, due to their intrinsic “passive targeting” property, the so-called enhanced permeability and retention effect,4,5 i.e., enhanced crossing of the endothelial barrier in the tumor's anomalous vasculature, as well as due to their enabling “active targeting”, using surface moieties, such as antibodies, peptides and aptamers, which target cancer cells specifically and selectively.6–8 Thus, by embedding the antitumor drugs inside the biocompatible NPs, the selectivity of the drug delivery to the tumor can be enhanced. Additionally, the drug molecules inside the NPs cannot interact with non-cancerous cells in the body until they are released from these NPs.2 By loading them inside the NPs, some of the drug molecules themselves can be protected from degradation due to plasma enzymes.2,9
Several crucial factors govern the efficacy of these NPs, such as cellular uptake, controlled release of drugs, and delivery of the drugs close to their site of action. First, the cellular uptake is an important property of the NPs' design. The higher the amount of NPs that are taken up by the cells, the more drug molecules that can be delivered, leading to higher cytotoxicity.10
Controlling the drug release so that it occurs after the NPs are internalized is another key aspect of the NPs' design.11 Cisplatin molecules that are released outside cells have a low probability of entering the cells.12 Additionally, these drug molecules are subject to being pumped out from the cells, through the drug efflux transporters on the cellular membrane, leading to the multidrug resistant (MDR) effect.13 However, it has been previously shown that these phenomena can be overcome to some extent by using NPs as drug carriers.9,14 Several strategies have been utilized for a triggered release, such as by thermally,11 pH15 and photochemically16,17 triggered release systems.
Also, delivery of the drug to a specific subcellular location may enhance its efficacy.18 Drugs are mostly designed to work on a particular sub-cellular compartments, such as the nucleus, mitochondria, etc., and, thus the degree of delivery to the particular organelle determines its efficacy as well.18 NPs are often localized within cellular vesicles, such as endosomes and lysosomes, and various techniques have been proposed to transfer the NPs out into the cytosol for even more precise delivery (so-called endosomal escape).18 Conversely, it may be advantageous for the NPs to avoid certain organelles, such as lysosomes, and get close to the perinuclear environment.19 Therefore to deliver high concentrations of NPs into the cells and even closer to the site of action, without being affected much by the efflux transporters, it is important to develop nanoparticles with high efficiency of cellular uptake.
One of the common strategies researchers have taken to increase the cellular uptake is to make the surface of these NPs positive.10 Because the cellular membrane is negatively charged, coating with positively charged chemical groups, e.g. amines, helps NPs in binding to the surface of the cells; thus more positively charged NPs can be taken-up more effectively by cells.20 Also, the amine-functionalization onto the surface is important, not only because of the electrostatic interactions between the NPs and cells, but also because the interaction with serum proteins plays an important role. It was reported that the cellular uptake is significantly higher in the presence of albumin, in case of amine-functionalized NPs, while the cellular uptake was significantly suppressed in case of carboxyl-functionalized NPs.21
Previously, amine-functionalized polyacrylamide based NPs were developed for diagnostics and therapeutic applications, both at the in vivo and in vitro level.22,23 These amine-functionalized PAA NPs showed good cellular uptake, as well as good delivery of dyes, contrast agents and drugs.22–24 However, while the primary amine-containing acrylate monomer, N-(3-aminopropyl)methacrylamide, which was used in those applications, increases the cellular uptake, its fraction in the NP formulation is limited, due to the problematic solubility of the primary amine-containing acrylate monomer.
In this work, we explore a hypothesized method for improving the efficacy of the drug-loaded hydrogel NPs by making a hybrid matrix of polyacrylamide and polyethylenimine (PEI). PEI is a commonly used cationic polymer that has been widely used as a DNA and RNA carrier for gene therapy both in vitro and in vivo, especially the branched polymer with molecular weight of 25 kDa.25–27 These polymers have also been shown to facilitate the above mentioned cytosolic delivery in cells by escaping from vesicles such as endosomes and lysosomes.25,26 However, the 25 kDa branched PEI itself is known to be somewhat toxic, due to the high positive charge on its surface, which leads to a cell-specific cause of apoptosis, such as mitochondrial damage.26,28 By incorporating PEI into PAA NPs, we expect our formulation to have (1) an increase in the therapeutic efficacy, due to the higher uptake attributed to the abundant amines from PEI; (2) a reduction in the toxicity effects of PEI in the NPs, using full/partial coverage by the polyacrylamide matrix; (3) an exploitation of the intrinsic advantages of PEI, such as the ability to cause the proton sponge effect followed by the endosomal escape.29 Developing NPs with the ability to escape from the endosomes/lysosomes can further enhance the efficacy, by increasing the time over which the NPs stay inside the cells, thereby overcoming NP exocytosis, while the higher cellular uptake increases the drug concentration in the cell.10 Thus, NPs having both higher cellular uptake and higher endosomal escape should synergistically increase the drug efficacy.
Experimental
Materials
Cisplatin was purchased from Selleck Chemical LLC. RPMI media was purchased from Invitrogen. Calcein was purchased from ICN Biomedicals Inc. Alexa 647 NHS ester was purchased from Thermo Scientific. RPMI was purchased from Life Technologies. All other chemicals were purchased from Sigma-Aldrich. The de-ionized water used in this experiment was purified prior to the experiment, using a Milli-Q system from Millipore.PEI-PAA NPs synthesis
NPs were synthesized utilizing the standard protocol of polyacrylamide-based nanoparticles in the Kopelman group.8 In brief, NPs were synthesized utilizing the reverse micelle microemulsion polymerization.30 Acrylamide, N-(3-aminopropyl)methacrylamide hydrochloride, 3-(acryloyloxy)-2-hydroxypropyl methacrylate, and PEI were dissolved in 1.3 mL water. Then, the solution was mixed with 45 mL of argon-purged hexane, containing 1.6 g of sodium dioctyl sulfosuccinate, as well as Brij30. The amount of Brij30 was varied, depending on the formulation of NPs, so as to increase the stability of the NPs: in case of PAA, 3.47 mL of Brij30 was added; in case of L-PEI PAA, 4.47 mL of Brij30 was added; in case of H-PEI PAA, 5.27 mL of Brij30 was added; and in case of NPs with higher PEI incorporation, 5.47 mL of Brij30 was added. After 20 minutes of further argon-purging, 100 μL of 10 w/v% of ammonium persulfate and N,N,N′,N′-tetramethylethylenediamine were added to the mixture, so as to initiate the polymerization. The reaction was complete in 2 hours. Hexane was removed by a rotary evaporator, and the remaining product was washed 5 times with 175 mL of ethanol and 150 mL of water, using an Amicon filtration system (Millipore). The NPs suspension was lyophilized, and stored at −20 °C, for further investigation.Loading of Alexa 647
0.1 mg of Alexa 647 NHS ester was mixed with 40 mg of PAA in 4 mL of PBS (pH 7.4) and left overnight. Then, the free Alexa 647 was removed from the solution by washing the NPs, using a centrifugal filter (100 kDa MWCO, from Millipore), 7 times. For the PEI-NPs, Alexa 647-labeled PEI was used during the synthesis of the NPs.Conjugation of triphenylphosphonium (TPP)
TPP was conjugated to the surface of the NPs in the following method. For each 10 mg of NPs, 21.4 mg of EDC, and 48.0 mg of (3-carboxypropyl)triphenylphosphonium bromide (CTPB) were mixed in 1.5 mL PBS and 0.5 mL DMSO. The reaction mixture was stirred overnight, and washed with the centrifugal filter (100 kDa MWCO). The final product was concentrated to 20 mg mL−1 for further investigation.Loading of cisplatin
Cisplatin was loaded into the blank nanoparticle carrier, post synthesis of the hydrogels, by mixing the two in aqueous solution.11 Briefly, 1 mg of cisplatin was mixed with 10 mg of PEI-PAA NPs, in deionized water, and incubated for 3 days. Then, the NPs were washed with 7 mL of water 7 times, using a centrifugal filter (100 kDa MWCO). Cisplatin content was measured using inductively coupled plasma optimal emission spectroscopy (ICP-OES) (Perkin-Elmer Optima 2000 DV).Loading of calcein
Calcein was post-loaded. 1–2 mg calcein was added to 50 mg of PEI-PAA NPs in water, and stirred for 6 hours. After post-loading, the mixture was washed using the centrifugal filter (100 kDa MWCO) and used for imaging.Transmission electron microscopy (TEM) of NPs
0.01 mg mL−1 of NPs were mounted to carbon coated grid, and stained with uranyl acetate. TEM image was taken using Philips CM-100 transmission electron microscope.Dynamic Light Scattering
Hydrodynamic size of the NPs (2 mg mL−1) in PBS (pH 7.4) and zeta-potential in water were measured using Delsa Nano C (Beckman Coulter).Cytotoxicity assay
A rat glioma cell line, 9L was cultivated in RPMI, with addition of certified heat inactivated fetal bovine serum (10%) and penicillin, streptomycin and glutamine (1%). The 9L cells were transferred to a 96-well plate with a cell population of 2000 cells per well. 100 μL of complete RPMI was added to each well. After 24 hour incubation, 20 μL of NP suspension in PBS was added to the wells, to evaluate the cytotoxicity. After 12 hours incubation, NPs in the cell media were removed, and the cells were rinsed twice with 100 μL per well of Dulbecco's phosphate buffered saline (DPBS). Then, 200 μL of complete RPMI was added, and incubated for another 48 hours. After the incubation, the cell media was removed from the wells, and 120 μL of 0.833 mg mL−1 of MTT reagent in RPMI, without phenol red, was added. After 4 hours incubation, the media was removed and 100 μL of dimethylsulfoxide was added. 1 hour later, the absorbance from the wells was measured, using a microplate reader (Anthos 2010, Biochrom).Pt uptake assay
The 9L cells were cultivated in a 100 × 20 mm Petri dish. When the confluency reached 80%, the cell media was removed, and 5 mL of fresh complete RPMI, and 700 μL of 25 μg mL−1 cisplatin-loaded NPs were added. After 12 hours incubation, NPs that were not uptaken by the cells were removed, and the cells were rinsed twice with 5 mL of DPBS. The cells were trypsinized, and the population counted. After that, the cells were digested by soaking cells in 70% nitric acid, for 2 days. The cisplatin contents of the cells were measured, using ICP-OES.F3-PEG conjugation
The F3 peptide and polyethylene glycol (PEG) were conjugated onto the surface of the NPs, following a procedure previously described.31 Briefly, 10 mg of NPs were conjugated with 2.2 mg of F3 peptide, using 0.8 mg of Mal-PEG(2k)-NHS as a cross-linker. All the reactions were performed in PBS.Fluorescence microscopy
The fluorescence microscopy was performed using a Leica confocal microscope (SP-5X), located at the Microscopy image analysis Lab, University of Michigan. This microscope has a wide range of excitation source including 405 nm, 455 nm, and 480–600 nm. The fluorescence emission was detected using a CCD camera ranging and the appropriate wavelength range can be selected using an acousto-optic tunable filter. The pH measurements were taken with the diode laser at 405 nm and the white light laser at 450 nm, and the fluorescence emission was detected at 510 nm. The lysotracker and mitotracker were irradiated at 577 nm and 579 nm, respectively, whereas the fluorescence emission was detected at 590 nm and 599 nm, respectively.Lysotracker
The 9L cells were plated on a glass bottom Petri dish (Mat Tek) and grown for a few days before incubation with NPs. The nanoparticles were incubated with the cells at 0.5 mg mL−1 final concentration for 2 hour and then washed with fresh buffer, three times, to remove any unbound NP. The cells with NP were further allowed to grow for 48 hours before being used for imaging. Then the cells were treated with a lysosomal staining probe, lysotracker red DNB-99 for 10 minutes. The excess lysotrakcer probe was removed by washing with colorless RPMI media one more time.Statistical analysis
IC50 values were calculated using trend line function of Microsoft Excel. Statistical analysis of the data was performed using GraphPad Prism 6.05.Results and discussion
Two types of PEI-PAA NPs were synthesized, with higher and lower PEI concentration (H and L PEI, respectively). H-PEI PAA contains more PEI in the NPs than L-PEI PAA (Scheme 1).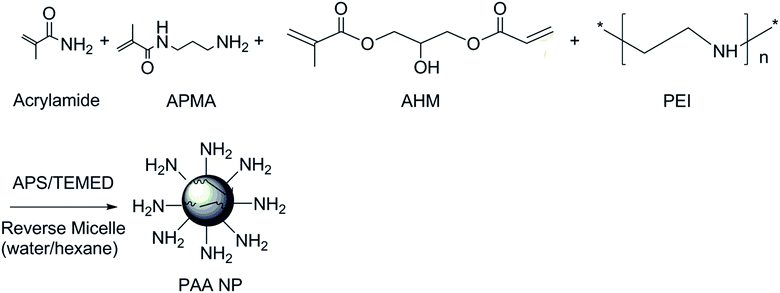 | ||
| Scheme 1 Synthesis scheme of PEI PAA NPs. APMA: N-(3-aminopropyl)methacrylamide, AHM: 3-(acryloyloxy)-2-hydroxypropyl methacrylate. | ||
The size and the zeta-potential of synthesized NPs are summarized in Table 1. The blank L-PEI PAA sample showed a similar size as the blank PAA sample. The blank H-PEI PAA sample showed significantly larger sizes of NPs, compared to the blank PAA and blank L-PEI PAA samples. A narrow size distribution of the synthesized NPs was further confirmed by transmission electron microscopy (Fig. 1). The average size of dried NPs was 12.6 (±1.3) nm. The reduction in particle size, compared to DLS, is due to particle dehydration.32 The ζ-potentials of both blank L-PEI PAA and blank H-PEI PAA samples were slightly lower than that of the PAA NPs, regardless of adding PEI, which was expected to make the NPs' ζ-potential more positive. The lower charge could be attributed to the bigger size of the PEI-PAA NPs. After loading cisplatin, the size of the NPs did not change significantly except for the L-PEI PAA.
| PEI (mg) | Blank | With cisplatin | Blank | With cisplatin | |||
|---|---|---|---|---|---|---|---|
| Size (nm) | PDI | Size (nm) | PDI | ζ-Potential (mV) | |||
| PAA | 0 | 63(±1) | 0.16(±0.04) | 69(±1) | 0.25(±0.01) | 16.3(±1.1) | 18.9(±1.0) |
| L-PEI PAA | 35.9 | 53(±1) | 0.25(±0.01) | 87(±1) | 0.28(±0.01) | 12.3(±1.0) | 8.0(±0.3) |
| H-PEI PAA | 54 | 93(±1) | 0.28(±0.01) | 91(±2) | 0.25(±0.01) | 15.9(±1.3) | 8.3(±0.5) |
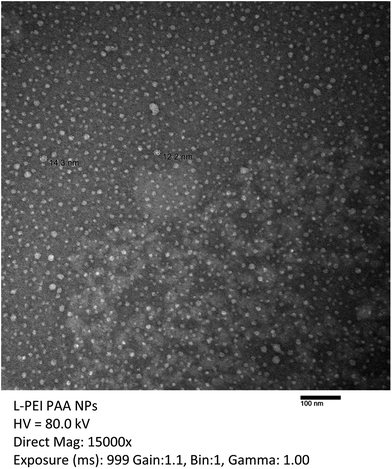 | ||
| Fig. 1 Typical TEM image of L-PEI PAA NPs. TEM image was taken to evaluate NPs' size and size distribution. The average size of dried NPs was 12.6 (±1.3) nm. | ||
Into these NPs, cisplatin was post-loaded by the method previously described.11 The weight% drug loadings of the NPs were calculated, using the following equation.
| Cisplatin wt% loading | Relative (to PAA) | P-Value with PAA | |
|---|---|---|---|
| PAA | 0.58(±0.30) | 1 | |
| L-PEI PAA | 1.2(±0.76) | 2.1 | P ≤ 0.05 |
| H-PEI PAA | 0.85(±0.37) | 1.5 | P ≥ 0.05 |
The H-PEI PAA NPs were synthesized utilizing Alexa 647-conjugated PEI, so as to easily determine the degree of loading of PEI into the NPs. The calculated loading of PEI was 53.9 (±7.9) μg per 1 mg of NPs. This shows that almost all the PEI was successfully loaded into the NPs.
The cytotoxicity of the NPs without cisplatin was evaluated (Fig. 2). The L-PEI PAA and PAANPs showed a similar small degree of toxicity, while the H-PEI PAA showed a significantly higher cytotoxicity, especially for the NP concentrations at and above 1 mg mL−1. The cytotoxicity of the H-PEI PAA indicates a possible interaction of cells with PEI, leading to cell death due to the cytotoxicity of PEI itself.26 However, it is noted that these PEI-loaded NPs were approximately two times less cytotoxic than free PEI (Fig. 3). The lesser toxicity of PEI-PAA NPs, compared to PEI by itself, implies a significant coating of PEI by the PAA matrix, i.e. shielding by PAA from PEI's potential toxicity.
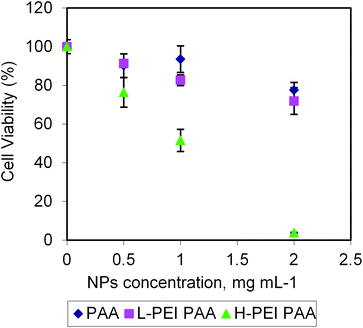 | ||
| Fig. 2 Cytotoxicity of blank NPs in 9L cells (rat glioma cell line). The error bars represent the standard deviations. | ||
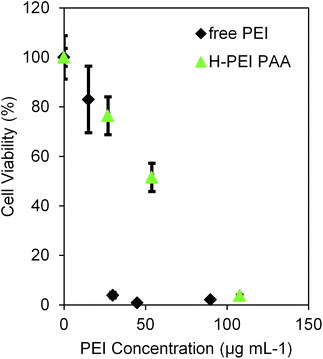 | ||
| Fig. 3 MTT cell assay for free PEI in 9L cells (rat glioma cell line). The error bars represent the standard deviations. The data is normalized to the viability of cells treated with PBS only. As a comparison, H-PEI results from Fig. 2 are also plotted. | ||
To understand the relationship between the amount of PEI and the properties of NPs, we synthesized another batch of PEI-NPs with double the amount of PEI, compared to the previous H-PEI PAANPs batch. The size of the NPs increased to 112 (±1) nm, and the zeta-potential dropped 12.4 (±0.5) mV. The toxicities of these NPs were similar to those of H-PEI NPs. This confirms that incorporation of PEI enlarges the size of the NPs, reduces the zeta-potential, and increases the cytotoxicity.
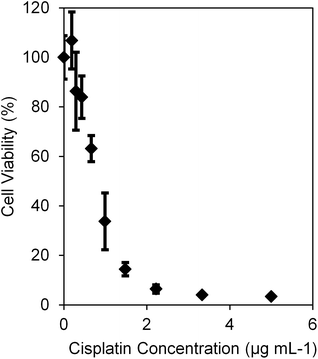
We evaluated the cytotoxicity of the cisplatin-loaded NPs, as shown in Fig. 4. IC50 values of PAA, L-PEI PAA, and H-PEI PAA were 2.01 (±0.90) μg mL−1, 1.00 (±0.36) μg mL−1, and 0.58 (±0.12) μg mL−1, respectively. Statistical analysis of the IC50 values was performed using one-way ANOVA with Dunnett's multiple comparisons test. Both cisplatin-loaded L-PEI PAA NPs and cisplatin-loaded H-PEI PAA NPs showed statistically significantly lower IC50 values than cisplatin-loaded PAA NPs (P ≤ 0.05 and P ≤ 0.01, respectively). It should be noted that, based on Table 2, we need 0.86 mg mL−1 of PAA, 0.42 mg mL−1 of L-PEI PAA, and 0.59 mg mL−1 of H-PEI PAA in order to achieve a 5 μg mL−1 cisplatin concentration, which is the highest concentration we tested in Fig. 4. Blank NPs in those concentrations (Fig. 2) were much less toxic (∼90% viability for PAA NPs as well as for L-PEI PAA NPs and ∼80% viability for H-PEI PAA NPs) than cisplatin-loaded NPs at 5 μg mL−1 cisplatin concentration (∼30% for PAA NPs and ∼10% for both L-PEI PAA and H-PEI PAA NPs) (Fig. 4). In other words, the toxicities observed in Fig. 4 can be mostly attributed to cisplatin. Also, the cytotoxicities of the cisplatin-loaded H-PEI PAA NPs and L-PEI PAA NPs were very similar to the cytotoxicity of free cisplatin (Fig. 5).
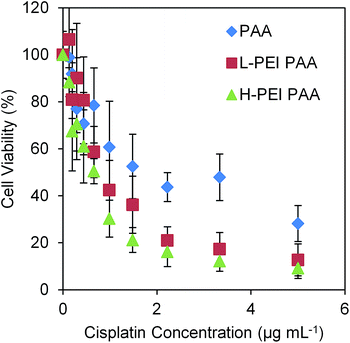 | ||
| Fig. 4 MTT assay of cisplatin-loaded NPs in 9L cells (rat glioma cell line). The error bars represent the standard deviations. The data is normalized to the viability of cells treated with PBS only. | ||
In order to elucidate the mechanism of having different levels of cytotoxicity among the three different NPs, we evaluated the release profile of these NPs in PBS (pH 7.4) (Fig. 6).
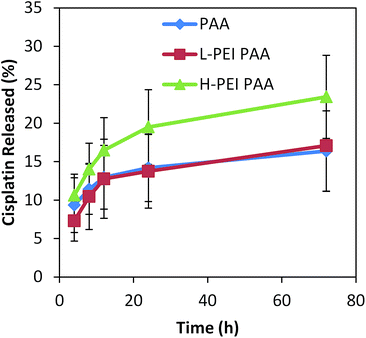 | ||
| Fig. 6 Cisplatin release profile from NPs in PBS. Error bars represent the standard deviations from 4 trials of release study for 72 hours. | ||
There was almost no difference in the release profile between the PAA and L-PEI PAA NPs. The H-PEI PAA sample released 1.4 times higher amounts of cisplatin, in 72 hours, than the PAA sample, but the difference was not statistically significant. Accordingly, the cisplatin release profiles (in PBS, Fig. 6) of these NPs cannot entirely account for the difference in the cytotoxicity. It should be noted that serum has been reported to accelerate the cisplatin release from NPs, but not to induce a burst release.10,11
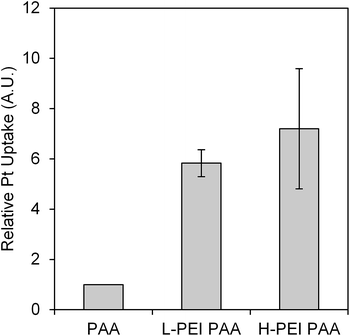
As Fig. 6 shows, there was no significant difference in the release profile observed between three different formulations, so, in order to further analyze the cause for the high cytotoxicity of the cisplatin-loaded L-PEI PAA and cisplatin-loaded H-PEI PAA NPs, the cellular uptake of cisplatin was measured (Fig. 7).
We observed a 6 times higher uptake of cisplatin when cisplatin was loaded into L-PEI PAANPs, and an almost 7 times higher uptake of cisplatin from the H-PEI PAA, compared to the PAA only matrix. In general, more positive NPs are better uptaken by cancer cells.20 However, our data showed that the PEI-PAA NPs could be better uptaken by cells irrespective of their slightly lower zeta-potential. This interesting behavior may imply that incorporation of PEI into the NP-matrix enhances the cellular uptake, not by simply changing the zeta-potential, i.e. the average global surface charge, but, presumably, by more local and specific chemical or physical interactions.
Based on the above data, the higher cellular cisplatin concentration inside the cells with L-PEI PAA and H-PEI PAANPs most probably does play a significant role in increasing the cytotoxicity of the cisplatin loaded L-PEI PAA and H-PEI PAA, compared to PAA NPs.
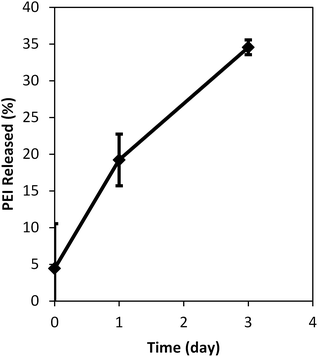
In order to determine the distribution of the PEI encapsulated inside the NP, the leaching of PEI was evaluated using H-PEI PAANPs whose PEI were fluorescently-labeled. We observed (Fig. 8) that 19% of PEI was released in 1 day, and 35% of PEI was released in 3 days. This indicates that a significant fraction of the PEI was on or close to the surface. Thus, most probably, the free surface amine groups from the PEI have led to the increase in cellular uptake of the PEI encapsulated NPs. It should be noted that F3, nucleolin targeting peptide, can be conjugated on the surface of this NPs, and this can further improve the efficacy of the NPs in vivo.31
In addition to PEI enhancing the uptake of the NPs, PEI can increase the efficacy of the chemo-drugs in several other ways. It is widely known that PEI has an ability to induce endosomal escape of nanoparticles, and this extends the NPs' staying time inside the cells; otherwise, half of the NPs may be removed by exocytosis within 0.5 hour.33 In order to test if the higher cytotoxicity of cisplatin-loaded L-PEI PAA and cisplatin-loaded H-PEI PAA can also be attributed to this factor, the NPs' endosomal escaping ability was evaluated.
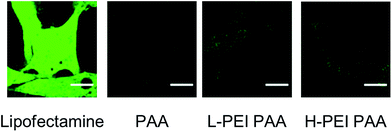
We compared the transfection efficiency of L-PEI PAA and H-PEI PAANPs with that of a widely accepted transfection agent, lipofectamine, using the green fluorescence protein (GFP) plasmid (Fig. 9).
We observed a strong GFP fluorescence signal from the transfected cells when lipofectamine was used as a transfection agent. The level of the fluorescence was much weaker when L-PEI PAA and H-PEI PAA NPs were used. However, the intracellular fluorescence was slightly (∼20%) higher than the control, i.e. the cell incubated with the plasmid and PAA NP as the transfection agent. This slight increase in fluorescence indicates some degree of transfection, which could indicate that a larger percent of drugs is delivered to the cytosol using PEI-NP, compared to just PAA NPs without PEI. This can also potentially play a significant part in increasing the drug efficacy.
We next measured the pH of the cellular microenvironment of the NPs so as to monitor any change due to the presence of PEI. The NPs are generally taken up by the cells via the process of endocytosis, and they are then located inside the endosomes and lysosomes.19 As a result, the average pH of the NP microenvironment is generally observed to be slightly acidic pH of 6.2 ± 0.2.34 It has been previously shown that causing significant damage to the endosomal compartment can lead to escaping the lysosome, and also leads to a slight increase in the pH value.29 However, in our case we did not observe any significant changes in the pH value of the NP microenvironment for different types of NPs. This indicates that the PEI inside the NP does not cause much damage to the lysosomal membrane. However, the membrane rupture often caused due to the proton sponge effect in the presence of the transfection agents may not necessarily perturb the pH.35 This point is still unclear and requires more in depth studies, which is currently outside the scope of this manuscript.
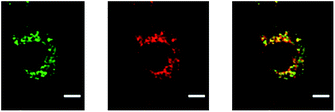
We next tested the ability of the NPs to escape the endosomes and lysosomes by using fluorescence co-localization assays. This was tested in two different ways. We first monitor the co-localization of the nanoparticles with the acidic vesicles, as shown in Fig. 10.
The cells were incubated with NPs both with and without PEI for two hours and then washed. Two days following internalization of the NPs, the cells were prepared for the co-localization experiment by staining the acidic vesicles with lysotracker. It has been previously shown that the PAA NPs co-localize in the endosomes as well as in lysosomes.19,34 We observed a high degree of co-localization of H-PEI PAA NPs with the acidic vesicles. The Pearson's coefficients quantify the degree of co-localization.36 When the value is 1, −1, or 0, the green and red channels are, respectively, perfectly correlated, perfectly but inversely correlated, and not correlated. The Pearson's coefficients were found to be 0.88 (±0.02) for these particles. This shows that the PEI-NPs are not very efficient in escaping the endosomes.
In addition, we also used PEI-NPs with triphenylphosphonium (TPP), which targets the mitochondria. This was done to monitor the delivery of any NPs that escaped out of the endosome to the mitochondria.
Fig. 11 shows the degree of co-localization of the PEI-NP with the mitochondria. We did observe some co-localization but at a low level, a Pearson's coefficient of 0.46 (±0.03). This observation confirms that most of the PEI-PAA NPs are trapped inside the endosomal/lysosomal vesicles and only a small fraction is able to escape from them.
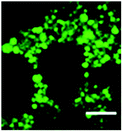
As a final test, we utilized calcein loaded PEI-NPs, to check if these PEI-NPs cause any significant changes in the membrane permeability of the vesicles. Calcein is known to be a membrane-impermeable dye.
The fluorescence images of the calcein loaded NPs are shown in Fig. 12. Calcein leached out of the NPs due to its hydrophilic nature and was entrapped inside the vesicles as it is membrane impermeable. We observed most of the fluorescence from the confinements of the vesicles of endosomes/lysosomes. The fluorescence from the cytosol was not significantly different from the background. Due to the massive volume of the cell, it was not possible to accurately detect small quantities of calcein leakage into the cytosol. However, this experiment shows that probably a large fraction of the dye was confined in the vesicles and that there are no significant changes to the membrane permeability.
These experiments on NP co-localization and calcein leaching indicate that the damage to the membrane due to the PEI is present but not very significant. However, it has been shown before that transfection agents in some cases do not change the pH of the endosomes, or enable NPs endosomal escape, but still do efficiently transfect luciferase.35 The exact mechanism of transfection is still unclear and hotly debated.35 Additionally, cisplatin molecules are small (M.W. = 300 Da) and thus even minute damage to the endosomal membrane will be sufficient to increase its cytosolic concentration, while not affecting the NPs or calcein, which is a relatively larger molecule (M.W. = 667 Da). Previously it has been reported that the PEI–cisplatin complex is more toxic than cisplatin alone, because of PEI's ability of endosomal escaping.10 Our results seem to be in line with this claim.
Conclusions
(1) We successfully incorporated PEI into hydrogel PAA-NPs. (2) The PEI-incorporated NPs are much more cytocompatible than free PEI. (3) These PEI-PAA NPs still retain the pure PEI's property of highly enhanced cellular uptake, i.e. resulting in enhancing the hydrogel NPs' cellular uptake by 500% to 600%. (4) The PEI-incorporated NPs result in a higher amount of drugs inside the cells. (5) The cisplatin loaded PEI-incorporated NPs show a much enhanced cytotoxicity. (6) The enhanced uptake of the NPs by the incorporation of PEI cannot be simply explained by their average surface properties (i.e., zeta-potential). A question remains regarding the exact mechanism of the phenomenon. Is it due to the surface heterogeneity because of the patches of PEI on the surface? This needs further investigation. (7) PEI PAA NPs showed a marginal endosomal escape ability, which may leads to a prolonged localization of cisplatin inside the cells.In summary, the embedding of PEI into the hydrogel matrix (1) highly improves on the NPs' cellular uptake. In addition to the (2) improved drug loading, there may also be a marginal enhancement both of the (3) release of the cisplatin they carry and of the (4) endosomal escaping ability. Overall, the combination of these 4 factors, and especially the first one, seems to explain the significant increase in the nano-drug's cytotoxicity.
Conflict of interest
Financial support was provided by a National Institutes of Health grant, R21NS084275 (RK). The authors declare no competing financial interest.Acknowledgements
The authors thank Antonina E. Malyarenko for help with the drug release study, and Chang Lee for help with the TEM image preparations. The authors also thank Dr Ming Qin and Professor Brent R. Martin's group (Department of Chemistry, University of Michigan) for the operation and the use of their fluorescence microplate reader; the Chemistry Instrument Shop for the use of ICP-OES and Microscopy and Image Analysis Laboratory of the University of Michigan for the use of transmission electron microscope and confocal microscope; Professors Maria Castro and Pedro Lowenstein for reading the manuscript, as well as Dr Hikmat Assi in their group for providing the GFP plasmid; and also Dr Chun-Chieh Chang in Professor Ari Gafni's group for providing calcein.References
- B. A. Chabner and T. G. Roberts, Nat. Rev. Cancer, 2005, 5, 65–72 CrossRef CAS PubMed.
- Y.-E. Koo-Lee and R. Kopelman, in Multifunctional Nanoparticles for Drug Delivery Applications-Imaging, Targeting and Delivery, ed. S. Svenson and R. K. Prud'homme, Springer, US, Boston, MA, 2012, pp. 225–255 Search PubMed.
- Y.-E. Koo Lee, G. R. Reddy, M. Bhojani, R. Schneider, M. A. Philbert, A. Rehemtulla, B. D. Ross and R. Kopelman, Adv. Drug Delivery Rev., 2006, 58, 1556–1577 CrossRef PubMed.
- H. Maeda, Adv. Enzyme Regul., 2001, 41, 189–207 CrossRef CAS PubMed.
- K. Shiraishi, Y. Harada, K. Kawano, Y. Maitani, K. Hori, K. Yanagihara, M. Takigahira and M. Yokoyama, Pharm. Res., 2012, 29, 178–186 CrossRef CAS PubMed.
- S. J. DeNardo, G. L. DeNardo, L. A. Miers, A. Natarajan, A. R. Foreman, C. Gruettner, G. N. Adamson and R. Ivkov, in Clinical Cancer Research, 2005, vol. 11, pp. 7087s–7092s Search PubMed.
- S. Dhar, F. X. Gu, R. Langer, O. C. Farokhzad and S. J. Lippard, Proc. Natl. Acad. Sci. U. S. A., 2008, 105, 17356–17361 CrossRef CAS PubMed.
- I. Winer, S. Wang, Y. E. K. Lee, W. Fan, Y. Gong, D. Burgos-Ojeda, G. Spahlinger, R. Kopelman and R. J. Buckanovich, Cancer Res., 2010, 70, 8674–8683 CrossRef CAS PubMed.
- M. Qin, Y. E. K. Lee, A. Ray and R. Kopelman, Macromol. Biosci., 2014, 14, 1106–1115 CrossRef CAS PubMed.
- X. Sun, J. Chen, H. Chen and W. Liang, Pharmazie, 2012, 67, 426–431 CAS.
- T. Shirakura, T. J. Kelson, A. Ray, A. E. Malyarenko and R. Kopelman, ACS Macro Lett., 2014, 3, 602–606 CrossRef CAS PubMed.
- S. Ganta, H. Devalapally, A. Shahiwala and M. Amiji, J. Controlled Release, 2008, 126, 187–204 CrossRef CAS PubMed.
- M. Mimeault and S. K. Batra, Drug Discovery Today, 2010, 15, 354–364 CrossRef CAS PubMed.
- C. Cuvier, L. Roblot-Treupel, J. M. Millot, G. Lizard, S. Chevillard, M. Manfait, P. Couvreur and M. F. Poupon, Biochem. Pharmacol., 1992, 44, 509–517 CrossRef CAS PubMed.
- J. Peng, T. Qi, J. Liao, B. Chu, Q. Yang, W. Li, Y. Qu, F. Luo and Z. Qian, Biomaterials, 2013, 34, 8726–8740 CrossRef CAS PubMed.
- A. Suzuki and T. Tanaka, Nature, 1990, 346, 345–347 CrossRef CAS.
- A. Mamada, T. Tanaka, D. Kungwatchakun and M. Irie, Macromolecules, 1990, 23, 1517–1519 CrossRef CAS.
- S. Biswas and V. P. Torchilin, Adv. Drug Delivery Rev., 2014, 66, 26–41 CrossRef CAS PubMed.
- L. Karamchand, G. Kim, S. Wang, H. J. Hah, A. Ray, R. Jiddou, Y.-E. Koo Lee, M. a. Philbert and R. Kopelman, Nanoscale, 2013, 5, 10327–10344 RSC.
- C. He, Y. Hu, L. Yin, C. Tang and C. Yin, Biomaterials, 2010, 31, 3657–3666 CrossRef CAS PubMed.
- C. C. Fleischer and C. K. Payne, J. Phys. Chem. B, 2014, 118, 14017–14026 CrossRef CAS PubMed.
- A. Ray, H. K. Yoon, Y. E. Koo Lee, R. Kopelman and X. Wang, Analyst, 2013, 138, 3126–3130 RSC.
- S. Wang, W. Fan, G. Kim, H. J. Hah, Y. E. K. Lee, R. Kopelman, M. Ethirajan, A. Gupta, L. N. Goswami, P. Pera, J. Morgan and R. K. Pandey, Lasers Surg. Med., 2011, 43, 686–695 CrossRef PubMed.
- A. Webster, S. J. Compton and J. W. Aylott, Analyst, 2005, 130, 163–170 RSC.
- J. Intra and A. K. Salem, J. Controlled Release, 2008, 130, 129–138 CrossRef CAS PubMed.
- H. Cheng, J.-L. Zhu, X. Zeng, Y. Jing, X.-Z. Zhang and R.-X. Zhuo, Bioconjugate Chem., 2009, 20, 481–487 CrossRef CAS PubMed.
- B. Urban-Klein, S. Werth, S. Abuharbeid, F. Czubayko and A. Aigner, Gene Ther., 2005, 12, 461–466 CrossRef CAS PubMed.
- T. Xia, M. Kovochich, M. Liong, J. I. Zink and A. E. Nel, ACS Nano, 2008, 2, 85–96 CrossRef CAS PubMed.
- A. Akinc, M. Thomas, A. M. Klibanov and R. Langer, J. Gene Med., 2005, 7, 657–663 CrossRef CAS PubMed.
- H. A. Clark, M. Hoyer, M. A. Philbert and R. Kopelman, Anal. Chem., 1999, 71, 4831–4836 CrossRef CAS PubMed.
- G. Nie, H. J. Hah, G. Kim, Y. E. K. Lee, M. Qin, T. S. Ratani, P. Fotiadis, A. Miller, A. Kochi, D. Gao, T. Chen, D. a. Orringer, O. Sagher, M. a. Philbert and R. Kopelman, Small, 2012, 8, 884–891 CrossRef CAS PubMed.
- H. K. Yoon, X. Lou, Y.-C. Chen, Y.-E. Koo Lee, E. Yoon and R. Kopelman, Chem. Mater., 2014, 26, 1592–1600 CrossRef CAS PubMed.
- J. Panyam and V. Labhasetwar, Pharm. Res., 2003, 20, 212–220 CrossRef CAS.
- A. Ray, Y. E. K. Lee, G. Kim and R. Kopelman, Small, 2012, 8, 2213–2221 CrossRef CAS PubMed.
- R. V Benjaminsen, M. A. Mattebjerg, J. R. Henriksen, S. M. Moghimi and T. L. Andresen, Mol. Ther., 2013, 21, 149–157 CrossRef PubMed.
- K. W. Dunn, M. M. Kamocka and J. H. McDonald, Am. J. Physiol.: Cell Physiol., 2011, 300, C723–C742 CrossRef CAS PubMed.
Footnotes |
| † Present address: Glycomine, Inc. 953 Indiana Street, San Francisco, CA 94107, USA. |
| ‡ Present address: Electrical and Bioengineering department, University of California Los Angeles, Los Angeles, California 90095, USA. |
| This journal is © The Royal Society of Chemistry 2016 |


