Nano-demixing as a novel strategy for magnetic field responsive systems: the case of dibutyl phosphate/bis(2-ethylhexyl)amine systems

Mikolaj Pochylskia, Cesare Oliviero Rossib, Isabella Nicoterab, Vincenzo Turco Liveric and Pietro Calandra*d
aFaculty of Physics, Adam Mickiewicz University, ul. Umultowska 85, Poznan 62-614, Poland
bDepartment of Chemistry and Chemical Technologies, University of Calabria, 87036 Rende, Cosenza, Italy
cDip. STEBICEF, University of Palermo, Viale delle Scienze, I-90128 Palermo, Italy. Tel: +39 091 6459844
dCNR-ISMN, National Council of Research, Institute for the Study of Nanostructured Materials, Via Salaria km 29.300, Monterotondo Stazione, RM, Italy. E-mail: pietro.calandra@ismn.cnr.it; Fax: +39 06 90672839; Tel: +39 06 90672409

Received 26th January 2016 , Accepted 1st March 2016

First published on 2nd March 2016


Abstract

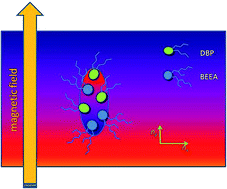
Pure surfactant liquids and their binary mixtures, owing to the amphiphilic nature of the molecules involved, can exhibit nano-segregation and peculiar transport properties. The possibility of opportunely choosing the amphiphiles should lead to the formation of anisotropic aggregates that can be oriented by an external factor like a magnetic field. In this case some properties, like optical birefringence, can be induced by the use of a magnetic field. Dynamic features of dibutyl phosphate (DBP)/bis(2-ethylhexyl)amine (BEEA) mixtures have been investigated by FT-IR, NMR, rheometry, Brillouin scattering, and magnetically-induced birefringence measurements as a function of the BEEA mole fraction (X). It turns out that BEEA/DBP liquid mixtures, driven by H-bond formation, show zero-threshold percolating self-assembly with a maximum in viscosity and a minimum in molecular diffusion at 1[thin space (1/6-em)]:[thin space (1/6-em)]1 composition. Interestingly, it has been highlighted that nano-segregation takes place at X ≅ 0.7 with the formation of DBP-rich closed local structures that are fully-responsive to an external magnetic field, rendering the system birefringent. It is worth noting that this is the first observation of amphiphile-based micelles in amphiphilic medium. The analysis of all the experimental data consistently pointed out the microscopic factors involved in this peculiar phenomenon and in particular emphasized the role of specific polar and apolar interactions along with to steric effects in regulating the molecular organization in surfactant mixtures. This report presents novel clear, stable and anhydrous systems, fully responsive to a magnetic field with tunable optical birefringence, and opens new trends in the directed design of water-free optically-active fluids.

Introduction

Liquid surfactants can give local self-segregation with the formation of ordered nano-structures, which are responsible for peculiar physicochemical properties. Surfactant self-assembly to form structures is dictated by their typical molecular architecture: a small polar or ionic group coexists with an elongated apolar (usually alkyl chain) part within the molecule. In competition with the thermal effect tending to randomize molecular orientation and/or position, the different strength of polar–polar, apolar–apolar and polar–apolar interactions drives the molecular assembling and leads to a variety of local structures that may range from simple molecular adducts to extended long-range structures. The derived macroscopic physico-chemical properties are at the basis of specialized biological and technological applications (peculiar solvent and reaction media, enhanced rheological and conductometric properties).

In addition to the classical strategy to change the nature of the hydrophilic group or the length of the alkyl chain to obtain novel materials, we have recently adopted ​ a bio-inspired strategy based on the mixing of already-known surfactants. Our recent studies highlighted the role of acid/basic character of surfactant polar groups to drive H-bond/proton transfer which strengthens the local structures. More specifically, in addition to the driving force constituted by H-bond formation, the strength of all the other intermolecular interactions involved (polar–polar, polar–apolar and apolar–apolar interactions, steric hindrances etc.) dictates the aggregation pattern (lamellar, hexagonal, cubic, dense micellar phase) but also determines the formation of energetic barriers controlling the thermally activated diffusional and rotational molecular dynamics and, therefore, the time scale of local positional and orientational order of surfactant molecules and their aggregates. This ultimately causes the origin of interesting structural and dynamic emerging properties in the mixtures which are not present in pure components, such as for example, enhanced proton conductivity,1 anomalous diffusion along extended 1D structures,2 anti-Arrhenian behaviour of the conductivity.3

Of course all these unexpected and peculiar properties deserve to be tailored for specific applications.

Given this state-of-the-art, in the present work we wanted to explore the possibility to generate anisotropic surfactant-based local structures which can efficiently respond to a magnetic field. To do this, the inspiring idea was to reduce the alkyl chain length of one of the two surfactants involved in the mixture, in order to emphasize polar–polar interactions and favour nano self-segregation with the formation of local anisotropic soft structures. We will show that dibutyl phosphate (DBP)/bis(2-ethylhexyl)amine (BEEA) binary mixtures (the molecular structures of these substances are schematically represented in Scheme 1) fully respond to this objective, being miscible in all the composition range, being stable even at high temperatures and showing spontaneous self-segregation at the nanoscale with the formation of stable anisotropic structures responsive to an applied magnetic field.


image file: c6ra02386j-s1.tif
Scheme 1 Schematic representation of DBP (left) and BEEA (right) molecular structures.

Experimental part

Dibutyl phosphate (DBP, Aldrich >99.5%) and bis(2-ethylhexyl)amine (BEEA, Aldrich 99%) were used as received. DBP/BEEA mixtures were prepared by weight and stored in sealed vials. Their composition hereafter is expressed as BEEA molar fraction (X).

The addition of BEEA to DBP gave a moderate heating and resulted in the formation of homogeneous and transparent liquid samples of increased viscosity in the whole composition range. This can be taken as a first clue of the occurrence of the exothermic acid–base reaction between DBP and BEEA leading to proton transfer from the acid DBP to the basic BEEA. Since the proton transfer is known to be among the fastest chemical reactions, acid–base reactions are generally diffusion-limited, i.e. their rate is limited by the diffusion of the reacting molecules. So the reaction can be considered complete in a short period (stirring + diffusion). In our case, given the increased viscosity of some mixtures, all samples were stored in sealed vials and kept overnight prior measurements. However the homogeneity of the sample even at the sub-microscale was confirmed by the setup for birefringence measurements (see below).

FT-IR

FT-IR spectra were acquired at 25 °C with a Spectrum One spectrometer (Perkin Elmer), using a cell equipped with CaF2 windows. Each spectrum was the average of eight scans in the 900–4000 cm−1 wavenumber range at a spectral resolution of 0.5 cm−1. By IR spectroscopy no detectable signal due to water was found in all the studied samples. This assured the absence of residual water.

NMR

NMR measurements were performed on a Bruker NMR spectrometer AVANCE 300 Wide Bore working at 300 MHz on 1H. The employed probe was a Diff30 Z-diffusion 30 G/cm/A multinuclear with substitutable RF inserts. Spectra were obtained by applying the Fourier transform to the resulting free induction decay (FID) of a single π/2 pulse sequence. The π/2 pulse width was about 8 μs. All the spectra were acquired with the same number of scans and were referenced against pure water set at 4.79 ppm, i.e. its chemical shift with respect to tetramethylsilane (TMS).

Pulsed field gradient spin-echo (PFG-SE) method was used to measure the self-diffusion coefficients (Dt) since it has proven to be a suitable tool to study surfactant-based liquid mixtures.2,4,5 Information on the technique are reported in ESI.

In our condition the uncertainty in the self-diffusion measurements is ∼3%.

NMR measurements were run by increasing temperature step by step from 20 to 80 °C, with steps of 20 °C, and leaving the sample to equilibrate for about 20 min.

Rheological

Rheological measurements were performed using a shear strain controlled rheometer RFS III (Rheometrics, USA) equipped with concentric cylinder geometry (external and inner radius 18 and 17 mm, respectively). The temperature was controlled by a water circulation apparatus (±0.2 °C).

In the steady flow experiments, the viscosity is measured as a function of the shear rate, which is tuned by controlling the velocity of the moving cylinder of the rheometer. The force exerted on the fluid is measured and the macroscopic shear rate dγ/dt is obtained as the ratio between the velocity over the gap, and the shear stress σ is defined as the macroscopic force divided by the surface. These experiments were performed in the shear rate range 1–1000 s−1. To ensure steady flow conditions, the required equilibration time was determined by transient experiments, according to step-rate tests. Ten seconds perturbations ensured steady flow conditions in the system for the whole shear rate range.

Brillouin

Brillouin scattering experiment has been carried out by means of a Sandercock-type (3 + 3)-pass Tandem Fabry–Perot interferometer, working at a free spectral range of 25 GHz. The working finesse, estimated by the line-width of the elastic line, was about 80. The linearly polarized line (λ = 532 nm) of a spectra Physics-DPSS Excelsior laser providing 532 nm line with mean power of about 80 mW, was used as the probe. In each measurement, the VV component of scattered light has been collected in a back-scattering geometry. For the calculation of acoustical parameters (sound velocity, vB, and its attenuation α) from Brillouin spectra, the refractive index value, n, for each mixture have been measured using a standard Pulfrich refractometer. The composition dependency of the density, ρ, was then calculated assuming additivity of molar refraction, R, and using the refraction index data and the Lorentz–Lorenz relation:
 
image file: c6ra02386j-t1.tif(1)
where X stands for the molar fraction and M is the molar mass.

Magnetically induced linear birefringence

Magnetically induced linear birefringence was measured using the set-up briefly described in ESI and schematically depicted in Scheme S1. Further details are shown elsewhere.6

The birefringence signal of the samples studied does not respond immediately when magnetic field was turned on or turned off (electromagnet used in our studies produces magnetic induction up to B = 2 T, which is not enough to induce full orientation of molecular aggregates; more than 10 T (ref. 7) should be applied). Instead, the effect was changing gradually with a rate dependent on the mixture concentration. This transient behavior made the usual measurement (as a function of magnetic field induction) inconvenient. For this reason we followed a different experimental protocol where for each sample the induced birefringence was recorded as a function of time after switching on and switching off the magnetic field of constant induction B = 1.5 T. All measurements were performed at constant temperature of 25 °C.

The same apparatus, using a laser beam passing through the whole sample 100 mm path length was used also to check the homogeneity of the sample at the sub-micro scale. In fact, after mixing DBP and BEEA, the system although homogeneous at a visual inspection, shows still some heterogeneity revealed by the defocusing of the laser spot at the gate of the cell. These heterogeneities disappear after times long enough as a result of the diffusional motions.

Results and discussion

IR spectra

The spectra of DBP/BEEA mixtures at some representative BEEA molar fraction (X) are shown in Fig. 1a, where the spectra of pure DBP and BEEA are also shown for comparison.
image file: c6ra02386j-f1.tif
Fig. 1 (a) Infrared spectra of pure DBP (upper spectrum) and pure BEEA (lower spectrum), together with those of some representative mixtures (intermediate spectra); (b) comparison between the spectra of pure DBP, pure BEEA and DBP/BEEA mixture (X = 0.5) in the 1500–2800 cm−1 spectral range.

It can be seen that no absorption bands attributable to free OH and NH groups are observable. This indicates that, both in pure components and in the mixtures, these groups are engaged in more or less strong hydrogen bonds implying a head to head association. Moreover, the spectrum of the mixture cannot be rationalized in terms of additive contributes of the two components. In particular, as highlighted in Fig. 1b, where the 1500–2800 cm−1 range is expanded, it must be noted that:

(i) The three characteristic broad bands of medium intensity occurring at about 1691, 2320 and 2650 cm−1 observed in the spectrum of pure DBP and due to strongly hydrogen bonded POH group8,9 are not present in the spectrum of the mixture.

(ii) New broad bands appear in the spectrum of the mixture: they occur at about 2416, 2566 and 2704 cm−1, attributable to stretching vibrations due to NH2+ group of protonated secondary amines and at about 1621 cm−1 due to its deformation vibrations. These bands are absent in pure BEEA.10

These observations suggest a significant proton transfer from the DBP POH group to the BEEA NH group. The mixtures can be considered as made of DBP–BEEA couples where the DBP proton is bridged between the two molecules in a H-bond. The partial H transfer from DBP to BEEA can give a certain ionic character to the molecular couple.11,12 Additional clues concerning the interaction between the DBP POH group and the BEEA NH one can be achieved by the analysis of the band at 1230 cm−1 shown in Fig. 2a for some selected samples. This band is a DBP combination band (ν(PO) + δ(POH)) and therefore it is important to note that this a probe of the DBP state only. The band position (ωPOH) of all the samples is reported in Fig. 2b. This figure shows that the addition of BEEA to DBP causes a progressive red shift of the band position, as a result of direct interactions between DBP POH group and the BEEA NH one. The position of the band reaches its minimum value at X = 0.5 which corresponds to the DBP[thin space (1/6-em)]:[thin space (1/6-em)]BEEA ratio of 1[thin space (1/6-em)]:[thin space (1/6-em)]1 where all the phosphate groups are stoichiometrically neutralized by the BEEA amine groups. Interestingly, at higher X values (X > 0.5) an uprising trend is observed, showing that a restoring of the initial, DBP-rich, situation is somehow encountered. This behaviour is an indication that, increasing the amount of BEEA above X = 0.5, the further addition of BEEA does not involve parallel association with DBP, but rather it can be considered as making part of another microphase. DBP, in turn, tending to restore its original bulk state, becomes associated to less and less BEEA. This is the first hint of DBP nano-segregation to form DBP-rich reverse micelles dispersed in BEEA-rich medium.


image file: c6ra02386j-f2.tif
Fig. 2 (a) ν(PO) + δ(POH) combination band of DBP in DBP/BEEA mixtures at different X values. (b) Band position (ωPOH) as a function of X (the dotted line is a guide for the eye).

The occurrence of this phenomenon is confirmed by the analysis of the bands due to vibrations of functional groups in the alkyl chains, and specifically: (i) the so-called umbrella bending, which is a concerted H–C–H symmetric bending involving the terminal CH3 and occurring around 1380 cm−1 and (ii) the C–H stretchings in the region 2800–3000 cm−1. It is important to note that these bands are typical of the alkyl chains and therefore are not specific for DBP or BEEA but rather they probe the state of the apolar part of the whole system. The details of the analysis, together with the pertinent comments are reported in ESI. Here we just point out that the analysis of the umbrella bending and C–H stretching bands is consistent with the self-segregation of DBP-rich micelles dispersed in BEEA at X > 0.5.

It must be noted that, although the vibrations involving aliphatic parts of organic molecules (CH, CH2 and CH3) are generally considered not much sensitive to changes in intermolecular arrangement due to the weak inter-molecular interactions (essentially van der Waals interactions), here the accurate analysis of the data has unveiled the structural changes occurring in the liquid.

As a result of the IR data analysis it can be concluded that the mixing of DBP and BEEA allows the formation of polar–polar strong interaction with a definite proton transfer from the acidic DBP to the basic BEEA. This triggers a supra-molecular rearrangement with formation DBP–BEEA association which also affects the alkyl chain packing. Interestingly at X > 0.5 the mixtures tend to behave as a mere combinations of the two pure components, which can be seen in a first approach as a hint for nanosegregation with the formation of domains of DBP-rich floating in pure BEEA.

In this respect, this nanosegregation can be dealt with as a true nanodemixing.

1H-NMR

In Fig. 3 the spectra of the two pure components are reported together with the spectrum of the mixture at X = 0.33 chosen as representative. The attribution of the signals is reported in the insets.
image file: c6ra02386j-f3.tif
Fig. 3 (Top panel) NMR spectra of pure BEEA; (middle panel) spectrum of pure DBP; (bottom panel) spectrum of the mixture at X = 0.33 chosen as representative.

It can be noted that the spectrum of the mixture is not the mere combination of the spectra of the two pure compounds highlighting the presence of marked interactions. In particular, the interactions are more evident for the protons belonging to the polar heads and for those close to this region (the α-CH2 protons, labelled as d and d′). Weaker and weaker interactions involve the protons progressively more distant from the polar groups so that b and b′ CH2 and the a and a′ CH3 have positions which are almost insensitive to composition. This is in accordance with the observation that the H bond formation, occurring between the different polar heads of the molecules, is the driving force for intermolecular self-assembly. On the other side, the protons a, b, c, a′, b′ and c′ have signals in a restricted region of the spectrum so some of them are partially overlapping especially in the most viscous samples due to viscosity-driven broadening. In addition, their position is not much composition-dependent, therefore we avoid their analysis because we judged it not safe. As a consequence we focused our attention on the protons of the polar head (e and e′) and the two kinds of α-CH2 protons (d and d′).

The very first effect of composition can be seen by looking at the POH proton belonging to the DBP head group. In the specific, when BEEA is added to DBP, i.e. when X is increased, a progressive reduction of the intensity of such group is observed, together with the arising of a new signal at about 10 ppm. The reduction of the intensity of the POH proton is clearly due to decreasing of its concentration with X and the signal at about 10 ppm is attributed to the NH2+ group, therefore a proton transfer from the acidic DBP to the basic BEEA is achieved. The –PO–NH2+ can be considered as bonds constituting DBP–BEEA adducts which in the following will be referred to as hetero-adducts, in accordance with previous observations in similar systems.2

When the composition 1[thin space (1/6-em)]:[thin space (1/6-em)]1 is reached (X = 0.5), all DBP are involved in bonds with BEEA, so the signal coming from POH is completely disappeared and the signal due to the NH2+ group reaches its maximum in intensity.

Both positions of the POH and NH2+ signals are composition-dependent, as showed in Fig. 4, highlighting a progressive change in the conformational structure and/or a progressive local molecular rearrangement.


image file: c6ra02386j-f4.tif
Fig. 4 Upper panels: chemical shift of the α-CH2 of the DBP (left) and BEEA (right); lower panels: chemical shift of the proton in POH group of DBP (left: note that at X > 0.33 the signal entirely disappeared) and chemical shift of the NH2+ group.

The change in chemical shift of the head group protons is the most striking effect and well agrees with the clues derived by IR analysis: this contributes to state that the DBP–BEEA intermolecular H-bonds are the driving force to the observed molecular self-assembly.

This change of peak positions with composition also affects the signals of the two α-CH2 protons in BEEA and DBP (d and d′, respectively) and reported in the same Fig. 4. In this case, a change in slope around X = 0.5 already suggests the existence of two regimes with different behaviours, an effect which will be seen by the other techniques in the following sections.

PFG-NMR experiments

Pulsed Field Gradient experiments were carried out to measure the diffusion coefficients (Dt) of the species present in the mixtures, analyzing the decay of all the signals of all the spectra at three different temperatures. The overall results can be summarized as follows.

In the range 0 < X < 0.5 all the peaks give the same diffusion coefficient. Since DBP and BEEA have different molecular size, they are expected to have different hydrodynamic radii and consequently different diffusion coefficients if they experience the same environment (i.e. if they are not associated): this means that they must be associated in order to diffuse jointly, in accordance with FT-IR data. It is also worth noting that in this range of composition the amount of DBP is higher than that of BEEA, so we must take into account for the fact that some DBP molecules are involved with bonds with BEEA and other DBP molecules (those in excess) are engaged in DBP–DBP interactions. If the exchange between these two states is faster respect to the typical NMR timescale (the order of few milliseconds), the molecules are indistinguishable. In fact, in the PFG experiments we observe a mono-exponential decay of the α-CH2 in DBP, therefore the diffusion coefficient represents the weighted average of the states belonging to hetero-associated and homo-associated molecules.

This also justifies the change in shift of both POH and NH2+ groups with composition, occurring parallel to their change in relative intensities: these signals are the weighted averages of the two states.

In this composition range, as X is increased the diffusion coefficients (shown in Fig. 5) progressively decrease in accordance both with the increase in viscosity and with the expected enhancement of molecular associations. In few words as BEEA progressively replaces DBP within the system, more DBP–BEEA associations are established and such interactions are not exclusives of specific molecules, but thanks to the rapid exchange they characterize the whole system.


image file: c6ra02386j-f5.tif
Fig. 5 Diffusion coefficients as a function of X.

At X > 0.5 a different situation is observed, i.e. the signals coming from the α-CH2 in DBP and BEEA show different Dt values and are monoexponential. The two molecules diffuse with different mean velocities: a decoupling takes place.

In accordance, the signal of a and a′ assigned to the terminal CH3 of the two molecules (BEEA and DBP, respectively) and summed up in an unique signal, become definitely bi-exponential giving two diffusion coefficients that match the two values obtained for d and d′. This is a clear indication of decoupling of DBP and BEEA diffusional dynamics. Coherently, the viscosity decreases and both values of Dt increase with X. This picture reflects the competition between the tendency of forming associated hetero-adducts DBP–BEEA with the separate tendency of both DBP and BEEA to self-associate. The former is predominant at X < 0.5 where the molecule in excess is DBP which shows higher structuring tendency, the latter is predominant at X > 0.5 where the molecule in excess is BEEA which has lower structure-forming tendency. Coherently, for mixtures with X > 0.5, BEEA (which is bigger than DBP) shows the higher Dt values, so that a less viscous environment (made up mostly of BEEA, see rheology part) is experienced by this molecule. On the other hand, DBP (which is lighter than BEEA) has a lower diffusion coefficient, and this is a hint of the fact that DBP is still aggregated with formation of DBP-rich domains floating in almost pure BEEA.

The same aspect is highlighted by the Arrhenius analysis: the best fit of the ln[thin space (1/6-em)]Dt vs. 1/T plot allows the determination of both the activation energy (Ea) and pre-exponential factor (A) for the diffusional process, which are reported in the ESI (Fig. S4) together with some pertinent details and comments. The trend of both Ea and A reflects what has been observed for the Dt values: in the 0 < X < 0.5 range Ea is the same for DBP and BEEA whereas in the 0.5 < X < 1 range it is different for DBP and BEEA. The same holds for the pre-exponential factor.

Rheological measurements

In steady shear experiments, the viscosity is measured as a function of the shear rate under steady flow conditions. In ESI we have reported the clue of the analysis of the apparent viscosity as measured as a function of the shear rate for each sample and temperature. It has been found that pure components are Newtonian whereas mixtures show a slight shear thinning at higher shear rates, an effect which becomes more marked when the composition get closer to X = 0.5 and which tends to vanish with increasing temperature. See ESI and Table S1 therein. The thinning effect indicates the existence within the mixtures of soft DBP-rich structures which are deformed/disrupted under shear, in accordance with the IR data.

The zero-shear viscosity (ηS) is plotted in Fig. 6 (left panel) as a function of composition for all the investigated temperatures. It is evident the steep increase in viscosity when the composition approaches the X = 0.5 value, where the viscosity reaches a maximum.


image file: c6ra02386j-f6.tif
Fig. 6 Left panel: zero-shear viscosity (ηS) as a function of X for all the investigated temperatures (lines are only a guide for the eye). The inset shows the same data in a log–log scale plot. Right panels: activation energy (up) and pre-exponential factor (down) for the viscosity as a function of composition. The anomaly around X = 0.7 is highlighted.

The V-shaped linear trend in the log[thin space (1/6-em)]ηs vs. log[thin space (1/6-em)]X plot can be rationalized in terms of a percolated network formed by DBP–BEEA building blocks which are interacting thus causing the formation of an infinite dynamic cluster involving an enhanced bulk momentum transport under shearing.

Considering the Maxwell equation ηS = , and considering the models describing the network dynamics,13,14 a parameter describing the processes governing the structural relaxation time emerges, so we proceeded similarly to concentrated solutions of rod-like micelles or polymers,15,16 to finally obtain

 
ηSϕVB (2)
where ϕV is the volume fraction of BEEA in the range 0 ≤ X ≤ 0.5 and the volume fraction of DBP in the range 0.5 ≤ X ≤ 1 and B is determined by the processes governing the structural relaxation time of the network.17

We used eqn (2) to fit the data and the fitting parameters are collected in Table 1.

Table 1 Fitting parameters (B) derived by fitting of viscosity as a function of ϕV at various temperatures
Temperature (°C) B (0 ≤ X ≤ 0.5) B (0.5 ≤ X ≤ 1)
10 5.7 5.7
20 5.0 5.1
30 5.3 5.0
40 5.5 3.7
50 5.5 3.7
60 4.1 2.9
70 3.7 2.7


It should be noted that the critical exponent B is comprised between 2.7 and 5.7 and it decreases with temperature. This behaviour is typical of percolating systems characterized by a percolation at zero threshold.18

The observed percolation phenomenon highlights that the addition of BEEA to DBP or vice versa leads to the formation of a transient network of dynamically interacting DBP–BEEA building blocks extending for macroscopic distances. The temperature dependence of the B exponent indicates that an increase of the thermal agitation affects the processes responsible of the structural relaxation time of the system.17

This behavior appears to be more evident in the BEEA rich region (structure in a non-structured medium).

The temperature dependence of the viscosity of these samples allows to build the Arrhenius plots and derive the corresponding activation energy (Ea) and pre-exponential factor which are reported in Fig. 6 (right panel). The activation energy reveals a maximum at X = 0.5 in accordance with the hindered dynamics due to the structuring effect, but also a local minimum at X = 0.7 which is correlated to the change of local structure around this composition. The specular behaviour is shown by the preexponential factor.

Brillouin data

Each Brillouin spectrum, registered from sample of given composition (Fig. 7), was fitted using the convolution of the experimental elastic scattering profile with the expression derived on the basis of generalized hydrodynamics19,20 and reported in ESI (eqn S6 and related comments). This allowed the frequency position and width of the Brillouin peak to be determined.
image file: c6ra02386j-f7.tif
Fig. 7 Some representative Brillouin spectra for DBP/BEEA mixtures. Lines shows results of the fit with eqn S7 reported in ESI.

Measuring the position ωB, and the width ΓB, of the Brillouin lines allows to obtain directly the frequency and the lifetime of the acoustic excitation. These two parameters can then be used to calculate sound velocity, vB, and its absorption, α.

 
image file: c6ra02386j-t2.tif(3)
where q = 4πn[thin space (1/6-em)]sin(θ/2)/λ is the amplitude of the scattering wave-vector and θ is scattering angle.

Because speed of sound is related to the compressibility, β, (β = 1/ρv2), any change in the system leading to increase or decrease its local rigidity will be accompanied by corresponding change in measured sound velocity. This makes the method useful in the studies of the intermolecular interaction in liquid mixtures.

According to classical theory of propagation of longitudinal wave in non-relaxing liquids, sound absorption is mainly caused by the viscosity.21 The longitudinal viscosity, ηL, is the sum of both volume, ηV, and shear, ηS, viscosities.

 
image file: c6ra02386j-t3.tif(4)

As follows from eqn (3) and (4) the longitudinal viscosity may be easily obtained from measured Brillouin line–shape parameters

 
image file: c6ra02386j-t4.tif(5)

In the Brillouin light scattering, the measured frequencies of the phonons are of the order of GHz. In liquid systems, this frequency often corresponds to the time scale (picosecond) of local structure reorganization. When the structural relaxation process couples with the propagating density fluctuation, the dispersion phenomena occurs and the measured acoustical properties (speed of sound and longitudinal viscosity) deviate from those observed at lower frequencies (longer time-scales). This makes Brillouin method also valuable tool providing information on the local dynamics of the system.22

At a first stage we have calculated the molar volume as a function of the BEEA volume fraction (ϕ), which is reported in Fig. 8.


image file: c6ra02386j-f8.tif
Fig. 8 Molar volume and (in the inset) excess molar volume as a function of BEEA volume fraction.

The characteristic minimum in excess volume (inset in Fig. 8) shows that the mixing process cannot be considered as random. The quite high negative value of ΔV suggests that the mixing process, besides being affected by inevitable excluded volume interactions, which themselves can give negative excess mixing volume when two differently-sized kind of molecules are mixed,23 is also characterized by direct attractive interparticle interactions between DBP and BEEA, which eventually leads to formation of more compact hetero-structures.

More information are provided by the hypersonic velocity (vB) and longitudinal viscosity (ηL) data calculated through eqn (3) and (5) and reported in Fig. 9.


image file: c6ra02386j-f9.tif
Fig. 9 (a) Concentration dependencies of hypersonic velocity and longitudinal viscosity, as obtained by eqn (3) and (5) through the outcomes of the fitting of the experimental data with eqn S7 reported in ESI. (b) Attenuation coefficient as a function of X. (c) Comparison of zero-frequency shear viscosity with GHz-frequency longitudinal viscosity on semi-log plot.

As follows from the figure, measured acoustical parameters show peculiar behavior for X = 0.5. For mixture of this composition the speed of sound is the highest, while the sound attenuation reaches a minimum (panels a and b of Fig. 9). This observation may be justified by not negligible interactions between both mixture constituents. Maximum in sound velocity is the result of distinctly increased rigidity of the mixture. This can be taken as an evidence of the attractive interactions between DBP and BEEA molecules leading to extended hetero-structure formation. The position of the hypersound velocity maximum suggests that on the semi-macroscopic scale given by the sound wavelength (∼200 nm) the building block of the existing extended structures is the 1[thin space (1/6-em)]:[thin space (1/6-em)]1 DBP–BEEA hetero-adduct and well agrees with the results from other techniques presented in this work.

As mentioned above, the minimum in sound attenuation, observed for the same X = 0.5 concentration, should be reflected by the appropriate change in the viscosity of the system and/or in its complex local dynamics. In order to distinguish between different possibilities the longitudinal viscosity was calculated from Brillouin data (using eqn (5)) and compared with the static shear viscosity values. The result is shown in Fig. 9 (panel c). As follows from eqn (4), the longitudinal viscosity is the composite of both, volume and shear viscosities. In other words, the value of viscosity measured with Brillouin method should be always higher then shear viscosity. Inspection of Fig. 9c indicates that this is not the case for our situation. Here the Brillouin viscosity can be higher or lower from static-shear viscosity, depending on mixture concentration. Starting from pure BEEA (X = 1) down to X ≅ 0.8 the classical picture of sound propagation works and ηL > ηS. For lower concentrations, however, ηL is always lower then ηS, which does not have explanation in classic theory.

This observation is an evidence of the viscoelastic behavior of the sample, which means that the value of viscosity is not a constant but rather depend on the frequency of mechanical deformation, i.e. ηη(ω).24 It is a consequence of “dynamical freezing” of molecules exposed to mechanical perturbation being faster than the time needed to rearrange the liquid structure. During periodic perturbation of high enough frequency, an acoustic energy cannot be efficiently dissipated by viscous deformation. At these conditions the energy is accumulated in the system which then gain the elastic properties. This explains why for GHz frequency the shear viscosity may have a different (and much lower) value then in static conditions and why, at the same time, the velocity (rigidity) increases. This also connects the behavior of longitudinal viscosity (absorption) presented in Fig. 9 with the influence of the structural relaxation process.

The same reasoning allows to explain sound absorption (longitudinal viscosity) minimum for X = 0.5, separated by two maxima at about X = 0.33 and X = 0.75. Although quantitative analysis of this observation requires proper temperature measurement, as we have shown in ref. 23, the picture from Fig. 9 may be understood qualitatively. The positions of absorption maxima mark the points where the coupling between structural relaxation and acoustical wave is the most efficient. For these concentrations the rate of reorganization of mixture structure is getting closer to the frequency of the mechanical perturbation and/or the energy dissipation efficiency typical of the existing structures reaches a maximum. At different compositions the structural relaxation is too slow (0.33 < X < 0.75) or too fast (X < 0.33 and X > 0.75) to productively transfer the acoustical energy to the system.

The behaviour of acoustic parameters obtained from Brillouin light scattering technique clearly indicates the existence of strong attractive interactions between both mixture components. This can be taken as indirect proof of existence of molecular aggregates as such interactions are necessary for any structure formation and its stabilization. From the mechanical point of view, however, the system is uniform and isotropic on the scale larger than 200 nm. The extreme values of parameters observed for X = 0.5 is just a consequence of the highest concentration of rigid intermolecular bonds for the stoichiometric composition. Observation that longitudinal viscosity measured by Brillouin scattering method is not directly related to static shear viscosity shows that in current system the process responsible for hypersound attenuation is local and does not relate to the large scale molecular displacements. However, it is not local enough to distinguish the existence of anisotropic self-aggregates, whose occurrence was suggested by induced birefringence measurements.

Magnetically induced birefringence measurements

Optical birefringence has been investigated in our samples to explore the local structural anisotropy. Some hints introducing the physical principles at the base of the technique is reported in ESI.

For individual molecules, the magnetic energy (the product of magnetic dipole in direction of magnetic field and the magnetic field induction) is typically very small compared with the thermal energy which tries to bring the system back to the uniform angular distribution. Situation becomes more interesting when the molecules form an aggregate inside which they occupy some preferential positions/orientations. In such a case magnetic energy of an aggregate is the sum of all the energies of its molecules. This energy may be large enough that the resultant torque on the aggregate overcomes the thermal randomization and substantial orientation of such large scale structure, and so the induced birefringence, may be achieved with relatively low magnetic field.

The typical trend recorded for sample at X = 0.7, after switching on and switching off the magnetic field of constant induction B = 1.5 T, is reported in Fig. 10.


image file: c6ra02386j-f10.tif
Fig. 10 Normalized induced birefringence Δn/λ, as a function of time when turning on and off the external magnetic field. Solid lines shows results of the fit with eqn (6).

It can be seen that the system requires some time to reach a constant birefringence value after step change in magnetic field intensity. In order to quantify this observation we described the time dependence of induced birefringence by a stretched exponential function

 
Δn/λ(t) = AΔn/λ(1 − exp(−(t/τ)β)) (6)
where AΔn/λ is the amplitude of induced birefringence normalized to wavelength of probing light, τ is the characteristic equilibration/relaxation time and β describes stretching of the relaxation time distribution. The β values turned out to be always very close to unity: these small deviations from β = 1 are natural in structurally and dynamically non-uniform relaxing systems. As to the normalized induced birefringence Δn/λ and the time constant (τ), they are reported in Fig. 11.


image file: c6ra02386j-f11.tif
Fig. 11 Normalized induced birefringence (Δn/λ, upper panel) and the time constant (τ, lower panel) as a function of composition (the time constant at X = 1 was too short to be measured).

Measured birefringence values Δn/λ after turning on and off the magnetic field are very close to each other. For pure DBP and BEEA, Δn/λ values are very low which results from low electrical (optical) anisotropy of both molecules and from low orientational order induced by magnetic field. In the case of DBP the value of Δn/λ is positive (4.3 × 10⁻⁴ m−1), whereas for BEEA it was found negative (−1.3 × 10⁻⁴ m−1). This means that the DBP molecule in pure liquid are oriented so they point their axis of highest optical polarizability along the magnetic field direction, while resultant orientation of BEEA is opposite. The different behavior of both molecules, as exposed to magnetic field, reflects the difference in their structure, where alkyl chain length and branching, as well as nature and size of the polar head, all does matter. The negative birefringence was also detected for DBP/BEEA mixtures in broad concentration range (for X > 0.15). In this case the absolute value of Δn/λ increases by orders of magnitude in comparison to the values obtained for pure components reaching the highest values at X ≅ 0.7. Huge values of birefringence observed for DBP/BEEA is a direct evidence for existence of anisotropic molecular aggregates in the mixture. The magnetic birefringence data carry information about aggregation behavior of the system25 and may be interpreted using the model presented in ref. 7 and 26 for low concentration liquid suspension of molecular self-aggregates of different shape and of different orientation of molecules inside the aggregate. According to this model the measured birefringence strongly depends on the induced orientational order of the whole aggregate, as well as on its shape (form birefringence) and on the orientation of individual molecules within the aggregates (intrinsic birefringence). The negative sign of the birefringence may results from the intrinsic birefringence of molecules oriented perpendicularly to the aggregate's axis itself being oriented parallel to the magnetic field direction. The absolute value is connected with the form birefringence, particularly with the aspect ratio of the structure. Drastic increase in the value of birefringence is the indication that an aggregate, which is reoriented by magnetic field, is changing its aspect ratio when concentration of BEEA increases. It is interesting to observe that the maximum value Δn/λ is not observed for stoichiometric composition (X = 0.5) where the abundance of H-bonded DBP–BEEA hetero-adducts is expected to be at its maximum, but for slightly higher content of BEEA (X ≅ 0.7). This shows that acid–base interactions between polar heads of both surfactants is not the only relevant aspect leading to super-molecular structure formation. Difference in shape of alkyl chains of the two molecules is equally important and is the factor causing nanosegregation at X = 0.7.

Let us now interpret the formation of stable anisotropic supra-molecular structures, highlighted by the increase in birefringence around X = 0.7 from a thermodynamic point of view. In excess of DBP (X < 0.5) the DBP–BEEA hetero-adducts formed by association between DBP and BEEA are not self-segregated and this means that they are as stable as the remaining DBP–DBP ones. In other words DBP–BEEA interactions are approximately as intense as DBP–DBP ones: these species are continuously exchanging by repeated H-bond breaking/formation so the system tends to be homogeneous and no segregation takes place. The situation is not symmetric for X > 0.5: in this situation, the excess of BEEA in the mixture makes a “solvent” which evidently is not able to form BEEA–BEEA interactions as strong as DBP–BEEA ones; therefore the DBP–BEEA structures tend to self-segregate driven by the enthalpic factor.

With an effort to interpret this phenomenon also at a nanoscopic scale, it also appears that smaller chains of DBP can be more easily accommodated in BEEA environment mostly formed by long and branched alkyl chains which offers a fluid and destructured chemical environment. When BEEA concentration is further increased (X > 0.7), the DBP concentration (and consequently the concentration of DBP–BEEA), further decreases as well as the enthalpic driving force decreases. The entropic force ultimately wins at high diluted regimes and so self-association decreases: in fact for X > 0.7 the birefringence decreases again showing the tendency to restore the homogeneity of pure BEEA.

Similar conclusion may be reached from concentration dependencies of equilibration times.

The existence of large scale anisotropic structures present in the system may be inferred from the absolute values of the time constants which are of the order of hundreds of seconds. As follows from Fig. 11, for X < 0.7 the relaxation times obtained after turning on and turning off the magnetic field, are almost the same. For higher concentrations, however, the time needed to reach the constant birefringence value induced by the magnetic field is clearly shorter than the time needed for system to relax after the magnetic field was turned off.

This fact can be connected with different origin of structural reorganization processes when the sample is being exposed to magnetic field or when it is allowed to freely relax. When the field is ON, reorientation is related to the torque applied by magnetic field to the induced magnetic dipole of an aggregate. For a given size of an aggregate, the torque increases with magnetic field induction making the orientation time shorter when magnetic field increases. After turning the field OFF the preferential orientation of aggregates (induced by magnetic field) slowly disappear until uniform equilibrium distribution is restored. This process is governed by the liquid structure and relates to the thermally-driven diffusive motion. The values of this characteristic time (of the order of ks) suggest that the diffusion process does not involve local molecular motions (as probed by the NMR) but rather concern reorganization of large scale structures. This can be taken as an evidence that dimensions of aggregates are substantial. The existence of long living magnetic field-induced anisotropy, that persists even upon field termination, was already observed in other complex liquids.27 Moreover, the fact that the relaxation times for field ON and field OFF situations are so high suggests that the aggregates are not created by the magnetic field. They form as a result of the intermolecular interactions and the effect of the magnetic field is limited only to their reorientation. If the magnetic field would be necessary to form and sustain the aggregate, its removing should be accompanied with disappearance of these structures on the time scale given by the molecular diffusion. As follows from PFG-NMR results, these times are much faster than the equilibration time of the birefringence.

Now, to further comment the data, let's compare the self-diffusion coefficients, Dt, from PFG-NMR with the macroscopic shear viscosities, ηS, using Stokes–Einstein (SE) relation Dt = kT/6πS (r is a radius of equivalent spherical particle and other symbols has usual meaning). If the relation holds then that diffusion coefficient should scale as the inverse of viscosity. The concentration dependencies of both quantities are shown in Fig. 12. Surprisingly, the Stokes–Einstein relation holds for very broad concentration range X < 0.7–0.8. In this concentration range the effective particle radius calculated from Stokes–Einstein relation is constant and assumes values expected for molecular probe (0.2–0.3 nm; inset in Fig. 12). The situation is more complex for higher BEEA concentrations where two different Dt values were observed. Here the Stokes–Einstein can be used to calculate two different particle radii using the same macroscopic viscosity value (inset of Fig. 12). It is clear that the radius obtained for BEEA (derived observing the α–CH2–N NMR peak) is too low to be ascribed to the size of any of the molecules studied. On the other hand, the apparent radius of DBP molecule (from α–CH2–P NMR peak) increases with concentration and assumes values which are too high to be connected with the size of trace molecule. This means that the SE relation breaks and the translational mobility of the DBP and BEEA are decoupled from macroscopic viscosity. This is the clear indication of nano-segregation phenomena where each of the two tracer molecules moves in locally different environment. This can be better shown if we introduce the concept of local viscosity28,29 and, using self-diffusion coefficients from NMR experiments and assuming constant dimensions of tracer particles (0.2 nm for DBP and 0.3 nm for BEEA), we calculate the viscosity values using SE relation. These values are reported in Fig. 12: it is clear that for pure DBP and BEEA (X = 0 and X = 1) the SE holds and local viscosity experienced by the DBP or BEEA molecule coincides with the macroscopic one. However, in the 0.5 < X < 1 range, the two local viscosities start to differ significantly. Locally the BEEA moves much faster than one would expect from macroscopic viscosity. It is an indication of local structures being dissolved in a basin of bulk BEEA. Observed diffusion should be ascribed to the motion of BEEA molecules which do not participate in nano-aggregates. The tracer molecule rather belong to bulk solvent or to molecules within the aggregate which are constantly exchanging with the bulk solvent. For the same high concentrations of BEEA, the local viscosity experienced by DBP molecules is evidently higher then macroscopic. Here, essentially every DBP molecule contributes to the formation of aggregates, therefore the measured DBP mobility correspond to the their motion with an aggregate. For this case, local viscosity values are higher than macroscopic one just because the effective radius of an aggregate is higher (Fig. 12) than the true radius of tracer DBP molecule.


image file: c6ra02386j-f12.tif
Fig. 12 Self-diffusion coefficients, Dt, derived from PFG-NMR experiments, as compared to the inverse macroscopic shear viscosity as a function of X. The inset reports the calculated r value (radius of equivalent spherical particle) calculated from the Stokes–Einstein equation (see text).

Further increase in the amount of DBP makes the dimensions and concentration of aggregates to grow and eventually they start to overlap (it is expected to percolate, in accordance with data from rheology). At this concentration (X = 0.8) they cannot anymore move freely across the sample. Now, the observed mobility of DBP molecules correspond to their motion through the environment whose viscosity correspond to the macroscopic one.

Summary and conclusions

A deep investigation of structural and dynamical features of surfactant mixtures formed by DBP and BEEA allowed us to point out in details the rich phenomenology showed by such systems. Their mixtures are clear, stable, and water-free. By FT-IR spectroscopy it has been highlighted that acid–base interactions between the acidic DBP polar head and the basic BEEA one take place. This leads to DBP–BEEA association. As a consequence, also the apolar part of the system made by the alkyl tails of both molecules is subjected to slight structural rearrangement. Coherently, this kind of interactions leads to a maximum in viscosity at DBP[thin space (1/6-em)]:[thin space (1/6-em)]BEEA 1[thin space (1/6-em)]:[thin space (1/6-em)]1 composition (X = 0.5). At this composition the bicontinuous structure is the most probable from statistical and chemical considerations. This is therefore a structure made from strongly interacting domains (see rheology findings) which tend to percolate, with zero threshold, at X = 0.5 composition; the structure is then formed by acid/base heads which separate basins of alkyl chains uniformly folded/creased so the system is, in the 0 < X < 0.5 range, uniform due to the rapid intermolecular exchange occurring at short timescale (see NMR), and isotropic (see birefringence). Interestingly, in the 0.5 < X < 1 regime, a self-segregation tendency takes place. All this is confirmed by NMR experiments which also show that a decoupling of diffusional dynamics of DBP and BEEA takes place in the 0.5 < X < 1 range: the data suggest that DBP is aggregated with formation of long-living DBP-rich domains floating in almost pure BEEA.

The observed percolation phenomenon highlights that the addition of BEEA to DBP or vice versa leads to the formation of a transient network of dynamically interacting DBP–BEEA building blocks extending for macroscopic distances. The temperature dependence of the B exponent indicates that an increase of the thermal agitation affects the processes responsible of the structural relaxation time of the system.

The behaviour of acoustic parameters obtained from Brillouin light scattering technique confirms the existence of strong attractive interactions between both components in the mixtures as the driving force for the formation of rigid inter-molecular aggregates, confirming, also from the mechanical point of view, that the system is uniform and isotropic on the scale larger than 200 nm.

Finally, magnetically-induced birefringence showed that the nano-segregation tendency in the 0.5 < X < 1 range leads to the formation of long-living anisotropic aggregates which are able to efficiently respond to a magnetic field. A maximum in magnetically-induced birefringence takes place at X = 0.75 indicating the presence of anisotropic nanodemixed supramolecular aggregates most presumably made by both DBP and BEEA molecules and surrounded by the excess of the poorly interacting BEEA. This study for the first time shows the existence of anphiphile-based micelles dispersed in amphiphilic solvent. This peculiarity, mere consequence of the opportune choice of the molecules involved, leads to the formation of living intermolecular aggregates fully responsive to a magnetic field able to show optical birefringence.

The nanoscopic molecule-based and thermodynamic aspects of all these phenomena have been clarified and a detailed picture of the behaviour has been given: the novelty of the system and the peculiarity of the observed phenomena are worth to be tailored for specific applications.

References

  1. P. Calandra, V. Turco Liveri, P. Riello, I. Freris and A. Mandanici, J. Colloid Interface Sci., 2012, 367, 280 CrossRef CAS PubMed .
  2. P. Calandra, I. Nicotera, C. O. Rossi and V. Turco Liveri, Langmuir, 2013, 29, 14848 CrossRef CAS PubMed .
  3. P. Calandra, V. Turco Liveri, A. M. Ruggirello, M. Licciardi, D. Lombardo and A. Mandanici, J. Mater. Chem. C, 2015, 3, 3198 RSC .
  4. E. O. Stejskal and J. E. Tanner, J. Chem. Phys., 1965, 42, 288 CrossRef CAS .
  5. I. Nicotera, C. Oliviero Rossi, V. Turco Liveri and P. Calandra, Langmuir, 2014, 30, 8336 CrossRef CAS PubMed .
  6. M. Koralewski, M. Pochylski and J. Gierszewski, J. Magn. Magn. Mater., 2011, 323, 1140 CrossRef CAS .
  7. J. C. Gielen, I. O. Shklyarevskiy, A. P. H. J. Schenning, P. C. M. Christianen and J. C. Maan, Sci. Technol. Adv. Mater., 2009, 10, 014601 CrossRef .
  8. M. I. Melnik, V. I. Spiryakov, V. T. Filimonov and E. A. Karelin, J. Alloys Compd., 1998, 275, 863 CrossRef .
  9. L. D. Kurbatova and D. I. Kurbatov, Russ. J. Appl. Chem., 2007, 80, 2028 CrossRef CAS .
  10. R. A. Heacock and L. Marion, Can. J. Chem., 1956, 34, 1782 CrossRef CAS .
  11. W. H. Thompson and J. T. Hynes, J. Phys. Chem. A, 2001, 105, 2582 CrossRef CAS .
  12. J.-X. Li, J. A. Gardella Jr and P. J. McKeown, Appl. Surf. Sci., 1995, 90, 205 CrossRef CAS .
  13. M. E. Cates, Macromolecules, 1987, 20, 2289 CrossRef CAS .
  14. M. E. Cates, J. Phys., 1988, 49, 1593 Search PubMed .
  15. K. Kurumada, A. Shioi and M. Harada, J. Phys. Chem., 1994, 98, 12382 CrossRef CAS .
  16. S. Onogi, S. Kimura, T. Kato, T. Masuda and N. Miyanaga, J. Polym. Sci., Part C: Polym. Symp., 1966, 15, 381 CrossRef .
  17. E. Schonfelder and H. Hoffmann, Ber. Bunsenges. Phys. Chem., 1994, 98, 842 CrossRef .
  18. S. A. Trugman and A. Weinrib, Phys. Rev. B: Condens. Matter Mater. Phys., 1985, 31, 2974 CrossRef .
  19. J. P. Boon and S. Yip, Molecular Hydrodynamics, McGraw-Hill, New York, 1980 Search PubMed .
  20. B. J. Berne and R. Pecora, Dynamic Light Scattering, Wiley Interscience, 1976 Search PubMed .
  21. H. Kuttruff, Ultrasonics: Fundamentals and Applications, Springer Science & Business Media, 2012 Search PubMed .
  22. F. Aliotta, J. Gapiński, M. Pochylski, R. C. Ponterio, F. Saija, G. Salvato and C. Vasi, Phys. Rev. E: Stat., Nonlinear, Soft Matter Phys., 2013, 87, 022303 CrossRef CAS PubMed .
  23. P. Calandra, A. Mandanici, V. Turco Liveri, M. Pochylski and F. Aliotta, J. Chem. Phys., 2012, 136, 064515 CrossRef PubMed .
  24. D. A. Pinnow, S. J. Candau, J. T. LaMacchia and T. A. Litovitz, J. Acoust. Soc. Am., 1968, 43, 131 CrossRef CAS .
  25. T. Ostapenko, Y. A. Nastishin, P. J. Collings, S. N. Sprunt, O. D. Lavrentovich and J. T. Gleeson, Soft Matter, 2013, 9, 9487 RSC .
  26. O. Levy, Phys. Rev. E: Stat., Nonlinear, Soft Matter Phys., 2002, 66, 011404 CrossRef PubMed .
  27. M. A. Firestone, D. M. Tiede and S. Seifert, J. Phys. Chem. B, 2000, 104, 2433 CrossRef CAS .
  28. J. Szymański, A. Patkowski, A. Wilk, P. Garstecki and R. Holyst, J. Phys. Chem. Lett., 2006, 110, 25593 CrossRef PubMed .
  29. J. Szymański, A. Wilk, R. Hołyst, G. Roberts, K. Sinclair and A. Kowalski, J. Non-Newtonian Fluid Mech., 2008, 148, 134 CrossRef .

Footnote

Electronic supplementary information (ESI) available. See DOI: 10.1039/c6ra02386j

This journal is © The Royal Society of Chemistry 2016