DOI:
10.1039/C6RA02214F
(Paper)
RSC Adv., 2016,
6, 24645-24650
Improving the catalytic activity of Au/Pd core–shell nanoparticles with a tailored Pd structure for formic acid oxidation reaction
Received
25th January 2016
, Accepted 25th February 2016
First published on 26th February 2016
Abstract
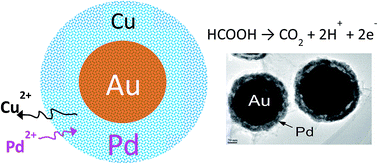
Unique morphology-tunable Au/Pd core–shell nanoparticles were synthesized by galvanic replacement of preformed Cu on hollow Au cores using different PdCl2 concentrations. The nanoparticles were characterized by X-ray diffraction (XRD), transmission electron microscopy (TEM), X-ray photoelectron spectroscopy (XPS), and electrochemical analysis. The results showed that the structure of the nanocrystalline Pd on the hollow Au core surface was strongly dependent on the PdCl2 concentration. It was found that Pd2+ ions transport and react in the porous Cu layer, helping to create a continuous but porous structure which enlarges the Pd surface area and increases the electrochemical activity. In addition, the Au/Pd core–shell nanoparticles displayed superior electrochemical performance and stability in formic acid oxidation than commercial Pd black, especially for the ones synthesized using 2.5 mM PdCl2. The enhanced electrocatalytic performance may be attributed to the optimum electronic coupling effect caused by the interaction between the specific Pd structure and the hollow Au core.
1. Introduction
Electrochemical formic acid oxidation (FAO) has attracted lots of attention due to its promising application in direct formic acid fuel cells (DFAFCs).1,2 There are many efforts focusing on developing highly active catalysts such as Pt and Pt-based materials;3 however, the inevasible poisoning effect by CO generated during the FAO reaction on the Pt-based catalysts via either a direct dehydrogenation or an indirect dehydration pathway3 has haunted the development of such catalysts. Alternatively, Pd and Pd-based catalysts have demonstrated higher electrochemical activity toward FAO primarily due to a direct dehydrogenation pathway where CO2 is directly generated during the reaction.4
Since the Pd has been reported to be potentially corroded in the acid environment of a DFAFC,5,6 enhancement of Pd stability is crucial.7 Among many studies of Pd-base materials for FAO, the core–shell structure exhibits not only higher FAO ability, but also superior electrochemical stability than commercial catalysts. The reported electrochemical stability arises from the electronic coupling effect between catalytic shell and noble core.8–10 Most important, the core–shell structured catalysts provide a versatile platform to tailor the electronic coupling between the core and shell. For example, optimizing the size and structure of nanocrystalline Pd,11 and the alloying degree12 between the core and shell was proved to result in enhancement of FAO activity because of the modified electronic structure of Pd caused by d-band center shift.13,14
In our previous report,15 the core–shell Au/Pd nanoparticles have been demonstrated to be a suitable platform to study the electronic coupling effect by varying Pd thickness on the hollow Au core. By simply controlling of the Cu deposition time, the thickness of the Pd shell that formed through galvanic replacement of the Cu outer layer can be adjusted. In the present study, the detailed work will be focused on enhancing electrochemical performance of the Au/Pd core–shell nanoparticles via changing the Pd shell morphology and structure using different PdCl2 concentration. It was found that the Au/Pd nanoparticles with continuous and porous Pd shell, particularly with {100}16 cubic facet, displayed enhanced catalytic activity and stability in FAO as compared with commercial Pd black.
2. Experimental
2.1 Materials and synthesis
The core–shell Au/Pd nanoparticles were synthesized were synthesized according to our previous study.15 First, the electrodeposited Au cores were prepared by the hydrogen bubble-template synthesis method with the average size around 120 nm in diameter.17 Then, Cu layers were coated on the hollow Au cores for 20 minutes via electroless plating using an electrolyte comprising 0.4 M CuSO4, 0.17 M EDTA disodium salt dehydrate (Sigma), and formaldehyde (Sigma) at pH = 10. Later, porous Pd crystalline shells were formed on the Au cores via galvanic replacement of the Cu layers at different concentration of PdCl2 solution for 20 minutes. The spontaneous galvanic replacement reaction is driven by their different standard reduction potentials between Pd2+/Pd (0.987 V vs. SHE) and Cu2+/Cu (0.337 V vs. SHE).
2.2 Characterization
The crystalline structures of the nanoparticles were examined by X-ray diffraction (XRD) with a Cu Kα source (Siemens D500) from 30° to 80° at the scan rate of 1° min−1. The nanoparticle size and crystalline structure were investigated by a Hitachi H-9500 high-resolution transmission electronic microscope at 300 kV. The electronic structures on the surface of Au/Pd core–shell nanoparticles were explored by X-ray photoelectron spectroscopy (XPS) (Perkin-Elmer Phi 560 XPS/Auger System). The mass fractions of Au, Cu and Pd in the particles were determined using a Perkin-Elmer ELAN DRC II inductively coupled plasma mass spectrometer (ICP-MS).
2.3 Electrochemical tests
Electrochemical data were collected using a Princeton Applied Research 227 potentiostat in a three-electrode configuration consisting of a glassy carbon rotating disc electrode (RDE, Pine Instrument Company, 0.19635 cm2), a Pt mesh counter electrode, and a reference electrode (normal hydrogen electrode, NHE). 15 mg catalysts were mixed with 12 ml DI water and 4.4 μl 5 wt% Nafion solution (Ion Power Inc.). Subsequently, 15 μl solution was dropped on the RDE glassy carbon electrode and then dried under an IR lamp. Cyclic voltammetry (CV) scan from 0.075 V to 1.2 V at a rate of 10 mV s−1 in 0.1 M Ar-purged HClO4 solution was employed to study electrochemical characteristics of the nanoparticles. Formic acid oxidation (FAO) measurement was performed in a mixed electrolyte of 0.1 M HClO4 and 0.1 M formic acid at a rotation speed of 1000 rpm. CO-stripping CV experiment was also conducted in 0.1 M Ar-purged HClO4 solution after absorption of CO at 0.2 V for 900 seconds in CO-saturated 0.1 M HClO4. To study catalyst stability, chronoamperometry (CA) test was performed at 0.3 V for 1000 seconds in Ar-purged 0.1 M HClO4 solution.
3. Results and discussion
3.1 Structures of Au/Pd core–shell nanoparticles and electronic coupling
To prepare the Au/Pd core–shell nanoparticles, galvanic replacement of Cu occurred in 0.4 M citric acid solution with different PdCl2 concentration, i.e., 1 mM, 2.5 mM, 5 mM, and 10 mM. The synthesized particles were examined by XRD. The diffraction patterns of the Pd black sample in Fig. 1 shows the fcc-structured Pd reflection peaks at 40.1°, 46.5°, 68.0° corresponding to (111), (200) and (220) planes (JCPDS No. 87-0639), respectively. On the other hand, the Au/Pd nanoparticles reveal distinct peaks corresponding to crystalline Au and Pd components. It is evident that the highly intense fcc-structured Au signals at 38.2°, 64.9°, and 77.6° are attributed, respectively, to (111), (200), and (220) planes (JCPDS No. 65-2870). The barely visible diffraction peaks of Pd from the Au/Pd nanoparticles suggest polycrystalline nature of the Pd shells with substantially small Pd crystallites dispersed at the Au surface. Besides, disappearance of the Cu (111) peak at around 43.6° (JCPDS No. 04-0836) in the Au/Pd nanoparticles may suggest nearly complete amorphous Cu layer at the surface of Au after the galvanic replacement reaction.
 |
| Fig. 1 XRD patterns of the Au/Pd nanoparticles prepared using different PdCl2 concentrations. The commercial Pd black was employed as a reference. | |
To investigate the electronic coupling effect between the Au cores and Pd shells, XPS was used to probe the electronic state of Pd at the surface of the particles. As shown in Fig. 2, the Pd 3d spectra of the Pd black (∼8 nm nanoparticle size) exhibit two peaks, Pd 3d5/2 and Pd 3d3/2, with the bonding energy at 335.45 eV and 340.51 eV, respectively. In the Au/Pd nanoparticles synthesized using different PdCl2 concentrations, however, the binding energy of Pd 3d5/2 slightly shifts to lower energy compared to that in the Pd black, e.g., 335.41 eV for 10 mM, 335.31 eV for 5 mM, and 335.12 eV for 2.5 mM. However, the XPS signal of the Au/Pd nanoparticles using 1.0 mM PdCl2 is very weak due to very few Pd nanocrystallites dispersed on the hollow Au surface, which is further examined by HRTEM as shown in Fig. 3. The slight reduction in Pd 3d5/2 binding energy may result from the structural change of Pd nanocrystallites at the Au core surface.15 In addition, as suggested by our previous report,15 higher electrochemical activity could be achieved for Pd with lower Pd 3d5/2 binding energy, which means the Au/Pd core–shell nanoparticles synthesized using 2.5 mM may exhibit better FAO activity due to possibly stronger chemisorption of formate on the catalyst surface and weak absorption of CO. Our discovery seems to be corroborated by many reports in the literature. Skrabalak et al. found that the electronic structure of metal nanocrystals can be manipulated to influence the catalytic activities.18 Tsung et al. also studied the effect of lattice strain caused by lattice mismatch between Au core and Pd shell. Their group discovered that the lower potentials for CO stripping and higher current densities for FA oxidation for the strained nanoparticles because of the change in their d-band centers.19 Similar phenomenon was found in Au@Ag/Pd nanoparticles from Yang's group.20
 |
| Fig. 2 XPS spectra of Pd 3d peaks for the Au/Pd nanoparticles at different PdCl2 concentrations. The commercial Pd black was employed as a reference. | |
 |
| Fig. 3 TEM images of the Au/Pd nanoparticles at different PdCl2 concentrations. (a) 1 mM, (b) 2.5 mM, (c) 5 mM, (d) 10 mM. The scale bar is 100 nm. (e) The schematic illustration of the different Pd structures using different concentrations of PdCl2. | |
The Au/Pd nanoparticles obtained using different PdCl2 concentrations were further studied by HRTEM. The TEM images in Fig. 3 evidently reveal the Au cores and Pd shells, which are distinguished by their contrast due to different atomic masses. The Au/Pd nanoparticles produced using 1.0 mM PdCl2 in Fig. 3a clearly show the hollow Au cores but with hardly perceptible Pd shells – only a few isolated gray-colored bumps at the surface are deemed as Pd nanocrystallites. In contrast, Fig. 3b displays a continuous Pd layer at the surface with thickness around 10 nm when the PdCl2 concentration increased to 2.5 mM. However, the Pd shells appear rough with island-like domains at the Au surface when further increasing the PdCl2 concentration. Besides, the Pd crystallites become small and well-dispersed at the Au core surface when the PdCl2 concentration rose to 10 mM. Similar change in morphology was also reported by Du et al.21 and is believed to be caused by a complex competing reaction between deposition of Pd due to galvanic replacement and simultaneous etching of Cu as shown in Fig. 3e. When the PdCl2 concentration is low (i.e. 1.0 mM), the etching rate dominates, a small portion of Pd reacted to form tiny Pd nanocrystallites at the Au surface. When the PdCl2 concentration increases to 2.5 mM, the galvanic replacement reaction and etching rate may reach to a balance as Pd2+ ions transport and react in the porous Cu layer, thus a continuous but porous structure is generated. This porous structure would enlarge the Pd surface area and increase the electrochemical activity. However, when the PdCl2 concentration further increases to 5.0 mM, the galvanic replacement reaction starts to dominate the overall reaction and the reaction zones tend to shift to the Au core surface as Fig. 3e shown, which may cause the Pd layer to become dense and island-like structure. This morphology change could also lead a reduction in the surface area, therefore lower electrochemical activity toward FAO. Finally, when the PdCl2 concentration increases to 10.0 mM, a small portion of the solid Pd nanoparticles are even embedded in the Au cores due to the rapid galvanic replacement reaction.
3.2 Electrochemical studies
The electrochemical characteristics of the Au/Pd core–shell nanoparticles were examined to consolidate the observed structural and electronic studies. The CV curves shown in Fig. 4 were normalized to the Pd mass in each sample and the one for the Au/Pd nanoparticle using 1 mM PdCl2 is shown in the inset. Fig. 4 shows that the sample prepared using 2.5 mM PdCl2 exhibits the highest hydrogen desorption and oxygen reduction peaks, owing to the porous and continuous Pd shells as shown in Fig. 3. Furthermore, the catalytic activity of the Au/Pd nanoparticles toward FAO was tested in a mixed solution of 0.1 M formic acid and 0.1 M perchloric acid at 1000 rpm. From the curves in Fig. 5, the mass-normalized FAO current density between 0.2 V and 0.4 V is similar for all the Au/Pd nanoparticles except the Pd black, which is less active. Particularly, the sample prepared using 2.5 mM PdCl2 exhibits the highest mass-specific current density (normalized to the Pd mass) than others, which is in agreement with the XPS results in Fig. 2. On the contrary, the Pd black demonstrates the lowest FAO ability due to lack of electronic coupling as observed in the core–shell nanoparticles. A careful investigation reveals that the peak potential and onset FAO oxidation potential of the core–shell nanoparticles (at 0.58 V and 0.14 V, respectively) using 2.5 mM PdCl2 are more than 60 mV lower compared to those of the Pd black (at 0.65 V and 0.2 V), and therefore they represent as promising catalysts for DFAFCs.22 Fig. 6 shows the detected Cu fraction in the shells, i.e., Cu/(Cu + Pd), and FAO peak current density as a function of PdCl2 concentration. With increasing PdCl2 concentration from 1 mM to 10 mM, the Cu fraction drops from 0.82 to 0.52, at 5 mM the least amount of Cu remains in the Au/Pd nanoparticles. The detected Cu results from non-well replaced Cu layers on the surface of the Au cores. In addition, the Au/Pd nanoparticles prepared using 2.5 mM PdCl2 exhibit the highest FAO peak current density (0.48 mA μg−1) than other Au/Pd catalysts (1 mM: 0.30 mA μg−1, 5 mM: 0.32 mA μg−1, 10 mM: 0.27 mA μg−1).
 |
| Fig. 4 CV curves of different Au/Pd nanoparticles and the commercial Pd black. The curve for the Au/Pd core–shell nanoparticles synthesized using 1 mM PdCl2 is shown in the inset. | |
 |
| Fig. 5 FAO CV of the Au/Pd nanoparticles at different PdCl2 concentrations and commercial Pd black in a mixed electrolyte containing 0.1 M HClO4 and 0.1 M formic acid in the potential range from 0.03 V to 1.4 V. The current densities are normalized to the Pd mass in the samples. | |
 |
| Fig. 6 Cu mass fraction in the shell (black line) and FAO peak current density as a function of the PdCl2 concentration (blue line). | |
The electronic property of the nanoparticles was also probed by electrochemical CO-stripping CV. In Fig. 7, the samples prepared using 1 mM PdCl2 shows manifestly different shapes in comparison with others, owing to their low coverage of Pd on the particle surface. The Au/Pd nanoparticles using the 2.5 mM PdCl2 exhibit the lowest CO oxidation potential at 0.85 V among other catalysts (5 mM: 0.86 V, 10 mM: 0.89 V, and Pd black: 0.94 V). These Au/Pd nanoparticles therefore display superior CO oxidation ability than the Pd black due to the stronger electronic coupling between the Au cores and Pd shells, which has been confirmed from the previous XPS results. The strong CO oxidation ability could contribute to the discovered enhanced FAO stability, if through the dehydration pathway (i.e., HCOOH → COads + H2O → CO2 + 2H+ + 2e−), since CO poison to the catalysts could be alleviated. From the CO-stripping CV curve, the crystallographic information of Pd could also be derived. According to Tsung's discovery,23 the Pd structure of the Au/Pd nanoparticles may shift from cubic (100) crystal facet (CO oxidation peak potential of ∼0.8 V) to octahedral (110) crystal facet (∼0.9 V) when increasing PdCl2 concentration. Therefore, the Au/Pd core–shell nanoparticles synthesized using 2.5 mM PdCl2 may consist of large-populated Pd (100) facets at the surface resulting in more favorable catalytic FAO activity.
 |
| Fig. 7 CO-stripping CV curves of the Au/Pd nanoparticles and Pd black from 0.075 V to 1.2 V in 0.1 M HClO4 solution. The current densities are normalized to the mass of Pd in different samples. | |
To access the stability of catalytic FAO, chronoamperometry was used to study different Pd samples in a mixed solution of 0.1 M formic acid and 0.1 M perchloric acid at 0.3 V for 1000 seconds. The results in Fig. 8 show that using 2.5 mM PdCl2 the prepared Au/Pd nanoparticles exhibit the highest mass-specific current density (at 0.035 mA μg−1) with the least decay among all the Au/Pd catalysts (1 mM: 0.0032 mA μg−1, 5 mM: 0.007 mA μg−1, and 10 mM: 0.013 mA μg−1) and Pd black (0.001 mA μg−1), as a result of both optimized structure and electronic property, as demonstrated in Fig. 2, 3, and 7, respectively.
 |
| Fig. 8 CA curves of the Au/Pd nanoparticles and Pd black at 0.3 V in a mixed electrolyte consisting of 0.1 M HClO4 and 0.1 M formic acid. | |
4. Conclusion
Core–shell Au/Pd nanoparticles were synthesized by galvanic replacement of Cu using PdCl2 on the hollow Au cores. The Pd structure was tuned using different concentration of PdCl2 solution. When the galvanic replacement and etching rates reach to a balance where the Pd structure is determined by both rates, the continuous and porous Pd shells were formed. The electrochemical results indicate the Au/Pd nanoparticles demonstrated superior FAO activity and stability than the commercial Pd black. Particularly, the ones prepared using 2.5 mM PdCl2 exhibit outstanding catalytic properties due to the optimum electronic coupling effect between the Pd shells and the hollow Au cores. Besides, the discovered electronic property change is accompanied by more Pd (100) facets at the surface of the hollow Au cores. As a result, the developed Au/Pd core–shell nanoparticles display high electrochemical FAO activity and stability, thus appearing as promising electrocatalysts for DFAFC applications.
Acknowledgements
Support to Electrochemical Energy Laboratory at University of Texas at Arlington (UTA) from state of Texas is greatly acknowledged. C. H. would like to thank Dr C. W. Huang and Dr Y. W. Hao for their great assistance, and the UTA Characterization Center for Materials and Biology (CCMB) for the technical support. M. W. would like to acknowledge Jiangsu Normal University for financial support.
References
- X. Yu and P. G. Pickup, J. Power Sources, 2008, 182, 124–132 CrossRef CAS.
- I. Al-Akraa, A. M. Mohammad, M. S. El-Deab and B. E. El-Anadouli, Int. J. Electrochem. Sci., 2012, 7, 3939–3946 CAS.
- S. Wang, N. Kristian, S. Jiang and X. Wang, Electrochem. Commun., 2008, 10, 961–964 CrossRef CAS.
- X. Yu and P. G. Pickup, Electrochem. Commun., 2009, 11, 2012–2014 CrossRef CAS.
- S. Ha, R. Larsen and R. Masel, J. Power Sources, 2005, 144, 28–34 CrossRef CAS.
- Y. Zhu, Z. Khan and R. Masel, J. Power Sources, 2005, 139, 15–20 CrossRef CAS.
- H. Jeon, S. Uhm, B. Jeong and J. Lee, Phys. Chem. Chem. Phys., 2011, 13, 6192–6196 RSC.
- S. Chen, Z. Wei, X. Qi, L. Dong, Y.-G. Guo, L. Wan, Z. Shao and L. Li, J. Am. Chem. Soc., 2012, 134, 13252–13255 CrossRef CAS PubMed.
- Y. Kang, L. Qi, M. Li, R. E. Diaz, D. Su, R. R. Adzic, E. Stach, J. Li and C. B. Murray, ACS Nano, 2012, 6, 2818–2825 CrossRef CAS PubMed.
- V. Celorrio, M. M. de Oca, D. Plana, R. Moliner, D. Fermín and M. Lázaro, Int. J. Hydrogen Energy, 2012, 37, 7152–7160 CrossRef CAS.
- J. Ge, W. Xing, X. Xue, C. Liu, T. Lu and J. Liao, J. Phys. Chem. C, 2007, 111, 17305–17310 CAS.
- G. Zhang, Y. Wang, X. Wang, Y. Chen, Y. Zhou, Y. Tang, L. Lu, J. Bao and T. Lu, Appl. Catal., B, 2011, 102, 614–619 CrossRef CAS.
- L. Xiao, L. Zhuang, Y. Liu and J. Lu, J. Am. Chem. Soc., 2008, 131, 602–608 CrossRef PubMed.
- P.-P. Fang, S. Duan, X.-D. Lin, J. R. Anema, J.-F. Li, O. Buriez, Y. Ding, F.-R. Fan, D.-Y. Wu and B. Ren, Chem. Sci., 2011, 2, 531–539 RSC.
- C. Hsu, C. Huang, Y. Hao and F. Liu, Electrochem. Commun., 2012, 23, 133–136 CrossRef CAS.
- S. Baik, J. Han, J. Kim and Y. Kwon, Int. J. Hydrogen Energy, 2011, 36, 14719–14724 CrossRef CAS.
- C. Huang, J. Jiang, M. Lu, L. Sun, E. I. Meletis and Y. Hao, Nano Lett., 2009, 9, 4297–4301 CrossRef CAS PubMed.
- M. Laskar and S. E. Skrabalak, J. Mater. Chem. A, 2016 10.1039/c5ta09368f.
- C. H. Kuo, L. K. Lamontagne, C. N. Brodsky, L. Y. Chou, J. Zhuang, B. T. Sneed, M. K. Sheehan and C. K. Tsung, ChemSusChem, 2013, 6, 1993–2000 CrossRef CAS PubMed.
- D. Chen, C. Li, H. Liu, F. Ye and J. Yang, Sci. Rep., 2015, 5, 11949 CrossRef PubMed.
- X. Li, H. Liu, J. Yang, S.-Z. Qiao and X.-W. Du, RSC Adv., 2014, 4, 1185–1188 RSC.
- X. Qiu, H. Zhang, Y. Dai, F. Zhang, P. Wu, P. Wu and Y. Tang, Catalysts, 2015, 5, 992–1002 CrossRef CAS.
- B. T. Sneed, C.-H. Kuo, C. N. Brodsky and C.-K. Tsung, J. Am. Chem. Soc., 2012, 134, 18417–18426 CrossRef CAS PubMed.
|
This journal is © The Royal Society of Chemistry 2016 |
Click here to see how this site uses Cookies. View our privacy policy here.