Maltitol-based biodegradable polyesters with tailored degradation and controlled release for bone regeneration

Janeni Natarajana, Giridhar Madrasb and Kaushik Chatterjee*c
aCentre for Nano Science and Engineering, Indian Institute of Science, Bangalore-560012, India
bDepartment of Chemical Engineering, Indian Institute of Science, Bangalore-560012, India
cDepartment of Materials Engineering, Indian Institute of Science, Bangalore-560012, India. E-mail: kchatterjee@materials.iisc.ernet.in; Tel: +91-80-22933408

Received 23rd January 2016 , Accepted 30th March 2016

First published on 31st March 2016


Abstract

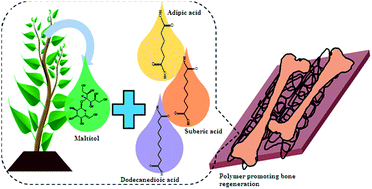
Despite extensive research performed in the area of drug delivery and tissue engineering, the search for a perfect biomaterial remains an ongoing process. In an effort to find this material, novel maltitol-based polyesters using three different dicarboxylic acids (DCAs; adipic acid, dodecanedioic acid and suberic acid) were synthesized and their properties were investigated. The chemical structure of the polymers was confirmed using Fourier transform infrared and proton nuclear magnetic resonance spectroscopies. Thermal characterization revealed that the polymers were amorphous and that the glass transition temperature decreased with an increase in the chain length and molar ratio of maltitol[thin space (1/6-em)]:[thin space (1/6-em)]DCAs. Mechanical studies showed that the moduli of these polymers were comparable to those of the components of the skeletal system. Contact angle goniometry confirmed that the hydrophobicity of the polymers increased with increase in chain length and the molar ratio of maltitol[thin space (1/6-em)]:[thin space (1/6-em)]DCAs. The polymer degradation followed first order kinetics whereas dye release from these polymers followed zero order kinetics. Both the degradation and dye release studies demonstrated that the degradation and release decreased with increase in chain length and molar ratio of maltitol[thin space (1/6-em)]:[thin space (1/6-em)]DCA. The degradation and dye release can be modulated based on the chain length and the molar ratio of acids. Preliminary cytocompatibility studies showed that these polymers were cytocompatible. Mineralization studies revealed that these polymers showed increased mineralization when compared to results obtained with controls. Thus, this family of polyesters can serve as effective biomaterials for bone tissue engineering with tunable degradation and controlled release properties.

1. Introduction

A report1 from the World Health Organization (WHO) indicated that nine million hip fractures occurred globally in 2000 and it is expected to increase significantly by 2050. Up to the present time, autologous bone grafting treatment had been the gold standard to ameliorate this predicament. However, the limited supply of bone grafts and the associated morbidity have motivated scientists to discover functional alternatives.2 Bone tissue engineering with bone marrow derived human mesenchymal stem cells (hMSCs) is a burgeoning scientific alternative used to address this problem.3 However, only rigid matrices can direct hMSCs towards osteogenic lineages.4 Therefore, the prerequisite of bone tissue engineering is a biodegradable and a biocompatible scaffold with mechanical properties that mimic the hierarchical structure of bone.5 Furthermore, a new trend is the incorporation of biologically active materials into the scaffolds that augment the bone regeneration and prevent bacterial infections and inflammation.6 So, it is apparent that developing a biomaterial that possesses synergistic properties of release and bone regeneration is of paramount importance.

Synthetic biodegradable polymers are preferred over natural polymers, metals and ceramics, because of their flexibility in tailoring the physical properties, tissue response, biodegradability and biocompatibility.5,7 They have been employed in a variety of biomedical applications such as drug delivery and tissue engineering.8,9 The wide usage of polyesters among the biodegradable polymers can be ascribed to their myriad advantages.10

Polyesters such as poly(lactic-co-glycolic acid) (PLGA) and polycaprolactone (PCL) used clinically in certain compositions/formulations pose certain problems such as leaching of acidic degradation products.11,12 Driven by the incentives, research is in progress to tackle the previously mentioned limitations and to find an ideal biomaterial. Sugar-based alcohols have been widely studied and used in the polycondensation of biodegradable polyesters.13 Maltitol was chosen for the present study because it is non-toxic and cytocompatible because sugar alcohols are endogenous to human metabolism.14 In addition, it is hypothesized that the structure of maltitol will enhance the mechanical properties of the resulting polymers15 and the presence of several OH groups will increase the crosslinking resulting in a higher modulus.16 Furthermore, the hydrophobicity of the maltitol-based polymers can be tuned.

A study of maltitol-based biodegradable polyesters showed the highest cytocompatibility for maltitol polymers when compared to other polyol-based polymers.13 Studies on maltitol with sebacic acid,13 xylitol with suberic acid17 and glycerol with dodecanedioic acid have also been reported.18 However, a systematic study on varying the chain length of the acids and/or molar ratios is not available. Therefore, a library of polymers was synthesized by performing an easy, catalyst free melt condensation of maltitol and different dicarboxylic acids (DCA; adipic acid, dodecanedioic acids and suberic acid) with varying stoichiometric ratios. These acids are naturally derived fatty metabolites with linearly increasing chain lengths resulting in an array of properties.17 By varying the chain lengths of the diacids and stoichiometric ratios, the properties such as degradation rate, mechanical strength and dye release could be tailored.

2. Materials and methods

2.1. Materials

Maltitol was purchased from TCI chemicals (Japan). The DCAs (adipic acid, dodecanedioic acid and suberic acid) were obtained from Sigma-Aldrich (USA). N,N-Dimethylformamide (DMF) was purchased from Merck (India).

2.2. Synthesis

The synthesis of these polyesters was by a simple melt condensation reaction. Maltitol was reacted with different DCAs (adipic acid, dodecanedioic acids and suberic acid) in different molar stoichiometric ratios of 1[thin space (1/6-em)]:[thin space (1/6-em)]1, 1[thin space (1/6-em)]:[thin space (1/6-em)]2, and 1[thin space (1/6-em)]:[thin space (1/6-em)]4 (Scheme 1). All the esterification reactions were performed in a 50 mL two-necked round bottomed flask at 180 °C. The reactions were continued for 2 h with uninterrupted purging of nitrogen (N2) gas. The yield was between 80 and 90% in all cases. The prepolymers obtained were subjected to a further post-polymerization process in a vacuum oven at 120 °C with a pressure of −700 mm Hg for two days. All samples were washed with water for purification and removal of unreacted acids. The reaction is depicted in Scheme 1.
image file: c6ra02058e-s1.tif
Scheme 1 Reaction scheme for the synthesis of the polyesters in the molar ratio of 1[thin space (1/6-em)]:[thin space (1/6-em)]1. Red dots near the –OH groups indicate that these groups may also be involved in esterification because it is a random polymerization.

2.3. Nomenclature

The polymers were named based on the first letter of the diol and the DCA used together with the molar ratios. They are: A for adipic acid, D for dodecanedioic acid, M for maltitol, P for polymer, and S for suberic acid. In addition to this, it is 11 for a 1[thin space (1/6-em)]:[thin space (1/6-em)]1 ratio, 12 for a 1[thin space (1/6-em)]:[thin space (1/6-em)]2 ratio and a 14 for 1[thin space (1/6-em)]:[thin space (1/6-em)]4 ratio. For example, poly(maltitol)/adipic acid with a molar ratio of 1[thin space (1/6-em)]:[thin space (1/6-em)]1 is denoted as PMA 11 whereas poly(maltitol)/dodecanedioic acid with a molar ratio of 1[thin space (1/6-em)]:[thin space (1/6-em)]4 is referred as PMD 14.

2.4. Material characterization of polyesters

Nuclear magnetic resonance spectroscopy (NMR) and matrix assisted laser desorption/ionisation spectroscopy (MALDI) were performed on the prepolymers while all other characterizations were performed on the cured polymers. As the cured polymers are insoluble in solvents, NMR and MALDI could not be performed on the cured polymers. All the studies were performed on cured polymers unless stated otherwise.
2.4.1 FTIR spectroscopy. The attenuated total reflectance (U-ATR) mode of a PerkinElmer Frontier fourier transform-near infrared/mid-infrared spectrometer was used to confirm the chemical structure of all the polymers. Fourier transform infrared spectroscopy (FTIR) was performed on both prepolymers and cured polymers. All the spectra were acquired on an average of about 12 scans with a resolution of 4 cm−1 over the range of 600–4000 cm−1.
2.4.2 1H-NMR spectroscopy. Proton-NMR (1H-NMR) was performed with a Bruker Avance NMR Spectrometer (400 MHz) on the prepolymers of PMA 14, PMS 14, PMD 11, PMD 12 and PMD 14. The prepolymers were prepared by dissolving them in deuterated dimethylsulfoxide (DMSO-d6) calibrated against internal standards. The NMR spectra of PMA 14, PMS 14 and PMD 14 are displayed to show the effect of DCA whereas the spectra of PMD 11, PMD 12 and PMD 14 were chosen to show the results of varying the molar stoichiometric ratios.
2.4.3 Differential scanning calorimetry. Differential scanning calorimetry (DSC) was performed with a TA Instruments Q2000 to determine the thermal properties of the polymers. Polymer (3 to 5 mg) loaded in an aluminum pan were subjected to heating and cooling cycles of −50 °C to 200 °C and the temperature was ramped up by 10 °C min−1 under a N2 flow of 50 mL min−1. The samples underwent a second heating up to 200 °C to remove the thermal history which was a result of prior processing.
2.4.4 Determination of molecular weight. The molecular weight of the prepolymers was determined using MALDI spectroscopy with a Bruker Daltonics ultrafleXtreme. The samples were dissolved in a DMF/acetonitrile mixture.
2.4.5 Dynamic mechanical analysis. The mechanical properties of the cured polymers were characterized using dynamic mechanical analysis (DMA) on a TA Instruments Q 800. Films of dimensions (30 mm × 5 mm × 1 mm) were cut from the cured polymers at room temperature (25 °C). Some polymers were not characterized because of the inability to prepare the sample. An isothermal frequency sweep of 1 to 10 Hz, 15 μm amplitude and 0.01 preload were the operational conditions used. A film/fiber tension clamp was employed.
2.4.6 Surface water wettability. The water contact angle of the cured polymers was measured using a DataPhysics contact angle goniometer. A droplet of 1 μL of ultrapure water (Sartorius) was placed on the flat cured polymer surface and the readings were taken after equilibrium was attained. The data presented are the mean ± standard deviation of three independent readings.
2.4.7 Measurement of percentage swelling. The percentage swelling was calculated based on the swelling–deswelling measurement of the polymers. For determining the % swelling of the cured polymers, the samples (circular discs of 4.5 mm × 1 mm) (W1) were submerged in 100 mL of non-solvent (hexane) at 37 °C. After constant weight attainment after considerable swelling (W2), the samples were dried again until a constant weight was achieved (W3). W3 is the same as W1. The % swelling was calculated using the formula:
 
% swelling = (W2W3)/W3 × 100 (1)
2.4.8 In vitro hydrolytic polymer degradation. The cured polymer samples obtained by punching (4.5 mm × 1 mm) discs at room temperature (25 °C) were placed inside Nylon mesh. The meshes and their contents were submerged in 20 mL of phosphate buffer saline (PBS) of pH 7.4 maintained at the physiological body temperature of 37 °C with shaking at 100 rpm in an Shalom Instruments incubator shaker (India). This was followed by rinsing the samples in water and then drying them in a hot air oven until a stable weight was attained. The PBS was replaced every 24 h to avoid the effects caused by change in pH.

The differences in dry weight of the samples after soaking in PBS were used to determine their percentage mass loss. This was calculated using eqn (2):

 
% mass loss = (M0Mt)/M0 × 100 (2)

In eqn (2), M0 is the initial dry mass of the polymer disc and Mt is the dry weight after immersion in PBS at regular fixed time intervals.

2.4.9 Dye release kinetics. It is crucial to investigate the ability of the polymer for release applications. Therefore, the release of a hydrophobic dye (Rhodamine B base; RBB) and a hydrophilic dye (Rhodamine B; RB) was studied. The prepolymers and the dyes (5%) were dissolved in DMF. The discs were punched out of the polymer and this was followed by solvent evaporation and curing similar to that used in the degradation studies.

The discs were placed in 20 mL of buffer maintained at a neutral condition (pH = 7.4), a shaking speed of 100 rpm and a temperature of 37 °C. With a constant renewal of PBS once in 24 h, 100 μL of the medium was collected in a well plate at regular time points for both the dyes. A wavelength of 553 nm was set on a BioTek Synergy HT (USA) micro plate reader to obtain the absorbance values of the dyes. The concentration of the dyes was calculated using the calibration curves obtained. A cumulative release profile was finally acquired.

2.4.10 Cytocompatibility of the polymer. Because of its potential for use in bone tissue engineering applications, cytocompatibility properties were evaluated using a MC3T3-E1 Subclone 4 mouse pre-osteoblast cell line (ATCC, USA).12 Cells were cultured in T-25 tissue culture flasks (maintained at 5% carbon dioxide (CO2), 37 °C) using Minimum Essential Medium Alpha (α-MEM; Sigma, USA) containing fetal bovine serum (10% v/v, Gibco Life Technologies) and 1% antibiotics (Sigma). Cells were harvested using 0.25% trypsin with ethylenediaminetetraacetic acid (EDTA). The cells used for this study belonged to twentieth passage.

Culture medium (200 μL) and 2000 cells were seeded into each well of sterilized 96 well plate. A time of 12 h was sufficient for the cells to attach to the well surface before they were exposed to conditioned medium (medium containing the degradation products of the polymer). The polymer discs were exposed to ultraviolet light for about 1 h before being immersed in 5 mL of cell culture medium. The discs were placed individually in a centrifuge tube and they were maintained in a CO2 incubator at 37 °C for 24 h, similar conditions to those used for in vitro degradation and release experiments. Quadruplicates of each polymer type were used for the cell studies. Following this, the cells were exposed to 200 μL of conditioned media to assess the cytocompatibility of these polymers. Fresh cell culture media were added to the cells to act as controls for these studies. The viability and the morphology of the cells were studied after exposing the cells to the conditioned media for three days.

A water soluble tetrazolium salts (WST-1) assay was used to evaluate the cell viability following the treatment of cells with conditioned media. A single well was used for each of the quadruplicates of each polymer type for one day (n = 9 × 4 = 36). An additional four wells were used as controls for both the time points. The concentration of WST reagent (Roche) per well was 10 μL/100 μL media. After adding 100 μL of medium containing WST reagent to each well, the well plate was incubated for 1 h until the color of the media changed from pink to yellow. Using a microplate reader, the optical absorbance values were obtained at 440 nm. To determine the cell morphology, the cells exposed to conditioned media were fixed using 3.7% formaldehyde (Merck) for 15 min at 37 °C. Later, they were subjected to a PBS wash before imaging using an Olympus bright field microscope.

2.4.11 Evaluation of osteogenic differentiation. To demonstrate the potential of these materials for bone tissue engineering, MC3T3-E1 cells were cultured on the discs of PMD 12 and PMD 14. These polymers were selected based on optimal storage moduli and degradation. The cells were grown using complete α-MEM together with supplements capable of generating osteo induction including β-glycerolphosphate (10 mM) and ascorbic acid (25 μM) (Sigma) as reported earlier.19 The in vitro mineralization of calcium and phosphate was studied at day 7, day 14 and day 21. At the specified time points, the cells were initially fixed using 3.7% formaldehyde for 20 min at 37 °C. Quantification of calcium deposits was performed using Alizarin red staining (ARS; Sigma) for the quadruplicates. The filtered alizarin red dye was allowed to bind to the calcium for 25 min at 30 °C. Following this, the samples were washed with water until the solution became clear, to remove the dye that was unbound. Later, the dye was dissolved using 5% sodium dodecyl sulfate in 0.5 M HCl for 25 minutes before reading the absorbance values at 405 nm using a microplate reader. In addition to this, scanning electron microscopy (SEM) coupled with energy dispersive X-ray spectroscopy (EDS) was used to confirm the mineral deposition. A gold coating of 10 nm was obtained by sputtering for 100 s before imaging. The phosphate deposition was also verified using ATR-FTIR.
Statistical analysis. Statistical analysis was performed to evaluate the significant differences using a one way ANOVA with Tukey's test to compare results across all the samples. Additionally, Student's t-test was performed to compare individual samples and the control. The values were considered to be statistically significant if the p values were less than 0.05.

3. Results and discussion

3.1. Polymer synthesis

The prepolymers dissolved in numerous solvents such as ethanol, DMF and DMSO. However, the cured polymers did not dissolve in any solvent after the completion of the curing process. As mentioned in the experimental section, the prepolymers were used for MALDI and NMR spectra. FTIR, DSC, DMA, contact angle, % swelling studies, degradation, dye release and cell studies were performed for the cured polymers.

3.2. Polymer characterization

3.2.1 FTIR spectroscopy. The FTIR spectra of the cured polymers were consistent with many of its analogues reported earlier13,20 (Fig. 1). A characteristic ester carbonyl (–C[double bond, length as m-dash]O stretching) peak was observed in all polyesters around 1717 cm−1. The broad peaks (–OH stretching) at around 3360 cm−1 can also be seen in all polyesters. Similar to other polyesters, a number of other peaks such as asymmetric and symmetric –CH stretching around 2920 cm−1 and 2850 cm−1, –OH bending vibrations around 1410 cm−1 and 1260 cm−1 were found. Importantly, C–O stretching (ether) peaks present in maltitol around 1020 cm−1 were pronounced in all polyesters.13 Thus, FTIR spectroscopy confirmed the formation of esters.
image file: c6ra02058e-f1.tif
Fig. 1 FTIR spectra of (a) PGA 11, PGA 12 and PGA 13 (b) PGS 11, PGS 12 and PGS 13 (c) PGD 11, PGD 12 and PGD 13.
3.2.2 1H-NMR spectroscopy. The results of 1H-NMR spectroscopy substantiated data obtained using FTIR (Fig. 2a–e). The peaks obtained were similar to the peaks of many polyesters reported in the literature.21 The peaks that appeared around 3.4–5.5 ppm could be attributed to the entire proton groups present in maltitol.22 The peaks were observed for all polymers including PMA 14 (Fig. 2a) and PMS 14 (Fig. 2b) and with PMD 14 (Fig. 2e). The peaks of the DCAs were present between 1.3 and 3 ppm.22 The peaks between 2 and 3 ppm could be correlated with the protons present next to the –COOH groups on either side (HOOC–CH2). The peaks present at approximately 1.5 ppm could be ascribed to the protons of the –CH2 group present next to the one near the –COOH group on both sides (HOOC–CH2–CH2). Finally, the peaks appearing around 1.3 ppm belong to the protons of the –CH2 group present next to the one at 1.5 ppm (HOOC–CH2–CH2–CH2–CH2). It should be noted that the peak around 1.3 ppm is completely absent and the one around 1.5 ppm is less pronounced in the PMA 14 spectrum. The reason for this is because of the absence of those protons in adipic acid. Additionally, the peaks (1.3–3 ppm) corresponding to dodecanedioic acid are clearly observed in all polymers based on dodecanedioic acid12 such as PMD 11 (Fig. 2c), PMD 12 (Fig. 2d), PMD 14 (Fig. 2e).
image file: c6ra02058e-f2.tif
Fig. 2 1H-NMR spectra of (a) PMA 14 (b) PMS 14 (c) PMD 11 (d) PMD 12 (e) PMD 14.
3.2.3 Differential scanning calorimetry. DSC results indicated that these cured polyesters were completely amorphous (Table 1, see ESI, Fig. S1) with no melting peaks (Tm) or cold crystallization peaks (Tc). These polyesters revealed only glass transition temperatures (Tg). Tg was determined by integrating the DSC curve. Tg decreased consistently with an increase in the chain lengths of the DCAs and the molar ratios of maltitol[thin space (1/6-em)]:[thin space (1/6-em)]diacids. This could be attributed to the formation of rigid networks when the chain length of the diacid is shorter. Thus, the chain rotation is restricted and that increases the Tg. As the length of the diacid increases, the polymer becomes more flexible.17 Similar results were observed when xylitol was reacted with a series of DCAs with linearly increasing chain lengths.17 Thus, the Tg decreases when the chain length of the diacid is longer.
Table 1 Physical properties of the synthesized polyesters
Polyesters Tg (°C) Storage modulus at 10 Hz (MPa) Loss modulus at 10 Hz (MPa) tan[thin space (1/6-em)]δ at 10 Hz Young's modulus (MPa) Contact angle (°) % swelling
a Unable to perform the analysis because the samples were not uniform.
PMA 11 65 a a a 45 ± 1 2.7
PMA 12 57 a a a 82 ±[thin space (1/6-em)]1 1.9
PMA 14 35 a a a 86 ± 1 1.1
PMS 11 46 12 23 1.92 26 60 ± 2 2.4
PMS 12 32 7.1 8.3 1.18 11 87 ± 1 1.5
PMS 14 16 6.3 5.7 0.9 9 94 ± 2 0.6
PMD 11 33 368 122 0.33 388 71 ± 2 1.2
PMD 12 33 260 70 0.27 269 92 ± 1 0.8
PMD 14 13 174 40 0.23 179 96 ± 1 0.2


In the case of different molar ratios, more –COOH groups are available for esterification with the –OH groups. As a result, polymers become increasingly hydrophobic in nature23 resulting in a lower Tg.24 As a result, the Tg decreases when the molar ratios of maltitol[thin space (1/6-em)]:[thin space (1/6-em)]DCAs were higher. The Tg of PMA 11, PMS 11 and PMD 11 were almost two to three times greater than the corresponding higher ratios of: PMA14, PMS 14 and PMD 14. This trend was similar to those found in some of the studies previously published.25–27

In the case of PMA 11, PMA 12 and PMS 11, all had a Tg higher than the physiological temperature of 37 °C but comparable to that obtained (45 °C) while reacting maltitol and sebacic acid.13

3.2.4 Matrix associated laser desorption/ionization. The molecular weight of the prepolymers increased with an increase in chain lengths of the DCAs and molar ratios.12,28 MALDI spectroscopy showed that the molecular weight of the prepolymers were almost similar (2000 Da for PMA 14, 2200 Da for PMS 14, 2400 Da for PMD11 and 2600 Da for PMD 14).
3.2.5 Dynamic mechanical analysis. DMA results indicated that the values of storage and loss modulus increased with an increase in chain length of the DCAs (Table 1). A similar trend was observed when butyl alcohol was reacted with succinic acid and also with adipic acid.29 The storage modulus varied from 12 to 368 MPa for various polymers whereas the loss modulus varied from 5.7 to 122 MPa. The modulus values were higher for PMD polymers than PMS polymers. Thus, PMD has a storage modulus which is nearly 30 times higher than that of PMS. Similarly, PMD polymers have a loss modulus which is five times higher than that of PMS polymers. The Young's modulus obtained for these polymers are comparable to value of 378 MPa that was obtained by reacting maltitol with sebacic acid.13

Loss moduli will be lower than storage moduli if the polymers are elastomeric in nature.17 Thus, tan[thin space (1/6-em)]δ values are closer to zero for elastomeric polymers. This indicates that the polymers become more flexible with an increase in the molar ratios. Hydrophobicity imparts a flexible nature in the polymers30 and this could be the reason for tan[thin space (1/6-em)]δ decreasing with molar ratios of diacids. This is in agreement with the Tg values of these polymers where they decreased with an increase in molar ratios of the diacids.29

The Young's modulus can be considered approximately as a complex modulus, which can be obtained using the formula:

 
image file: c6ra02058e-t1.tif(3)
where E* is the complex modulus, E2 is the storage modulus and E′′2 is the loss modulus.31–33 The Young's moduli are 18 GPa for bone, 1.2–1.8 GPa for ligament, and 1.1 GPa for tendon.34,35 It is worth mentioning that these polyesters have moduli higher than many of its counterparts such as PLGA, PCL and poly(glycerol sebacate)14 that possess moduli of 1.4–2.8 MPa, 0.21–0.34 MPa and 0.28 MPa, respectively. Therefore, it can be concluded that these polymers are suitable for hard tissue engineering applications.

3.2.6 Contact angle measurement. The contact angles of these cured polyesters showed variations across the different chain lengths of DCAs. Considering different DCAs, PMA 11 had the smallest contact angle of 45° making it the most hydrophilic polymer among all the polyesters synthesized. The contact angles of PMS 11 and PMD 11 were 60° and 71° signifying that the polymers had become more hydrophobic. In the case of polymers synthesized with different molar ratios, for example PMS polymers, PMS 11 exhibited a contact angle of 60° whereas the angles were 87° and 94° for PMS 12 and PMS 14, respectively. This is similar to the contact angle of 88° obtained by reacting xylitol with suberic acid.17 There was an increase in the values of contact angles with an increase in chain lengths and the molar ratios of DCAs. This indicated that the hydrophobicity increases with increase in chain lengths and the molar ratios of DCAs.36 The reason for this could be attributed to the increase in methylene groups of the DCAs.36 In addition to this, the free –OH groups of maltitol are reduced with post-polymerization resulting in hydrophobicity.37 As the molar ratios of the acids increase, more –OH groups of maltitol participate in ester formation during curing. Therefore, the polymers become increasingly hydrophobic38 with the increase in the dicarboxylic chain length and the ratio of maltitol to diacid.
3.2.7 Determination of % swelling. The polymer will swell less if they are more hydrophobic in nature.39 Considering different DCAs, the % swelling decreased from 2.7 to 2.4 and 1.2 for PMA 11, PMS 11 and PMD 11, respectively. Similarly, with different molar ratios, it can be observed that the % swelling decreased from 1.2 to 0.8 and 0.2 for PMD 11, PMD 12 and PMD 14, respectively. The overall results can again be attributed to hydrophobicity. As explained earlier, the increase in methylene groups with an increase in chain lengths and the molar ratios of maltitol[thin space (1/6-em)]:[thin space (1/6-em)]DCAs were the contributing factor for hydrophobicity. The second reason is the decrease in –OH groups as the molar ratio increases thus enhancing the hydrophobic nature of the polymers. Thus, the values of % swelling showed a steady decrease with the increase in chain length and the molar ratios of DCAs (Table 1). With an increased hydrophobic nature of the polymers, the polymers will absorb less water resulting in less swelling.40 These results also agreed with those for the in vitro hydrolytic degradation and the dye release data, discussed next.

3.3. In vitro hydrolytic polymer degradation

The in vitro hydrolytic degradation of the cured polymers decreased with an increase in chain length and the molar ratios of DCAs (Fig. 3). Considering the effect of chain length of DCAs, PMA 14 degraded 79% in 72 h whereas only 39% and 30% degradation was observed for PMS 14 and PMD 14 in 72 h, respectively. Considering different molar stoichiometric ratios, for suberic acid based polymers, PMS 11 degraded completely in 72 h whereas only 82% and 39% degradation was found for PMS 12 and PMS 14 in 72 h, respectively. This trend was similar for all DCAs and molar stoichiometric ratios of all DCAs. PMD 14 degraded approximately 40% in one week which was a similar result to that of the polyester obtained by reacting xylitol with suberic acid.17 Considering the three DCAs individually, the trend was always PMA > PMS > PMD. For the different molar ratios, the results were as follows: 11 > 12 > 14. Thus, PMA11 > PMA12 > PMA 14. The same trend was observed for PMS and PMD polymers.
image file: c6ra02058e-f3.tif
Fig. 3 In vitro hydrolytic degradation profiles of the different polyesters in 20 mL PBS solution (pH = 7.4). The inset shows the variation of –ln(Mt/M0) with time. (a) PMA (b) PMS (c) PMD.

The above trend could be attributed to the increasing hydrophobicity with increase in chain lengths and molar ratios of DCAs. Shorter chains are comparatively more hydrophilic than longer aliphatic chains because of the lesser number of methylene groups. Therefore, shorter chains such as adipic acid will allow more influx of water into the polymer. This will contribute to the faster scission of ester bonds present in these polyesters resulting in enhanced hydrophilicity and degradation of the polymers. It is also widely reported that the solubility of shorter chain length DCAs such as adipic or succinic acid is higher in water compared to the solubilities of acids such as sebacic and suberic acids.41 Therefore, a longer chain length DCA such as dodecanedioic acid takes a longer time to dissolve and they form a barrier surrounding the polymer. As a result, the water entry inside the polymer is hindered and thus the degradation of those polymers was slower.42 This condition is also observed when there are fewer –OH groups with the increase in molar ratios.

The rate of the degradation of these polyesters were modeled by a power law equation which is:

 
image file: c6ra02058e-t2.tif(4)
where M represents the mass of the polymer, t denotes time, kd signifies the degradation rate coefficient and n corresponds to the order of the degradation.43 In this study, first order degradation was observed for all the polyesters. This signifies that the rate of the degradation depends on the concentration of ester bonds present in the polymers.43 Because water is present in excess, the rate of the degradation is independent of the volume of water.43 The variation of −ln(Mt/M0) versus time is linear when n = 1 for eqn (4). The plots are shown as the insets of Fig. 3. The values of the degradation rate coefficients of all the polymers in Table 2 were calculated by measuring the initial slopes of the lines. In all the cases, the intercepts were zero.

Table 2 The degradation, n and ln[thin space (1/6-em)]k values of dye release of polymers
Polyesters Degradation rate coefficient (kd) (h−1) RB release k, hn (×10−3) RBB release k, hn (×10−3)
PMA 11 0.123 26.3 26.2
PMA 12 0.046 9.9 6.9
PMA 14 0.028 4.5 3.1
PMS 11 0.091 13.6 9.5
PMS 12 0.025 6.2 3.6
PMS 14 0.007 2.5 1.5
PMD 11 0.022 4.9 2.8
PMD 12 0.019 4.4 2.4
PMD 14 0.004 1.7 0.6


From the values of kd (Table 1), it is evident that PMA 11 degraded more than two times faster and four times faster than PMA 12 and PMA 14, respectively. This was also analogous to the degradation of PMS polymers. Similarly, the degradation of PMD 11 was roughly five times faster than PMD 14. The values of kd demonstrated a decrease with increase in chain lengths and the molar ratios of DCAs. These results are consistent with degradation rate and other data presented in Table 1.

3.4. Dye release studies

In order to illustrate the release capability of the polymers, RB and RBB were selected. The release data were consistent with other data of degradation, contact angle and swelling studies (Fig. 4 and 5). For different DCAs with different chain lengths, considering the ratio of 1[thin space (1/6-em)]:[thin space (1/6-em)]1, complete release of RB was observed for PMA 11 and PMS 11 in 96 h, whereas 47% release was observed for PMD 11 in 96 h. For RBB, 95% and 89% release was observed in 96 h for PMA 11 and PMS 11, respectively, whereas only 27% release was observed for PMD 11 in 96 h. The trend was also similar for other molar stoichiometric ratios of 1[thin space (1/6-em)]:[thin space (1/6-em)]2 and 1[thin space (1/6-em)]:[thin space (1/6-em)]4. The overall trend is PMA > PMS > PMD which is the same as that observed for degradation. Considering the change with different stoichiometric ratios, in 96 h, almost 100% release of RB was observed for PMA 11 and PMA 12 whereas only 40% release was found for PMA 14. A similar trend was observed for PMS and PMD polymers with respect to both RB and RBB release.
image file: c6ra02058e-f4.tif
Fig. 4 In vitro release of hydrophilic RB dye from (a) PMA (b) PMS (c) PMD. The inset of all the plots show the variation of (Mt/M) with t and the release exponent, n = 1 in all polyesters.

image file: c6ra02058e-f5.tif
Fig. 5 In vitro release of hydrophobic RBB dye from (a) PMA (b) PMS (c) PMD. The inset of all the plots show the variation of (Mt/M) with time and the release exponent was n = 1 in all polyesters.

The previous results can be associated with the overall hydrophobicity and the degradation of the polymer. As discussed in the previous section about degradation studies, with an increase in chain length and the molar stoichiometric ratios of DCAs, the hydrophobicity of the polymer increases. As a result, the degradation decreased also leading to a decrease in the release of dyes.

The release was always faster for RB compared to RBB because of the hydrophilic nature of RB. Because RB is hydrophilic, the interaction between the dye and the polymer will be lower because the polymers are hydrophobic. In addition, the surrounding media is hydrophilic, and thus, RB will be released faster because of its affinity towards water. Because of the previously mentioned reasons, the release of RBB was slower in all cases.

The release of the dyes (RB and RBB) was slower compared to the degradation of the polymer. For example, although PMA 11 degraded completely in 72 h, only 35% of RB and 25% of RBB were released from PMA 11 in 72 h. A 100% release of dyes was only achieved in 96 h and 120 h for RB and RBB, respectively. To understand the slower release of drugs, the FTIR spectra of the dye loaded polymer before and after curing were taken. The –COOH group present in the dye interacted with the –OH group of the polymer resulting in a reaction between the dye and the polymer during curing. Therefore, the dye was not released at the same rate as the polymer degradation occurred.

The release of RB and RBB loaded in the polymer was modeled using the conventional Korsmeyer–Peppas relationship that is used to model the release profile of drugs from the polymeric systems.44 The equation is:

 
image file: c6ra02058e-t3.tif(5)
where Mt and M represent the concentration of the drugs released at the specific time and the total amount of drug loaded, t denotes time, k is the release rate coefficient and n represents the exponent of the release revealing information about the possible mechanism of the release of the drugs. When n = 1, the plot of ln[thin space (1/6-em)]Mt/M versus ln[thin space (1/6-em)]t is nearly linear and indicated a zero order release of the dyes from the polymers which is a preferred controlled release mechanism.12 The values of n did not change irrespective of the nature of the dyes and the polymer.

The values of k were calculated from the initial slopes of the release profiles which are shown in Table 2 and vary from 0.6 × 10⁻³ to 0.0263 h−1. It was inferred from the k values, and from the previous degradation and dye delivery studies, that a library of polymers lead to a widely tailored release befitting a spectrum of applications. For example, PMD 14 which released only 5% of the dye can be used where a sustained release is essential. With PMA 11 where 100% release was observed in 120 h, this polyester can be used for fast delivery. It can be finally concluded that this array of polymers can effectively be used for drug delivery applications as well as for scaffolds for tissue regeneration satisfying the requirements of a fourth generation material which is a synergistic bioresorbable as well as a bioactive material. Furthermore, bioactive molecules and drugs may be incorporated within the scaffolds to stimulate the cells for enhanced tissue regeneration.

3.5. Cytocompatibility studies

MC3T3-E1 cells are widely utilized for cytocompatibility tests in bone tissue engineering applications.45 The polymer discs were washed prior to the beginning of the experiments to ensure the removal of leaching acidic degradation products in the initial time period. In the WST assay, oxidoreductase enzymes present in the live cells convert WST reagent to yellow formazan which is water soluble. The optical density values obtained are directly correlated to the number of live cells using a predetermined calibration curve. The WST assay (Fig. 6) showed that all polymers were non-toxic in nature. Tissue culture polystyrene (TCPS) was used as the control. Although the number of cells adhered on the polymers were different from the control on day 1, there was significant growth and the number of cells increased from day 1 to day 3 on all polymers.
image file: c6ra02058e-f6.tif
Fig. 6 Cell viability of various polyesters determined by the WST assay on days 1, 2 and 3. * indicates values significantly different (p = 0.05) from the control.

A number of reports in the literature have emerged suggesting that cell morphology plays a pivotal role in governing the cell function.46 This makes the study of cell morphology vital. Bright field images (Fig. 7a and b) showed that the degradation products did not affect the cell growth and morphology. Upon exposure to conditioned media, the cells displayed their characteristic “spindle shaped” morphology and were not different from that of the control. This proved that the cells were able to adhere and proliferate after exposure to conditioned media. The cells appeared to have spread and elongated indicating that they were healthy. Therefore, it is suitable to conclude that these polymers are candidate materials for biomedical applications in vivo.


image file: c6ra02058e-f7.tif
Fig. 7 Optical micrographs of MC3T3-E1 cells on the surface of the TCPS (a) treated with fresh media (b) treated with media containing the degradation products of PMA 12 at 10× magnification. Scale bar indicates 20 μm.

3.6. Osteogenic differentiation studies

Mineralization studies were used to assess the ability of the polymers to support osteogenic differentiation leading to calcium phosphate deposition. Mineralization studies were performed with the cells seeded on to the polymer surface. The morphology and adhesion of the cells were also studied during mineralization studies. The mineral content of the cells that had adhered and proliferated on the polymers to undergo differentiation was assessed at day 7, day 14 and day 21 after seeding. Quantification of mineralization using ARS staining showed that cells cultured on PMD 12 deposited more calcium than those on PMD 14. This could be attributed to the higher storage modulus values of PMD 12. As explained previously, cells sense the modulus of matrices using the cytoskeleton and alter their morphology while undergoing osteogenic differentiation.4 The mineralization content on PMD 14 was initially lesser but increased on day 21 when compared to PMD 12. However, the differences between the two polymers at all specified time points were not statistically significant. The mineralization increased from day 7 to day 21 on both the polymers suggesting that the cells are differentiating towards osteogenic lineage (Fig. 8).
image file: c6ra02058e-f8.tif
Fig. 8 Quantification of mineral deposition on PMD 12 and PMD 14 surfaces on day 7, day 14 and day 21 together with the TCPS control.

SEM imaging showed that the morphology of the cells cultured on the polymer were round in shape (Fig. 9a and c). MC3T3-E1 cells possess round morphology when they are cultured on hydrophobic surfaces.47 Higher numbers of cells were seen on PMD 12 when compared to PMD 14 on day 21. It is to be noted that cell proliferation and cell viability were not affected as is evident from the results of the WST assay. EDS analysis confirmed the mineral deposits on these polymers were composed of calcium and phosphate (Fig. 9b and d). On day 21, PMD 12 showed higher calcium deposits of up to 50% when compared to PMD 14. However, both calcium and phosphate depositions were found only on PMD 14. FTIR analysis of PMD 14 cultured for 21 days supported the EDS data (Fig. 10). The phosphate peaks that correspond to P–O bond stretching were visible in the regions of 1287 cm−1 and 1057 cm−1. Thus it can be concluded that both these polymers are suitable for bone tissue engineering.


image file: c6ra02058e-f9.tif
Fig. 9 SEM micrographs coupled with EDS spectra of mineral deposited polymer discs (a) SEM micrograph of PMD 12 (b) EDS spectra of PMD 12 (c) SEM spectra of PMD 14 (d) EDS spectra of PMD 14 (magnification = 1.24k×, scale bar = 20 μm).

image file: c6ra02058e-f10.tif
Fig. 10 FTIR spectra of the mineralized PMD 14.

4. Summary and conclusions

Several polymers were synthesized by tuning the chain lengths and the molar ratios of the monomers, which exhibited properties befitting various biomedical applications. All polymers showed first order kinetics in polymer degradation and followed zero order kinetics in dye release. Nevertheless, the profiles of both the degradation and release were widely different for the systems. For example, PMA 11 and PMS 11 exhibited a very fast hydrolytic degradation where the polymer degrades completely in 72 h. PMS 14 and PMD 14 degraded slowly showing approximately 70% and 40% weight loss, respectively, in a week but possessed a varying range of mechanical properties. On the other hand, PMD 11 exhibited a high modulus of 360 MPa but degraded faster exhibiting more than 90% weight loss in a week. Thus, the degradation and dye release can be tuned by varying the monomers and their stoichiometric ratios. The mechanical studies indicate that these polymers may find applications in bone tissue engineering as they conform to the modulus of skeletal components. This family of polymers can also be used for fabricating tissue scaffolds by salt leaching or electrospinning techniques.48,49 Furthermore, mineralization studies were performed for 21 days and showed that these polymers are capable of driving cells towards osteogenic lineage and are eligible to be used as scaffolds for bone tissue engineering. Thus, it can be concluded that this combinatorial technique of varying diacids and their molar ratios can be used for synthesizing many different polymers yielding properties suitable for various applications.

Acknowledgements

This work was funded by the Department of Biotechnology (DBT), India (BT/PR5977/MED/32/242/2012). KC acknowledges a Ramanujan Fellowship from the Department of Science and Technology (DST), India. We thank Ms Queeny Dasgupta for her help with the DSC thermograms and DMA analysis. We also thank Ms Ananya Pal of Kalinga Institute of Industrial Technology, Bhubaneshwar, India for technical assistance. JN is grateful to Mr Sai Rama Krishna Meka and Mr Shubham Jain for technical assistance with the cell studies. We would also like to thank the NMR Research Centre of IISc for access to research facilities. GM is deeply grateful for the J. C. Bose Fellowship from DST, India.

References

  1. B. Gullberg, O. Johnell and J. Kanis, Osteoporosis Int., 1997, 7, 407–413 CrossRef CAS.
  2. L. Meinel, V. Karageorgiou, R. Fajardo, B. Snyder, V. Shinde-Patil, L. Zichner, D. Kaplan, R. Langer and G. Vunjak-Novakovic, Ann. Biomed. Eng., 2004, 32, 112–122 CrossRef PubMed.
  3. L. Meinel, V. Karageorgiou, S. Hofmann, R. Fajardo, B. Snyder, C. Li, L. Zichner, R. Langer, G. Vunjak-Novakovic and D. L. Kaplan, J. Biomed. Mater. Res., Part A, 2004, 71, 25–34 CrossRef PubMed.
  4. A. J. Engler, S. Sen, H. L. Sweeney and D. E. Discher, Cell, 2006, 126, 677–689 CrossRef CAS PubMed.
  5. J. R. Porter, T. T. Ruckh and K. C. Popat, Biotechnol. Prog., 2009, 25, 1539–1560 CAS.
  6. S. Kumar and K. Chatterjee, Nanoscale, 2015, 7, 2023–2033 RSC.
  7. F. Causa, P. A. Netti and L. Ambrosio, Biomaterials, 2007, 28, 5093–5099 CrossRef CAS PubMed.
  8. R. Adhikari and P. A. Gunatillake, Eur. Cells Mater., 2003, 5, 1–16 Search PubMed.
  9. K. S. Soppimath, T. M. Aminabhavi, A. R. Kulkarni and W. E. Rudzinski, J. Controlled Release, 2001, 70, 1–20 CrossRef CAS PubMed.
  10. C. Vilela, A. F. Sousa, A. C. Fonseca, A. C. Serra, J. F. Coelho, C. S. Freire and A. J. Silvestre, Polym. Chem., 2014, 5, 3119–3141 RSC.
  11. L. S. Nair and C. T. Laurencin, Prog. Polym. Sci., 2007, 32, 762–798 CrossRef CAS.
  12. J. Natarajan, S. Rattan, U. Singh, G. Madras and K. Chatterjee, Ind. Eng. Chem. Res., 2014, 53, 7891–7901 CrossRef CAS.
  13. J. P. Bruggeman, B.-J. de Bruin, C. J. Bettinger and R. Langer, Biomaterials, 2008, 29, 4726–4735 CrossRef CAS PubMed.
  14. D. G. Barrett and M. N. Yousaf, Molecules, 2009, 14, 4022–4050 CrossRef CAS PubMed.
  15. U. Edlund and A.-C. Albertsson, Adv. Drug Delivery Rev., 2003, 55, 585–609 CrossRef CAS PubMed.
  16. A. Gandini, Green Chem., 2011, 13, 1061–1083 RSC.
  17. Q. Dasgupta, K. Chatterjee and G. Madras, Biomacromolecules, 2014, 15, 4302–4313 CrossRef CAS PubMed.
  18. F. Migneco, Y.-C. Huang, R. K. Birla and S. J. Hollister, Biomaterials, 2009, 30, 6479–6484 CrossRef CAS PubMed.
  19. S. Kumar, S. Bose and K. Chatterjee, RSC Adv., 2014, 4, 19086–19098 RSC.
  20. J. Coates, Interpretation of FTIR spectra: A practical approach, in Encyclopedia of Analytical Chemistry, ed. R. A. Meyers, John Wiley & Sons, Chichester, 2000, pp. 10815–10837 Search PubMed.
  21. S. Pasupuleti and G. Madras, J. Appl. Polym. Sci., 2011, 121, 2861–2869 CrossRef CAS.
  22. N. E. Jacobsen, NMR spectroscopy explained: simplified theory, applications and examples for organic chemistry and structural biology, John Wiley & Sons, Hoboken, New Jersey, 2007 Search PubMed.
  23. R. Rai, M. Tallawi, A. Grigore and A. R. Boccaccini, Prog. Polym. Sci., 2012, 37, 1051–1078 CrossRef CAS.
  24. O. Prucker, S. Christian, H. Bock, J. Rühe, C. W. Frank and W. Knoll, Macromol. Chem. Phys., 1998, 199, 1435–1444 CrossRef CAS.
  25. S. Hirose, T. Hatakeyama and H. Hatakeyama, Thermochim. Acta, 2005, 431, 76–80 CrossRef CAS.
  26. H. Khonakdar, J. Morshedian, U. Wagenknecht and S. Jafari, Polymer, 2003, 44, 4301–4309 CrossRef CAS.
  27. H.-J. Chung, K.-S. Woo and S.-T. Lim, Carbohydr. Polym., 2004, 55, 9–15 CrossRef CAS.
  28. M. S. Nikolic and J. Djonlagic, Polym. Degrad. Stab., 2001, 74, 263–270 CrossRef CAS.
  29. V. Tserki, P. Matzinos, E. Pavlidou, D. Vachliotis and C. Panayiotou, Polym. Degrad. Stab., 2006, 91, 367–376 CrossRef CAS.
  30. B. Vázquez, J. San Roman, C. Peniche and M. E. Cohen, Macromolecules, 1997, 30, 8440–8446 CrossRef.
  31. D. Montalvão, R. Cláudio, A. Ribeiro and J. Duarte-Silva, Compos. Struct., 2013, 97, 91–98 CrossRef.
  32. G. R. Fulcher, D. W. Hukins and D. E. Shepherd, BMC Musculoskeletal Disord., 2009, 10, 61 CrossRef PubMed.
  33. C. R. Jacobs, H. Huang and R. Y. Kwon, Introduction to cell mechanics and mechanobiology, Garland Science, New York, 2012 Search PubMed.
  34. S. Pal, Design of Artificial Human Joints & Organs, Springer, New York, 2014, pp. 23–40 Search PubMed.
  35. C. N. Maganaris and J. P. Paul, J. Biomech., 2002, 35, 1639–1646 CrossRef PubMed.
  36. S. Brocchini, K. James, V. Tangpasuthadol and J. Kohn, J. Am. Chem. Soc., 1997, 119, 4553–4554 CrossRef CAS.
  37. S. H. Oh, S. G. Kang, E. S. Kim, S. H. Cho and J. H. Lee, Biomaterials, 2003, 24, 4011–4021 CrossRef CAS PubMed.
  38. D. L. Schmidt, R. F. Brady, K. Lam, D. C. Schmidt and M. K. Chaudhury, Langmuir, 2004, 20, 2830–2836 CrossRef CAS PubMed.
  39. D. Dakshinamoorthy, A. K. Weinstock, K. Damodaran, D. F. Iwig and R. T. Mathers, ChemSusChem, 2014, 7, 2923–2929 CrossRef CAS PubMed.
  40. J. Kim, K.-W. Lee, T. E. Hefferan, B. L. Currier, M. J. Yaszemski and L. Lu, Biomacromolecules, 2007, 9, 149–157 CrossRef PubMed.
  41. R. Collander, Acta Chem. Scand., 1951, 5, 774–780 CrossRef CAS.
  42. P. S. Sathiskumar and G. Madras, Polym. Degrad. Stab., 2011, 96, 1695–1704 CrossRef CAS.
  43. Y. Márquez, L. Franco, P. Turon, A. Rodríguez-Galán and J. Puiggalí, Polym. Degrad. Stab., 2013, 98, 2709–2721 CrossRef.
  44. P. Costa and J. M. Sousa Lobo, Eur. J. Pharm. Sci., 2001, 13, 123–133 CrossRef CAS PubMed.
  45. S. Bahl, S. Suwas and K. Chatterjee, RSC Adv., 2014, 4, 38078–38087 RSC.
  46. J. V. Shah, J. Cell Biol., 2010, 191, 233–236 CrossRef CAS PubMed.
  47. J. Wei, T. Igarashi, N. Okumori, T. Maetani, B. Liu and M. Yoshinari, Biomed. Mater., 2009, 4, 1748–6041 Search PubMed.
  48. F. Yi and D. A. LaVan, Macromol. Biosci., 2008, 8, 803–806 CrossRef CAS PubMed.
  49. K. Sarkar, S. R. K. Meka, A. Bagchi, N. Krishna, S. Ramachandra, G. Madras and K. Chatterjee, RSC Adv., 2014, 4, 58805–58815 RSC.

Footnote

Electronic supplementary information (ESI) available. See DOI: 10.1039/c6ra02058e

This journal is © The Royal Society of Chemistry 2016
Click here to see how this site uses Cookies. View our privacy policy here.