Chemical–mechanical properties of tribofilms and their relationship to ionic liquid chemistry
Vibhu Sharmaa,
Nicole Doerrb and
Pranesh B. Aswath*a
aMaterials Science and Engineering Department, The University of Texas at Arlington, Arlington, TX, USA. E-mail: Aswath@uta.edu; Tel: +1-817-272-0308
bAC2T Research GmbH, Austria
First published on 12th February 2016
Abstract
The relationship between ionic liquid (IL) chemistry and tribological properties, such as coefficient of friction, wear and chemical–mechanical properties, of tribofilms is examined. In this study, six phosphorous (P) based ILs (in which P is present either in the anion or cation or in both) were chosen to examine the role of different cations and anions. The six ILs used as additives were blended in group I base oil at 0.1 wt% P treatment rate and their tribological performance was evaluated using cylinders in a reciprocating flat test configuration in pure sliding contact. Tests using ZDDP at 0.1 wt% P and base oil were also conducted for baseline comparison. All ILs exhibited comparable or lower coefficients of friction compared to ZDDP, which has a higher but consistent coefficient of friction for the duration of the test. IL N_DEHP and P_TFSI exhibited comparable or slightly better wear protection compared to ZDDP, whereas N_DBDTP, P_TMPP, P_DMP and P_DEDTP exhibited worse wear results than ZDDP. XANES analysis of pure IL standards and their tribofilms indicates that the tribofilms from ILs are the result of decomposition of the IL and reaction of these decomposition products with the underlying steel substrate. No residues of the original IL were found on the wear tracks. Nano-indentation results indicated that tribofilm hardness increases from the surface towards the bulk of the films, which when combined with P L-edge spectra indicate that short chain phosphates formed at the surface result in lower hardness than medium chain phosphates formed in the bulk.
1. Introduction
The on-going trend in the automotive industry is to improve efficiency and fuel economy, increase longevity and reliability and at the same time reduce harmful emissions to the environment. The efficiency of automotive systems can be improved significantly by reducing frictional losses as well as minimizing wear. In a recent study, Holmberg et al.1,2 concluded that the latest technological advances in the field of tribology could lead to up to 14% reduction in frictional losses in heavy duty vehicles and up to 18% friction reduction in passenger vehicles in the short term (i.e. within 5–10 years). At the same time, CO2 emission could also be reduced by 200 million tonnes for heavy duty vehicles and 290 million tonnes for passenger vehicles. Potential technological advances in tribology include novel lubricant additives such as ionic liquids (ILs),3–8 ashless fluorothiophosphates,9–12 low friction coatings,13 surface texturing14 and low viscosity and low shear lubricant oils.15Of all the approaches used, additive development offers the potential for providing in situ low friction film formation at a low cost and our study focuses on oil soluble ionic liquids (ILs) that include phosphorous as one of their constituents. ILs are well known compounds and have been used in many engineering applications.16–20 The use of ILs in tribology is a relatively new development, with the application of ILs as lubricants/lubricant additives first recognized in 2001.21 The advantages of ionic liquids include their negligible vapor pressure, high thermal stability, non-flammability, non-volatility and electrochemical properties that are highly desirable for tribological applications. However, their limitations include low solubility in oils due to their highly polar structure, which can be mitigated to some extent by engineering their structure.22
Most ILs used in engineering applications are synthetic salts and, depending on the choice of cation and anion, are available in a variety of structures. In tribology, only a few specific structures can be used as lubricants and lubricant additives. Early studies on ILs as lubricants/lubricant additives focused on imidazolium based cations with tetrafluoroborate and hexafluorophosphate anions.23–27 Jiménez et al.23 studied 1-N-alkyl-3-methylimidazolium based ILs with tetrafluoroborate and hexafluorophosphate anions as neat lubricant and lubricant additives and reported a significant improvement in lubrication properties (friction and wear reduction) when the ILs were added into base oil as an additive (1 wt%) in comparison to when they were used as neat lubricants at room temperature as well as at 100 °C. In another study by Jimenez et al.,28 lubrication properties of imidazolium based ILs were studied at low as well as at elevated temperatures. They reported that tetrafluoroborate 1-hexyl/octyl-3-methylimidazolium ILs show higher thermal stability and better lubricating performance than mineral and synthetic oils under extreme temperature conditions, both at low (−30 °C) and high (100 °C, 200 °C) temperatures. Tribocorrosion due to ILs was also observed in the case of the more polar and shorter alkyl chain tetrafluoroborate 1-hexyl-3-methylimidazolium IL at elevated temperatures. Pisarova et al.29 studied the thermal stability and corrosion properties of ammonium based ILs with bis(trifluoromethylsulfonyl) imide (NTF2) and methanesulfonate anions. They reported that the corrosiveness of ILs depends on the choice of cation and anion, choline NTF2 IL showed significantly lower corrosiveness and higher thermal stability than choline methanesulfonate IL. Pisarova et al.30 also studied the degradation mechanism of ammonium ILs and their tribological properties using mass spectrometry. An intermolecular transmethylation was identified in the ammonium ILs under long term thermo-oxidative stress. They also suggested that altered IL products due to thermal degradation can negatively influence their tribological performances. Imidazolium and ammonium based ILs with halogenated anions (PF6−, BF4− and bis trifluorosulfonyl imide TFSI−) showed potential improvement in friction and wear performance when used as neat lubricant or as lubricant additive in base oil. However, corrosiveness and solubility in non-polar base oil are still limitations for their tribological application. Totolin et al.31 studied and compared the tribological properties of halogenated and halogen free alkylborane–imidazole and phosphonium phosphate ionic liquids. They reported that phosphate tribofilms from phosphonium-phosphate IL exhibit better tribological properties than fluoride based tribofilms from halogenated IL. Recently, Qu et al.4,32,33 studied oil miscible phosphonium-phosphate ionic liquids (PP-ILs) as lubricant additives in base oil as well as in fully formulated oil. They reported comparable or even superior antiwear and anti-scuffing properties of phosphonium IL in comparison with the conventional additive, i.e. ZDDP, in PAO base oils at 0.1% phosphorous.
In this study, six different ionic liquids were assessed in blends of group I mineral base oil on a cylinder on a reciprocating flat tribometer. All oil formulations containing IL were prepared at the fixed level of 1000 ppm phosphorous (P). Morphology and surface topography of worn surfaces were studied using high resolution microscopy: scanning electron microscopy (SEM) and scanning probe microscopy (SPM). The chemical nature of the tribofilms was explored using the advanced surface characterization technique of X-ray absorption near edge structure spectroscopy (XANES). ZDDP in base oil at 0.1 wt% P and base oil only tests were also run for baseline comparison. Ionic liquids show comparable or improved wear protection on the rubbed surfaces to ZDDP at equal phosphorous level.
2. Experimental section
2.1. Description of additive chemistry
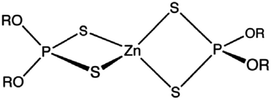
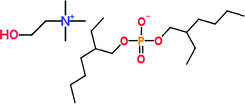
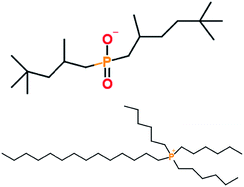
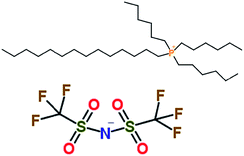
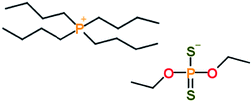
Group I base oil (a mixture of 60 wt% solvent neutral 150 W and 40 wt% bright stock 90 W) and zinc dialkyl dithiophosphate (ZDDP) were purchased from commercial vendors. The ZDDP used in this study is a secondary alcohol derived ZDDP with approximately 70% neutral and 30% basic characteristics. The six different ionic liquids studied were provided by AC2T Research GmbH in Austria. Table 1 details the chemical structures of the ZDDP and six ionic liquid antiwear additives used. The six ILs were chosen carefully to provide not only chemical diversity but also an opportunity to examine the role of different cations and anions. Choline bis(2-ethylhexyl)-phosphate (N_DEHP) and choline dibutyl-dithiophosphate (N_DBDTP) have the same cation, while one anion has a phosphate structure and the other one has a thiophosphate structure. Tetradecyl-trihexyl-phosphonium bis(2,4,4-trimethylpentyl)-phosphinate (P_TMPP) and tetradecyl-trihexyl-phosphonium bis(trifluoromethylsulfonyl)-imide (P_TFSI) have the same cation, while one anion is a phosphinate, the other one is a fluoro-sulfonyl amide. Lastly methyl-tributyl-phosphonium dimethyl-phosphate (P_DMP) and tetra-n-butyl-phosphonium O,O-diethyl-dithiophosphate (P_DEDTP) have similar (but not the same) cations, while the anions possess either a phosphate or thiophosphate moiety.2.2. Thermogravimetric analysis of additives
Thermogravimetric analysis (TGA) of the ionic liquids was performed using a Shimadzu TGA-51 thermogravimetric analyzer. TGA was performed in a nitrogen (N2) atmosphere at a heating rate of 10 °C min−1 from RT to 600 °C with a N2 flow rate of 20 mL min−1. Each test was repeated twice for consistency of the data.2.3. Tribological test procedure
Oils containing ionic liquids were formulated in group 1 mineral base oil at a level of 1000 ppm phosphorous. Ionic liquids were mixed in base oil by pulse ultrasonication for 15 minutes in a DI water bath. Tribological tests were conducted for each oil formulation immediately after mixing. The tribological performances of these IL formulated oils were tested using a cylinder on a reciprocating flat tribometer at the Argonne National Laboratory.34 Friction and wear performance of the ILs are compared with ZDDP at equal phosphorous level (i.e. 0.1 wt% P). Load was applied using a pneumatic pressure unit and friction forces were measured using a strain gauge motion sensor. Oil formulations containing ILs in base oil were tested under this set-up at 134 N applied load, which generates a 500 MPa initial Hertzian contact pressure. All the tests were run at 300 RPM (5 Hz) in pure sliding contact for the duration of an hour at 100 °C. Data was acquired at 5 Hz using the DasyLab software. Tests were performed on flat 52100 hardened steel using a 52100 hardened steel bearing cylinder from RBC bearings. Both flat and cylinder pin samples were cleaned before each test using Stoddard solution followed by isopropanol and acetone to completely remove any oil and dust present on the initial surfaces. The rubbed surfaces after the tests were cleaned with heptane and isopropanol and then stored by submerging the samples in sulfur free base oil.2.4. Tribofilm characterization methods
In order to make a precise measurement of average wear width, cylinders after each test were gently cleaned using heptane followed by rinsing with isopropanol. Wear widths were measured at nine locations on each cylinder using optical images obtained from an Olympus metallographic microscope. The nature of the wear occurring on the surface was studied by examining the surface of the wear tracks using a Hitachi S-3000N SEM to obtain secondary electron images of the wear track and high resolution 3D images of the wear track were acquired using nano-indentation by a Hysitron Triboscope™ in SPM mode.The tribochemistry of the films generated on the rubbing surfaces using ILs and ZDDP was characterized using XANES spectroscopy. This provides chemical information including local coordination of elements at different depths of penetration, for example in the case of phosphorous, the surface can be probed from 5 nm to 60 nm in the case of P L-edge and from 50 nm from the surface to >800 nm in the case of P K-edge.35,36 XANES spectra were obtained at The Canadian Light Source synchrotron facility at Saskatoon Canada. The phosphorous L-edge (P L-edge) data were collected at the VLS-PGM (variable line spacing plane grating monochromator) beam station that operates over the energy range of 5.5–250 eV with a photon resolution of more than 10![[thin space (1/6-em)]](https://www.rsc.org/images/entities/char_2009.gif) 000E/ΔE. All spectra were collected using a 100 μm × 100 μm photon beam spot size. Oxygen K-edge (O K-edge) spectra were obtained using the SGM (spherical grating monochromator) beam line that operates in the energy range between 200 and 2500 eV with a photon resolution of more than 5000E/ΔE. Here, a spot size of 50 μm × 50 μm was chosen to obtain high resolution spectra. Finally, phosphorous K-edge (P K-edge) and sulfur K-edge (S K-edge) spectra were obtained at the SXRMB (Soft X-ray Microcharacterization Beamline) beam station which operates at higher energy from 1.7–10 keV with a photon resolution of 3.3 × 10⁻⁴ with an InSb (111) crystal detector. A 1 mm × 2 mm spot size was chosen to collect the spectra from the SXRMB beam line.
000E/ΔE. All spectra were collected using a 100 μm × 100 μm photon beam spot size. Oxygen K-edge (O K-edge) spectra were obtained using the SGM (spherical grating monochromator) beam line that operates in the energy range between 200 and 2500 eV with a photon resolution of more than 5000E/ΔE. Here, a spot size of 50 μm × 50 μm was chosen to obtain high resolution spectra. Finally, phosphorous K-edge (P K-edge) and sulfur K-edge (S K-edge) spectra were obtained at the SXRMB (Soft X-ray Microcharacterization Beamline) beam station which operates at higher energy from 1.7–10 keV with a photon resolution of 3.3 × 10⁻⁴ with an InSb (111) crystal detector. A 1 mm × 2 mm spot size was chosen to collect the spectra from the SXRMB beam line.
Nano-mechanical properties, i.e. hardness, of the tribofilms generated on the flat steel were measured using a Hysitron Triboscope™. Nano-indentation tests were carried out using a NorthStar™ Cube Corner probe with a total included angle of 90° and <40 nm tip radius. Nano-indentation was performed at nine different locations on a single sample. A cyclic loading profile with partial unload–load was run for each indentation point to study the nano-mechanical properties of the tribofilms as a function of film thickness.
3. Results and discussion
3.1. Thermogravimetric analysis of ionic liquids
Fig. 1 is a plot of weight loss as a function of temperature for the six ILs and ZDDP antiwear additive. The onset of decomposition temperature for the ILs and ZDDP additive was approximated using tangent analysis and is shown in Table 1. ZDDP additive showed an onset decomposition temperature of about 206 °C, which is lower than the ILs except N_DBDTP. That of N_DEHP was about 258 °C, whereas the onset decomposition temperature of N_DBDTP was recorded to be about 172 °C. The P![[double bond, length as m-dash]](https://www.rsc.org/images/entities/char_e001.gif) O bond has a dissociation energy of 544 kJ mol−1 while P
O bond has a dissociation energy of 544 kJ mol−1 while P![[double bond, length as m-dash]](https://www.rsc.org/images/entities/char_e001.gif) S has a dissociation energy of 335 kJ mol−1, hence it is easier for the P
S has a dissociation energy of 335 kJ mol−1, hence it is easier for the P![[double bond, length as m-dash]](https://www.rsc.org/images/entities/char_e001.gif) S linkage to be the point of initial thermal decomposition in N_DBDTP leading to a lower decomposition temperature in comparison to N_DEHP. Similarly, N_DEDTP (P
S linkage to be the point of initial thermal decomposition in N_DBDTP leading to a lower decomposition temperature in comparison to N_DEHP. Similarly, N_DEDTP (P![[double bond, length as m-dash]](https://www.rsc.org/images/entities/char_e001.gif) S linkage) has a lower onset decomposition temperature than P_DMP (P
S linkage) has a lower onset decomposition temperature than P_DMP (P![[double bond, length as m-dash]](https://www.rsc.org/images/entities/char_e001.gif) O linkage). Choline based ILs exhibit lower thermal stability than phosphonium based IL structures with similar anions (N_DEHP vs. P_DMP and N_DBDTP vs. P_DEDTP). P_TFSI exhibited the highest thermal stability with an onset decomposition temperature of about 413 °C.
O linkage). Choline based ILs exhibit lower thermal stability than phosphonium based IL structures with similar anions (N_DEHP vs. P_DMP and N_DBDTP vs. P_DEDTP). P_TFSI exhibited the highest thermal stability with an onset decomposition temperature of about 413 °C.
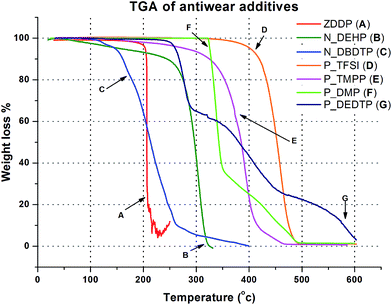 | ||
| Fig. 1 Thermogravimetric analysis plot of the six ILs and ZDDP showing the decomposition temperatures of the different additives. | ||
3.2. Evaluation of coefficient of friction (CoF) and wear volume
Fig. 2 shows a graph of friction coefficient as a function of test duration for the six ionic liquids and compares their friction characteristics with ZDDP at equal phosphorous level as well as with group I base oil that has no additives. All six ILs and ZDDP show an improvement in friction response compared to base oil when added at 0.1 wt% P treatment rate. IL N_DEHP has the lowest friction coefficient, however the CoF tends to increase at the end of the test. ILs N_DBDTP, P_DMP and P_TFSI also display lower friction coefficients in comparison to ZDDP for the duration of the test. On the other hand, ZDDP exhibits stable friction behavior throughout the test whereas all six ILs exhibit some level of variance in friction with the progression of the test.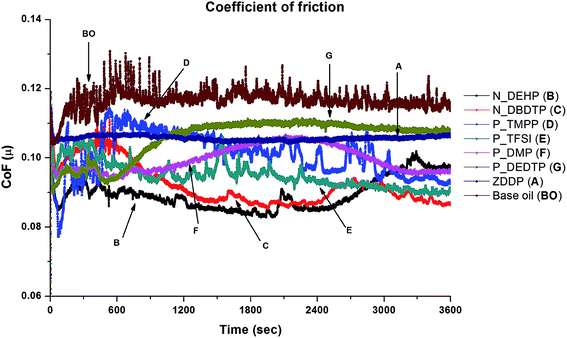 | ||
| Fig. 2 Comparison of coefficient of friction of the six ILs with ZDDP at equal phosphorous level (i.e. 0.1 wt% P) and base oil obtained in pure sliding contact. | ||
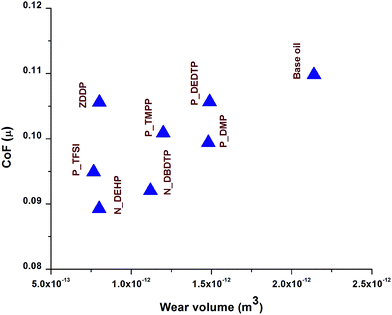
Wear was calculated by measuring the average wear width on the cylinder after each test using optical microscopy. Fig. 3 is a plot of average wear volume loss for the six ILs along with ZDDP and base oil. In comparison with base oil, all ILs showed significant improvement in wear protection in base oil formulations. When compared with ZDDP, N_DEHP exhibited comparable antiwear performance whereas P_TFSI had slightly lower wear volume loss. On the other hand P_DBDTP, P_TMPP, P_DMP and P_DEDTP exhibited significantly higher wear volume losses. Fig. 4 summarizes the tribological performances (i.e. CoF and wear volume loss) of the six ILs along with ZDDP and base oil. Data at the bottom left of the plot have the lowest combination of wear and coefficient of friction (beneficial) and data at the top right hand corner have the highest wear and highest friction (detrimental). Hence, N_DEHP and P_TFSI have better tribological performance compared to ZDDP while P_DMP and P_DEDTP have significantly worse wear but comparable frictional outcomes in comparison to ZDDP.
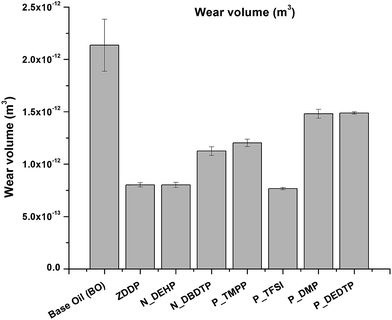 | ||
| Fig. 3 Average wear volume measured for the six ILs and ZDDP blended in base oil at 0.1 wt% P and the neat base oil. | ||
3.3. Analysis of rubbed surfaces using scanning electron microscopy and scanning probe microscopy
Fig. 5 shows the secondary electron SEM images of the worn flat surfaces. The SEM image of the ZDDP lubricated surface exhibits regions of abrasive wear with scratches aligned to the sliding direction together with the formation of protective patchy tribofilms whereas worn surfaces lubricated with N_DEHP and P_TFSI show smoother wear surfaces. N_DEHP exhibits better tribofilm coverage (as evidenced by the dark patches on the surface that are less conductive regions corresponding to patchy tribofilms) over the wear track with mild scratching aligned in the sliding direction. The SEM image obtained for the P_TFSI lubricated wear track indicates mild polishing wear. The SEM image of the N_DBDTP worn surface shows patchy tribofilm formation, with patch sizes that are larger than what is seen in N_DEHP. On the other hand the wear surfaces observed in the case of P_TMPP, P_DMP and P_DEDTP exhibit deeper scratches compared to N_DEHP, N_DBDTP and P_TFSI with P_DMP and P_DEDTP exhibiting the highest surface roughness. The analysis of the morphology of the worn surfaces thus correlates to the wear volume discussed earlier as ILs P_TMPP, P_DMP and P_DEDTP had significantly higher wear amounts whereas ILs N_DEHP and P_TFSI exhibited comparable or even better wear protection than ZDDP. In order to further compliment the findings of the SEM results, SPM images were obtained using a nano-indentation technique in SPM imaging mode. SPM images of rubbed surfaces are obtained for a 60 μm × 60 μm area on the wear track while keeping the Z-axis (±200 nm) the same. SPM images of IL and ZDDP lubricated surfaces are shown in Fig. 6. The arrow in Fig. 6 represents the direction of rubbing. The 3D wear profile of ZDDP lubricated surface exhibits slightly higher surface roughness with a number of small island type features typical of patchy tribofilms covering the asperities whereas 3D profiles of N_DEHP and P_TFSI lubricated surfaces show smoother features on the wear track with smaller patches representative of tribofilms. SPM images of P_DEDTP, P_TMPP and P_DMP lubricated surfaces show scratches with larger peak to valley heights in the direction of rubbing, which compliments the SEM results discussed earlier. The SPM image of N_DBDTP is slightly rougher than N_DEHP but smoother than P_DEDTP, P_TMPP and P_DMP.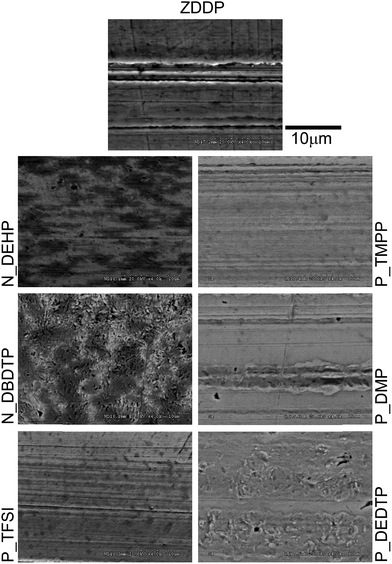 | ||
| Fig. 5 Secondary electron SEM images illustrating the morphology of worn surfaces derived from the six ILs and ZDDP. | ||
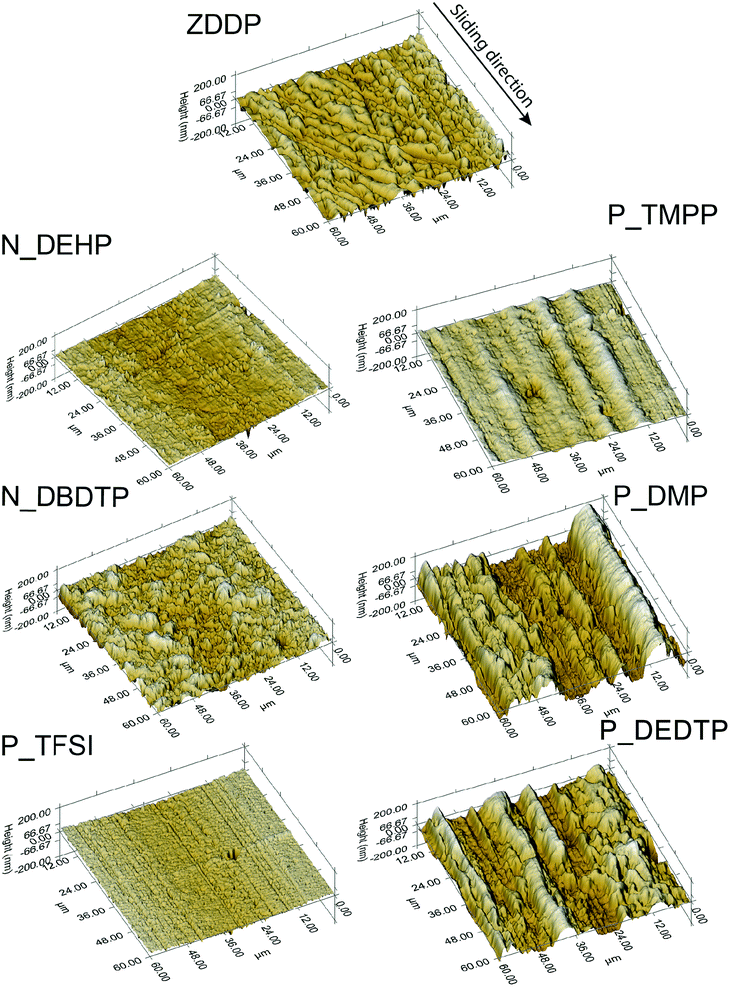 | ||
| Fig. 6 SPM images showing the 3D wear profiles of the rubbed surfaces derived from the six ILs and ZDDP. | ||
3.4. Characterization of tribofilms using XANES
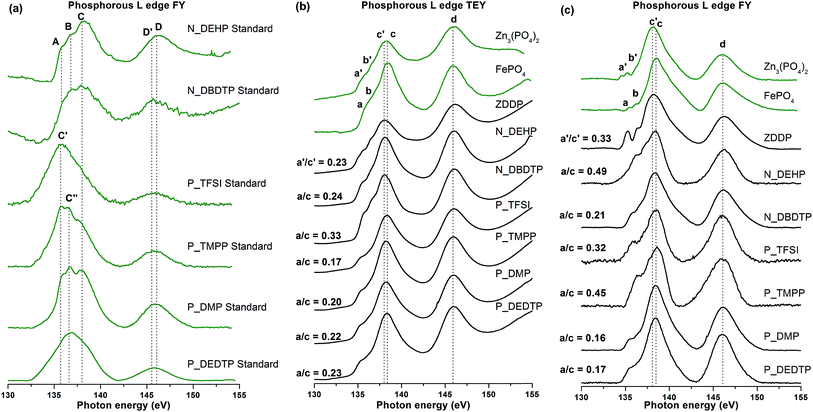
XANES spectroscopy is a non-destructive technique to characterize the chemical nature of tribosurfaces. XANES technique has a unique capability to provide information about the local coordination of elements present on the surface (5–50 nm) as well as in the bulk of the sample (up to several hundred nm).37 It utilizes a high flux of high-energy soft/hard X-ray photons from a synchrotron radiation source. If the flux of photons directed to the sample has sufficient energy to excite a core level electron of an atom, a photoelectron is created and it occupies unoccupied energy states. As a result, a hole is created in either the K or L levels which is subsequently filled by an electron from a high energy shell followed by emission of a fluorescent photon which is detected by a fluorescence detector inside the main chamber and plotted as a fluorescence yield (FY) spectrum. Total electron yield spectra are collected by measuring a neutralization current that is applied to the sample to balance the positive charge created on the sample as X-ray photon absorption leads to the excitation of core level electrons to a continuum. XANES spectra provide details about the electronic and geometric structure of the absorbing atom.38–41 In tribology, XANES analysis has been used extensively to examine the chemical composition of tribofilms derived from using various additives.7,9,10,12,34,36,42–48 In this study, XANES spectra were acquired in total electron yield (TEY) and fluorescence yield (FY) modes. TEY spectra are more surface sensitive whereas FY spectra give information from the bulk of the samples, in the case of Si L-edge the sampling depths of TEY and FY modes are 5 nm and up to 60 nm, respectively.37| Chemical compounds | Peak energy (eV) | ||||||||
|---|---|---|---|---|---|---|---|---|---|
| A | B | C | D | E | a/a′ | b/b′ | c/c′ | d | |
| N_DEHP standard | 135.6 | 136.4 | 138.0 | 146 | |||||
| N_DBDTP standard | 136.8 | 138.0 | 145.5 | ||||||
| P_TFSI standard | 135.7 | ||||||||
| P_TMPP standard | 135.7 | 136.8 | 146 | ||||||
| P_DMP standard | 135.7 | 136.8 | 138.0 | 146 | |||||
| P_DEDTP standard | 136.8 | 145.5 | |||||||
| Iron phosphate | 135.8 | 136.7 | 138.4 | 146 | |||||
| Zinc phosphate | 136 | 137.9 | 138 | 146 | |||||
P L-edge spectra can also be used to determine the chain length of polyphosphates present in the tribofilms using the peak intensity ratio of pre-edge shoulder (a) to main absorption edge (c). Chain lengths of polyphosphates are characterized on the basis of peak height of peak a relative to peak c, where a ratio of a/c up to 0.3–0.4 represents short-chain polyphosphates and a/c > 0.6 indicates long-chain polyphosphates.43,45,51 The a/c ratio of tribofilms derived from ILs and ZDDP is shown in Table 3. From Table 3, it is apparent that tribofilms in this study are primarily made up of short chain polyphosphates at the surface whereas the bulks of the tribofilms are composed of more medium chain polyphosphate films except N_DBDTP, P_DMP and P_DEDTP. Hence, a layered structure of tribofilms is observed with shorter chains at the top of the film and medium chain polyphosphate films in the bulk and close to the tribofilm–substrate interface. The highest a/c, or in other words longest chain polyphosphate film, was observed in the case of N_DEHP, which earlier showed wear behavior comparable to or better than ZDDP in Fig. 3 and 4. P_TFSI that showed comparable or better antiwear results in comparison to ZDDP also has a similar a/c ratio as that of ZDDP tribofilms. In addition, N_DBDTP, P_DMP and P_DEDTP have lower a/c ratio and higher wear volume loss (Fig. 3). Thus, it can be hypothesized that antiwear performance of these novel additives is a function of the chain length of polyphosphate films formed under their respective lubrication. As an exception to this rule, P_TMPP formed a medium chain polyphosphate tribofilm, however the signal to noise ratio is very poor. Here, it can be deduced that even though P_TMPP forms medium chain polyphosphates of iron on the rubbing surfaces, film formation rate is slower than film removal rate, which results in thinner protective phosphate films on the counter surfaces and consequently larger wear volume losses, as seen in Fig. 3.
| Additive chemistry | TEY | FY |
|---|---|---|
| ZDDP | 0.23 | 0.33 |
| N_DEHP | 0.24 | 0.49 |
| N_DBDTP | 0.33 | 0.21 |
| P_TFSI | 0.17 | 0.32 |
| P_TMPP | 0.2 | 0.45 |
| P_DMP | 0.22 | 0.16 |
| P_DEDTP | 0.23 | 0.17 |
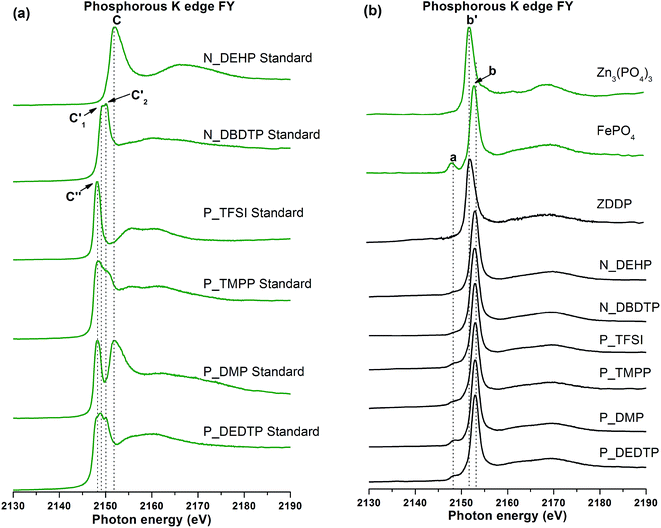 | ||
| Fig. 8 Phosphorous K-edge FY spectra of pure IL standards (a) and tribofilms derived from ZDDP and six ILs as additives as well as model compounds (b). | ||
| Model compounds | Peak energy (eV) (Fig. 8a) | Peak energy (eV) (Fig. 8b) | |||||
|---|---|---|---|---|---|---|---|
| C | C′1 | C′2 | C′′ | a | b | b′ | |
| N_DEHP standard | 2151.83 | ||||||
| N_DBDTP standard | 2149.08 | 2150.05 | |||||
| P_TFSI standard | 2148.26 | ||||||
| P_TMPP standard | 2150.1 | 2148.25 | |||||
| P_DMP standard | 2151.83 | 2148.25 | |||||
| P_DEDTP standard | 2149.08 | 2150.05 | 2148.25 | ||||
| Iron phosphate | 2148.31 | 2153.22 | |||||
| Zinc phosphate | 2152.2 | ||||||
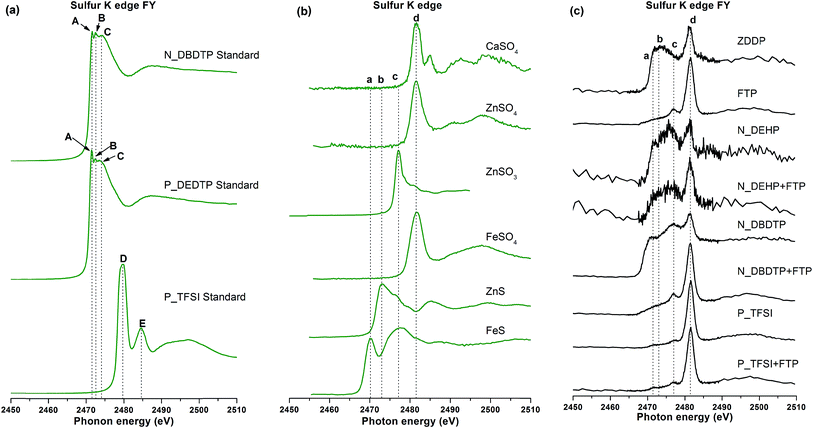 | ||
| Fig. 9 (a) Sulfur K-edge spectra of sulfur containing IL standards. Sulfur K-edge FY spectra of model compounds (b) and tribofilms derived from ZDDP and six ILs (c). | ||
S K-edge spectra of tribofilms are plotted in Fig. 9c and are compared with the model compounds in Fig. 9b. Since sulfur exists in different valence states ranging from −2 to +6 with −2 being the reduced state and the +6 being the oxidized state, various peaks have been identified in the S K-edge spectra of the model compounds. The absorption edges identified from sulfur model compounds are labeled as a, b, c, d and e in Fig. 9b. Where peak a and c correspond to iron sulfide, peak b and e correspond to zinc sulfide and peak d corresponds to sulfates and is characteristic of sulfate regardless of the structure. Peak e also distinguishes calcium sulfate from zinc sulfate and iron sulfates. In Fig. 9c, S K-edge FY spectra of ZDDP tribofilms primarily show two main absorption edges at peak b and peak d, suggesting that sulfur in ZDDP tribofilms is primarily present in the form of ZnS (peak b) and sulfates (peak d), mainly ZnSO4 as well as FeSO4 to some extent. It can also be deduced from the spectrum that the sulfide to sulfate ratio is higher in ZDDP tribofilms. N_DEHP, P_TMPP and P_DMP do not have sulfur in the pristine structures yet their respective S K-edge tribofilm spectra exhibit a weak sulfur signal. The mineral base oil used in this study has a sulfur impurity of about 300 ppm, which may provide a small amount of sulfur, thus the S K-edge spectra of N_DEHP, P_TMPP and P_DMP show a weak sulfur signal confirming that there is not much sulfur present in their respective tribofilms. The S K-edge FY spectrum of N_DBDTP tribofilms features peaks a, c and d confirming the formation of FeS and FeSO4 in the tribofilms. The relative intensity of sulfide peak to sulfate peak is higher in the case of N_DBDTP than the other sulfur containing ILs. P_TFSI and P_DEDTP also show stronger signals for sulfates rather than sulfides in their respective S K-edge spectra.
S K-edge spectra can also be used to distinguish the state of sulfur in pristine IL standards and IL derived tribofilms. N_DBDTP and P_DEDTP derived tribofilms have their main absorption edge at peak position d (2481.5 eV) in Fig. 9c whereas the main absorption edge for pure N_DBDTP and P_DEDTP was found to be at lower energy i.e. peak A and peak B (2471.5 eV and 2472.5 eV) in Fig. 9a, suggesting that sulfur in the tribofilms is primarily present in the form of FeSO4 instead of pure IL. In the case of P_TFSI, the main absorption edge of the tribofilm was found at peak d (2481.5 eV) in Fig. 9c, whereas the main absorption edge of pure P_TFSI standard was observed at peak D (2479.7 eV) and post-edge shoulder at peak E (2484.6 eV) in Fig. 9a, which suggests a change in the sulfur environment from the P_TFSI derived tribofilms to its respective chemistry in pure IL.
![[double bond, length as m-dash]](https://www.rsc.org/images/entities/char_e001.gif) S linkage. The main peaks located between 537 and 539 eV (B, C, and D) have contribution from multiple sources. Two absorption edges are observed for N_DEHP at energies of 537.8 eV, i.e. peak C, and 539 eV, i.e. peak D. These two absorption edges are believed to originate from O–R and P–O linkages. Similar peaks are also observed in the case of P_DMP, which has a similar anion to N_DEHP where four O atoms are bound with one P atom. When N_DEHP and N_DBDTP spectra are examined, peak D is diminished relative to peak B in N_DBDTP compared to N_DEHP. This is possibly because the four oxygen atoms in N_DEHP are in P
S linkage. The main peaks located between 537 and 539 eV (B, C, and D) have contribution from multiple sources. Two absorption edges are observed for N_DEHP at energies of 537.8 eV, i.e. peak C, and 539 eV, i.e. peak D. These two absorption edges are believed to originate from O–R and P–O linkages. Similar peaks are also observed in the case of P_DMP, which has a similar anion to N_DEHP where four O atoms are bound with one P atom. When N_DEHP and N_DBDTP spectra are examined, peak D is diminished relative to peak B in N_DBDTP compared to N_DEHP. This is possibly because the four oxygen atoms in N_DEHP are in P![[double bond, length as m-dash]](https://www.rsc.org/images/entities/char_e001.gif) O and P–O–C configurations but in N_DBDTP they are configured as P–O–C only.
O and P–O–C configurations but in N_DBDTP they are configured as P–O–C only.
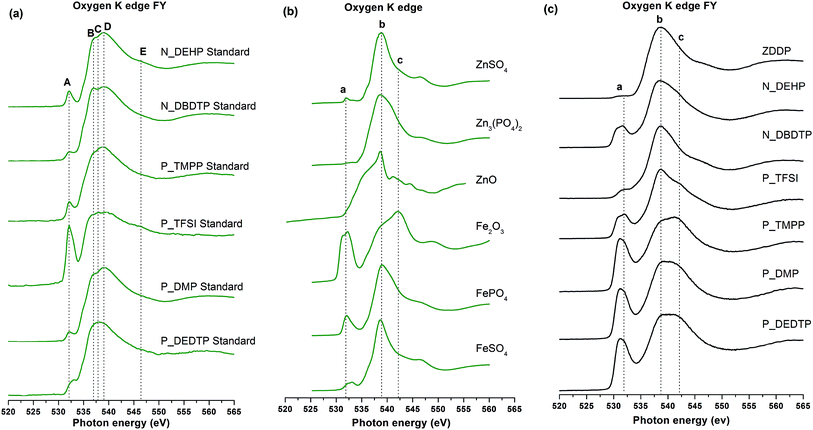 | ||
| Fig. 10 (a) Oxygen K-edge spectra of pure IL standards. Oxygen K-edge FY spectra of model compounds (b) and tribofilms formed from ZDDP and IL lubrication (c). | ||
O K-edge spectra of tribofilms are plotted in Fig. 10c and compared with model compounds in Fig. 10b. O K-edge spectra were acquired in both TEY and FY modes for the tribofilms and the model compounds as well as pure IL standards. TEY and FY spectra are very similar; only the FY spectra are shown for reference while the discussion pertains to both TEY and FY spectra. Fig. 10c is a plot of the O K-edge FY spectra of tribofilms derived from ZDDP and IL lubrication. Three peaks are identified and labeled as peaks a, b & c. By fingerprint matching of these peaks with model compounds in spectra in Fig. 10b, it can be deduced that peak a is uniquely present in all the model compounds where oxygen is associated with Fe cations such as FePO4, FeSO4 and Fe2O3, peak b is a main absorption edge that originates from either (PO4)2− or (SO4)2− structures whereas peak c is a main absorption edge for Fe2O3 model compound. O K-edge spectra of tribofilms generated using N_DEHP, N_DBDTP and P_TFSI show main absorption edges at peak b (538.9 eV) with a pre-edge peak at peak a (531.9 eV), whereas ZDDP tribofilms only show a main absorption edge at peak b, suggesting the ZDDP tribofilms are primarily composed of Zn3(PO4)2 and ZnSO4 while the tribofilms derived from N_DEHP, N_DBDTP and P_TFSI are composed of FePO4 in the case of N_DEHP and FePO4 and FeSO4 in the cases of N_DBDTP and P_TFSI. The dominant presence of peak c (542.18 eV) for tribofilms derived from P_TMPP, P_DMP and P_DEDTP indicates oxidation of the surfaces since peak c is a characteristic absorption edge for Fe2O3. These results from O K-edge spectra complement the wear results (seen in Fig. 3) as ILs P_TMPP, P_DMP and P_DEDTP showed higher wear losses since the surface chemistry obtained using these ILs is dominated by oxidation of the surfaces rather than formation of phosphate antiwear films. Whereas O K-edge spectra of additives with lower wear losses such as ZDDP, N_DEHP and P_TFSI show more phosphate formation on the rubbed surfaces rather than oxide formation.
3.5. Nano-indentation
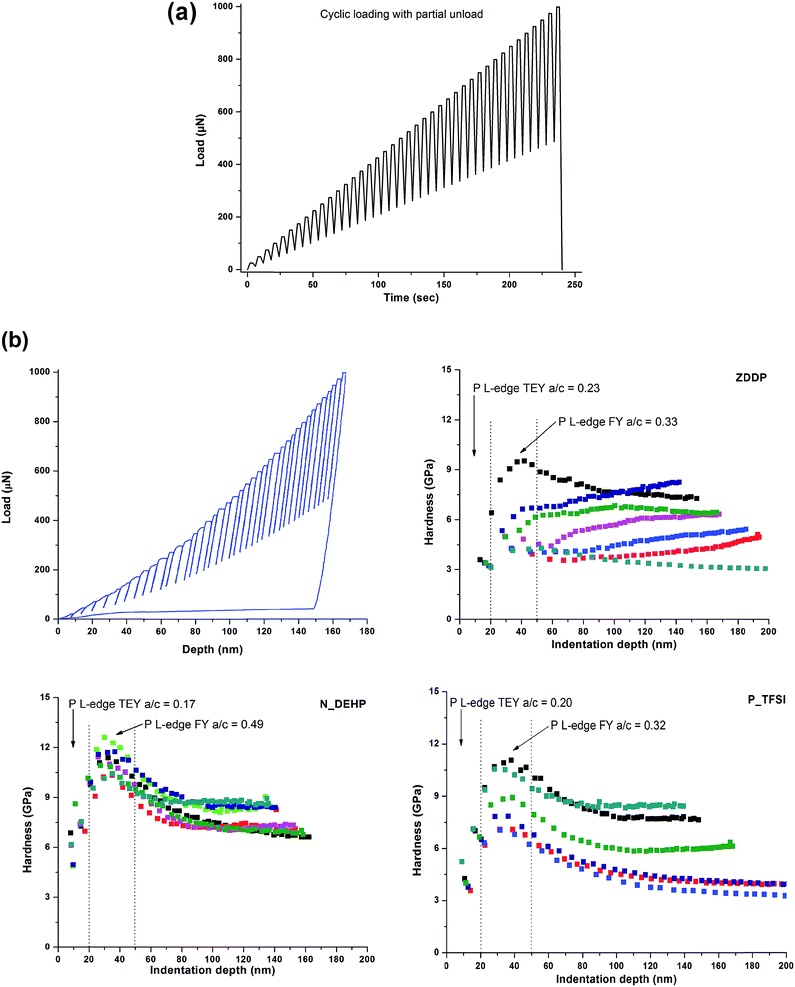
Since XANES analysis revealed that the tribofilms derived from different additives such as ZDDP or ILs have different chemical make-up, it is important to understand the resultant mechanical properties of these different tribochemical films to evaluate their respective antiwear behavior. Nano-mechanical properties of tribofilms derived from IL lubricated surfaces were measured using nano-indentation technique. Hardness of IL derived tribofilms were compared with ZDDP lubricated tribofilms. Nano-indentation was performed on each tribofilm sample using a cyclic loading with partial unload function as shown in Fig. 11a. Fig. 11b shows a plot of tribofilm hardness as a function of film depth for ZDDP and the ILs. Nano-mechanical properties of the best antiwear performing ILs are compared with ZDDP in Fig. 11b. In Fig. 11b, the top left graph shows a plot of applied vertical load against penetration depth that is generated after each indentation test. The presence of such load vs. depth plots were set as a criteria for the selection of indentation and hardness profile plotted for a particular indent location in the other three hardness plots. In the case of ZDDP, the hardness profile varies with the indentation location, however, a general trend can be observed where ZDDP tribofilm hardness increases with the indentation depth up to 100 nm and then remains constant. ZDDP tribofilms show large variation in hardness, where the minimum hardness observed is ∼3 GPa and the maximum hardness is ∼10 GPa. Compared with the ZDDP tribofilm hardness profile, both N_DEHP and P_TFSI show more consistent hardness profiles at different indentation locations suggesting that IL derived tribofilms have more uniform properties. N_DEHP tribofilms show low hardness near the surface and then hardness increases to a peak value at ∼12 GPa at 40–50 nm indentation depth and then starts to decrease with further depth as the measurement becomes influenced by substrate hardness (alloy steel), which has a hardness ∼8–10 GPa.55 P_TFSI shows variation in its hardness profile at different locations but more than one location shows similar hardness profiles suggesting that there are regions of low hardness and high hardness. This could be explained as high hardness films forming in areas of peak to peak contact with much higher contact pressure, whereas regions of valley to valley contact remain relatively soft. Similarly, Bec et al.56 also reported that pad regions (4 to 8 GPa) are harder than valley regions (1–3 GPa).In all cases, the surface of the tribofilms is softer than the bulk of the tribofilms with hardness increasing with indentation depth. These results are consistent with previous studies where similar hardness profiles have been reported for tribofilms. Nehme et al.57 studied the effect of contact load on tribofilm properties and reported that ZDDP tribofilm hardness increases with indenter depth as well as with increasing contact pressure during the wear test. Furthermore, film hardness can also be correlated with the surface chemistry. P L-edge TEY spectra from XANES provide information up to 10–15 nm from the surface whereas FY gives information up to 50–60 nm. P L-edge a/c ratios calculated earlier from XANES analysis indicate that in the case of ZDDP the P L-edge a/c ratio increases from 0.23 (TEY) to 0.33 (FY) and subsequently results in an increase in the ZDDP tribofilm hardness from 3 GPa to 8–9 GPa, respectively (as seen in Fig. 11a). Similarly, N_DEHP and P_TFSI have higher a/c ratios in their FY spectra than TEY, which is indicative of longer chain phosphate formation in the bulk of the films than the tribofilms at the surface. From their respective hardness profiles, it can be deduced that at the surface tribofilms with shorter chain phosphates have lower hardness (∼3–4 GPa) and as the phosphate chain length increase the hardness of the films also increases (up to ∼12 GPa). The highest hardness was observed in the case of N_DEHP ∼ 12 GPa, which has the highest a/c ratio of 0.49. This result is consistent with the theoretical model developed by Mosey et al.58 where they showed that longer chain lengths and crosslinking of zinc phosphate films resulted in higher stiffness of tribofilms.
4. Conclusions
• Tribological properties of six ILs are studied and compared with ZDDP additive at equal phosphorous treatment rate (i.e. 0.1 wt% P) in group I BO. All ILs showed variance in their friction curves while ZDDP showed a relatively consistent friction coefficient. The lowest CoF was recorded for IL N_DEHP. Both IL N_DEHP and P_TFSI showed comparable or even better wear protection than ZDDP, whereas N_DBDTP, P_TMPP, P_DMP and P_DEDTP showed worse wear outcomes than ZDDP.• XANES analyses (P L2,3 & K-edge and S K-edge) indicate that tribofilms derived from IL lubricated surfaces have different chemical make-up than the original IL chemistry as the original structures of ILs are not found on the worn surface Thus, it can be hypothesized that phosphorous containing ILs do participate in the tribochemical reaction during the rubbing action and form antiwear phosphate films on tribosurfaces under mixed to boundary lubrication conditions by interacting with Fe substrate. XANES analysis also showed that these findings further develop a strong understanding of the ability of ILs to interact with the rubbing surface and form glassy antiwear films composed of phosphates of Fe.
• P L-edge spectra of the tribofilms showed that the surfaces of the tribofilms are composed of short chain polyphosphates and medium chain phosphates formed in the bulk except N_DBDTP, P_DMP and P_DEDTP.
• Nano-indentation results showed that N_DEHP derived tribofilms have uniform properties while ZDDP showed different hardness at different indentation locations. In all cases, hardness increases from the surface towards the bulk.
Acknowledgements
XANES experiments were conducted at the Canadian Light Source, Saskatoon, Saskatchewan, Canada, supported by NSERC, NRC, CIHR and the University of Saskatchewan. Tribological tests were performed at Argonne National Laboratory. Support provided by Dr Ali Erdemir is gratefully acknowledged. Nano-indention experiments were conducted at the Center for Characterization for Materials and Biology at the University of Texas at Arlington. This work was also supported by the “Austrian COMET-Program” in the frame of K2 XTribology (project no. 849109).References
- K. Holmberg, P. Andersson and A. Erdemir, Tribol. Int., 2012, 47, 221–234, DOI:10.1016/j.triboint.2011.11.022.
- K. Holmberg, P. Andersson, N. Nylund, K. Mäkelä and A. Erdemir, Tribol. Int., 2014, 78, 94–114 CrossRef.
- J. Qu, W. C. Barnhill, H. Luo, H. M. Meyer, D. N. Leonard, A. K. Landauer, B. Kheireddin, H. Gao, B. L. Papke and S. Dai, Adv. Mater., 2015, 27(32), 4767–4774 CrossRef CAS PubMed.
- J. Qu, H. Luo, M. Chi, C. Ma, P. J. Blau, S. Dai and M. B. Viola, Tribol. Int., 2014, 71, 88–97, DOI:10.1016/j.triboint.2013.11.010.
- V. Totolin, I. Minami, C. Gabler and N. Dörr, Tribol. Int., 2013, 67, 191–198, DOI:10.1016/j.triboint.2013.08.002.
- I. Minami, Molecules, 2009, 14, 2286–2305 CrossRef CAS PubMed.
- V. Sharma, C. Gabler, N. Doerr and P. B. Aswath, Tribol. Int., 2015, 92, 353–364, DOI:10.1016/j.triboint.2015.07.009.
- J. Qu, P. J. Blau, S. Dai, H. Luo and H. M. Meyer III, Tribol. Lett., 2009, 35, 181–189 CrossRef CAS.
- X. Chen, R. L. Elsenbaumer and P. B. Aswath, Tribol. Int., 2013, 69, 114–124 CrossRef.
- X. Chen, B. Kim, R. Elsenbaumer and P. B. Aswath, Tribol.-Mater., Surf. Interfaces, 2012, 6(3), 121–133 CrossRef CAS.
- B. Kim, Tribological Performance of Ashless Antiwear Additives Under Extreme Pressure Conditions, University of Texas at Arlington, Arlington, Texas, 2009 Search PubMed.
- B. Kim, R. Mourhatch and P. B. Aswath, Wear, 2010, 268, 579–591 CrossRef CAS.
- A. Erdemir and O. Eryilmaz, Friction, 2014, 2, 140–155 CrossRef CAS.
- A. Ala’A, O. Eryilmaz, A. Erdemir and S. H. Kim, Carbon, 2014, 73, 403–412 CrossRef.
- V. Macián, B. Tormos, V. Bermúdez and L. Ramírez, Tribol. Int., 2014, 79, 132–139 CrossRef.
- S. Keskin, D. Kayrak-Talay, U. Akman and Ö. Hortaçsu, J. Supercrit. Fluids, 2007, 43, 150–180, DOI:10.1016/j.supflu.2007.05.013.
- J. S. Wilkes, J. Mol. Catal. A: Chem., 2004, 214, 11–17, DOI:10.1016/j.molcata.2003.11.029.
- H. Zhao, Chem. Eng. Commun., 2006, 193, 1660–1677 CrossRef CAS.
- W. L. Hough and R. D. Rogers, Bull. Chem. Soc. Jpn., 2007, 80, 2262–2269 CrossRef CAS.
- T. Torimoto, T. Tsuda, K. Okazaki and S. Kuwabata, Adv. Mater., 2010, 22, 1196–1221 CrossRef CAS PubMed.
- C. Ye, W. Liu, Y. Chen and L. Yu, Chem. Commun., 2001, 2244–2245 RSC.
- W. C. Barnhill, J. Qu, H. Luo, H. M. Meyer III, C. Ma, M. Chi and B. L. Papke, ACS Appl. Mater. Interfaces, 2014, 6, 22585–22593 CAS.
- A. E. Jiménez, M. D. Bermúdez, P. Iglesias, F. J. Carrión and G. Martínez-Nicolás, Wear, 2006, 260, 766–782, DOI:10.1016/j.wear.2005.04.016.
- H. Wang, Q. Lu, C. Ye, W. Liu and Z. Cui, Wear, 2004, 256, 44–48 CrossRef CAS.
- M. Yao, M. Fan, Y. Liang, F. Zhou and Y. Xia, Wear, 2010, 268, 67–71 CrossRef CAS.
- M. Cai, Y. Liang, M. Yao, Y. Xia, F. Zhou and W. Liu, ACS Appl. Mater. Interfaces, 2010, 2, 870–876 CAS.
- R. P. Swatloski, J. D. Holbrey and R. D. Rogers, Green Chem., 2003, 5, 361–363 RSC.
- A. Jimenez and M. Bermúdez, Tribol. Lett., 2007, 26, 53–60 CrossRef CAS.
- L. Pisarova, C. Gabler, N. Dörr, E. Pittenauer and G. Allmaier, Tribol. Int., 2012, 46, 73–83, DOI:10.1016/j.triboint.2011.03.014.
- L. Pisarova, V. Totolin, C. Gabler, N. Dörr, E. Pittenauer, G. Allmaier and I. Minami, Tribol. Int., 2013, 65, 13–27 CrossRef CAS.
- V. Totolin, I. Minami, C. Gabler, J. Brenner and N. Dörr, Tribol. Lett., 2014, 53, 421–432 CrossRef CAS.
- J. Qu, D. G. Bansal, B. Yu, J. Y. Howe, H. Luo, S. Dai, H. Li, P. J. Blau, B. G. Bunting and G. Mordukhovich, ACS Appl. Mater. Interfaces, 2012, 4, 997–1002 CAS.
- B. Yu, D. G. Bansal, J. Qu, X. Sun, H. Luo, S. Dai, P. J. Blau, B. G. Bunting, G. Mordukhovich and D. J. Smolenski, Wear, 2012, 289, 58–64 CrossRef CAS.
- V. Sharma, A. Erdemir and P. B. Aswath, Tribol. Int., 2015, 82, 43–57 CrossRef CAS.
- M. S. Fuller, L. R. Fernandez, G. Massoumi, W. Lennard, M. Kasrai and G. Bancroft, Tribol. Lett., 2000, 8, 187–192 CrossRef CAS.
- M. Nicholls, M. N. Najman, Z. Zhang, M. Kasrai, P. R. Norton and P. U. P. A. Gilbert, Can. J. Chem., 2007, 85, 816–830 CrossRef CAS.
- M. Kasrai, W. N. Lennard, R. W. Brunner, G. M. Bancroft, J. A. Bardwell and K. H. Tan, Appl. Surf. Sci., 1996, 99, 303–312 CrossRef CAS.
- A. Bianconi, D. Koningsberger and R. Prins, XANES Spectroscopy, ed. D. C. Koningsberger and R. Prins, John Wiley & Sons, Inc., New York, NY, 1988, pp. 573–662 Search PubMed.
- A. Meisel, G. Leonhardt, R. Szargan and E. Källne, X-ray spectra and chemical binding, Springer, 1989 Search PubMed.
- P. Behrens, TrAC, Trends Anal. Chem., 1992, 11, 237–244 CrossRef CAS.
- P. Behrens, TrAC, Trends Anal. Chem., 1992, 11, 218–222 CrossRef CAS.
- Y. Li, G. Pereira, A. Lachenwitzer, M. Kasrai and P. R. Norton, Tribol. Lett., 2007, 27, 245–253 CrossRef CAS.
- Y. Li, G. Pereira, M. Kasrai and P. R. Norton, Tribol. Lett., 2007, 28, 319–328 CrossRef.
- M. A. Nicholls, T. Do, G. M. Bancroft, P. R. Norton, M. Kasrai, T. W. Capehart, Y. Cheng and T. Perry, Tribol. Lett., 2003, 15(3), 241–248 CrossRef CAS.
- M. N. Najman, M. Kasrai, G. M. Bancroft, B. H. Frazer and G. DeStatio, Tribol. Lett., 2004, 17(4), 811–822 CrossRef CAS.
- G. Pereira, D. Munoz-Paniagua, A. Lachenwitzer, M. Kasrai, P. R. Norton, T. W. Capehart, T. A. Perry and Y. Cheng, Wear, 2007, 262, 461–470 CrossRef CAS.
- M. N. Najman, M. Kasrai and G. M. Bancroft, Tribol. Lett., 2004, 17(2), 217–229 CrossRef CAS.
- M. Najman, M. Kasrai, G. Michael Bancroft and R. Davidson, Tribol. Int., 2006, 39, 342–355 CrossRef CAS.
- J. Kruse, P. Leinweber, K. Eckhardt, F. Godlinski, Y. Hu and L. Zuin, J. Synchrotron Radiat., 2009, 16, 247–259 CrossRef CAS PubMed.
- M. Kasrai, M. Puller, M. Scaini, Z. Yin, R. W. Brunner, G. M. Bancroft, M. E. Fleet, K. Fyfe and K. H. Tan, in Tribology Series, ed. D. Dowson, C. M. Taylor, T. H. C. Childs and G. Dalmaz, Elsevier, 1995, pp. 659–669 Search PubMed.
- Z. Yin, M. Kasrai, G. M. Bancroft, K. H. Tan and X. Feng, Phys. Rev. B: Condens. Matter Mater. Phys., 1995, 51, 742–750 CrossRef CAS.
- M. A. Nicholls, P. R. Norton, G. M. Bancroft and B. H. Do, Tribol. Lett., 2004, 17, 205–216 CrossRef CAS.
- G. Harp, Z. Han and B. Tonner, J. Vac. Sci. Technol., A, 1990, 8, 2566–2569 CAS.
- D. Li, G. M. Bancroft, M. Kasrai, M. E. Fleet, X. H. Feng and K. H. Tan, Am. Mineral., 1994, 79, 785–788 CAS.
- R. Mourhatch and P. B. Aswath, Tribol. Int., 2011, 44, 201–210, DOI:10.1016/j.triboint.2010.10.035.
- S. Bec, A. Tonck, J. M. Georges, R. C. Coy, J. C. Bell and G. W. Roper, Relationship between mechanical properties and structures of zinc dithiophosphate anti-wear films, London, UK, 1999 Search PubMed.
- G. Nehme, R. Mourhatch and P. B. Aswath, Wear, 2010, 268(9–10), 1–1147, DOI:10.1016/j.wear.2010.01.001.
- N. Mosey, T. Woo, M. Kasrai, P. Norton, G. Bancroft and M. Müser, Tribol. Lett., 2006, 24, 105–114 CrossRef CAS.
| This journal is © The Royal Society of Chemistry 2016 |

