
Adenosine monophosphate-capped gold(I) nanoclusters: synthesis and lanthanide ion-induced enhancement of their luminescence†
Julie P. Vanegasa,
Elena Zaballos-Garcíab,
María González-Béjara,
Pablo Londoño-Larreaa and
Julia Pérez-Prieto*a
aInstituto de Ciencia Molecular (ICmol), Univ. Valencia, Catedrático José Beltrán 2, 46980, Paterna, Valencia, Spain. E-mail: julia.perez@uv.es; Fax: +34 963543576; Tel: +34 963543050
bDep. Organic Chemistry, University of Valencia, Av. Vicent Andres Estelles s/n, 46100, Burjassot, Spain
First published on 2nd February 2016
Abstract
Reduction of Au3+ in the presence of just adenosine 5′-monophosphate (AMP) and a zwitterionic organic chemical buffering agent, specifically 4-(2-hydroxyethyl)-1-piperazineethanesulfonic acid (HEPES), combined with light exposure, gives rise to luminescent, water-soluble Au+ nanoclusters (Au+ NCs). The photoluminescence of these NCs is considerably enhanced by adding Y3+ or the chemically similar Yb3+ lanthanide that leads to Au+/Y3+ and Au+/Yb3+ NCs, respectively. These NCs are characterised by absorption (steady-state), photoluminescence (steady-state and time-resolved), and X-ray photoelectron spectroscopy.
Fluorescent, water-dispersible gold nanoparticles of an extremely small size (with a diameter usually smaller than 2 nm) are currently being studied for chemical sensing and catalysis and also for biological applications (bioimaging and photodynamic therapy)1–8 on account of their low toxicity, biocompatibility, chemical and photochemical stability, and easy surface functionalisation.
These gold nanoparticles present a considerable electronic energy quantisation and as a consequence they exhibit a discrete electronic structure and molecule-like properties. They are considered to be a new type of material and have been termed as ultra-small nanoparticles or nanoclusters (AuNCs) to differentiate them from plasmonic gold nanoparticle (AuNPs).
Contrary to AuNPs, AuNCs can exhibit light emission, which is size-dependent, and they can present a short lifetime (a few nanoseconds).9 This luminescence seems to manifest the intrinsic quantisation effects of the metal core. Alternatively, AuNCs can exhibit a long-lived luminescence (a few hundred ns to a few ms), which is considerably red-shifted (large Stokes shift). In this case, the luminescence maximum depends on the nature of the ligand anchoring group and this has been attributed to charge transfer between this group and the cluster surface.10 For example, luminescent AuNCs capped with AMP have been prepared by reduction of HAuCl4 using citrate and light exposure;11 they exhibit considerably long-lived, blue-light luminescence (at ca. 470 nm, lifetime of ca. 1 μs, quantum yield, Φf, of 1.6%). Polyadenosine-capped AuNCs obtained by the same strategy also show luminescence at ca. 470 nm.12
This kind of luminescence has usually been ascribed to the presence of Au+ at the nanocluster surface. Thus, luminescent Au@Au+–thiolate core–shell NCs have been formed by the controlled aggregation of Au(I)–thiolate complexes on in situ generated Au(0) cores. These nanoclusters exhibited a large Stokes shift and a high quantum yield (∼15%).13 The presence of Au+ was demonstrated by X-ray photoelectron spectroscopy (XPS). The addition of a strong reducing agent, NaBH4, to the thiolate-capped Au@Au+ NC produced non-luminescent AuNCs. This corroborated the role of Au+ in the luminescence of this nanocluster.
The potential benefits of metal ion doping on the AuNC luminescence has been proved in glutathione-capped AuNCs, whose luminescence is about four-fold enhanced by incorporating a small amount of a silver salt during the synthesis of the nanocluster.14 While gold was found to be only in the reduced state, i.e., Au(0), it was difficult to determine if the oxidation state of silver was Ag(0) or Ag+ due to the close proximity of their binding energies. In addition, highly luminescent AuNCs have been prepared by doping glutathione-capped AuNCs with trivalent cerium ions during the seed crystal growth. These Au/Ce NCs have recently been tested for high sensitive bioimaging.15 XPS spectra were consistent with the presence of Au(0) and Ce3+. They exhibited a luminescence lifetime in the microsecond scale. Unfortunately, a comparative analysis between the luminescence of Ce-doped and the un-doped AuNCs was not included.
On the other hand, the luminescence quenching of BSA-capped AuNCs by some metal ions, such as Hg2+, Cu2+, and Ni2+, has been used for sensing the corresponding metal ion or for fluorescence turn-on detection of biomolecules.16,17 The fluorescence quenching can arise from the ion complexation with the ligand18,19 or, in some cases, through the d10–d10 interaction between the ion and Au+.20
From the above-mentioned results it can be inferred that the presence of metal cations (either Au+ or cations from other metals), could induce either enhancement or quenching of the charge-transfer luminescence in AuNCs. In line with this, we envisaged the interest of studying the effect of lanthanide ions, in particular, Yb3+ and Y3+, which is usually included in the lanthanide series due to its similar nature, on the luminescence of AMP-capped AuNCs.
We report here the preparation of blue-luminescent AMP-capped Au+ NCs by using HEPES, as the surfactant and reductant, and light exposure. The photoluminescence (PL) of the NCs was considerably enhanced after adding Y3+ and Yb3+. Cooling of the samples containing Y3+ and Yb3+ eventually produced Au+/Ln3+ NCs with about two-fold enhanced emission when compared with that of the initial Au+ NCs. Spectroscopic data are consistent with Au+–Ln3+ interactions at the surface of the Au+ NC.
Synthesis and characterisation of the Au+ NCs
The nanoclusters were prepared in the absence of a strong reductant. In brief, addition of HAuCl4 to AMP in milli-Q water (1.0![[thin space (1/6-em)]](https://www.rsc.org/images/entities/char_2009.gif) :1.6 HAuCl4/AMP molar ratios) was followed by addition of HEPES and, then, the reaction was kept under lab light for 72 h (Fig. S1 in ESI†). The role of light could be to facilitate reorganization of gold binding to the capping ligand.6 After two cycles of precipitation with acetone and freezing (−18 °C)/centrifugation (11000 rpm), the clean AuNCs were preserved re-dispersed in water (see details in ESI†). Though the AuNCs can be prepared at different basic pHs (Fig. S2 in ESI†), the solution pH was crucial for the stability of the nanocluster. Thus, those prepared at pH ca. 8 remained stable, whereas those in more basic media eventually led to AuNPs. The reaction time was shortened to ca. 9 h by performing the reaction under UV-B irradiation inside a photoreactor (Fig. S3 in ESI†).21–23 Control experiments showed that the AuNCs were not obtained in the absence of HEPES.
:1.6 HAuCl4/AMP molar ratios) was followed by addition of HEPES and, then, the reaction was kept under lab light for 72 h (Fig. S1 in ESI†). The role of light could be to facilitate reorganization of gold binding to the capping ligand.6 After two cycles of precipitation with acetone and freezing (−18 °C)/centrifugation (11000 rpm), the clean AuNCs were preserved re-dispersed in water (see details in ESI†). Though the AuNCs can be prepared at different basic pHs (Fig. S2 in ESI†), the solution pH was crucial for the stability of the nanocluster. Thus, those prepared at pH ca. 8 remained stable, whereas those in more basic media eventually led to AuNPs. The reaction time was shortened to ca. 9 h by performing the reaction under UV-B irradiation inside a photoreactor (Fig. S3 in ESI†).21–23 Control experiments showed that the AuNCs were not obtained in the absence of HEPES.
The UV-vis spectrum of the nanoclusters displayed a broad UV-band with two maxima at ca. 300 nm and 260 nm (Fig. 1a). The AuNCs exhibited a blue luminescence with maximum at ca. 474 nm (Fig. 1b and c) and a quantum yield of 2.6%. The PL spectrum was similar to that reported for AuNCs capped with AMP or polyadenosine, prepared by reduction of HAuCl4 by citrate and light exposure in the presence of AMP and polyadenosine, respectively.11,12
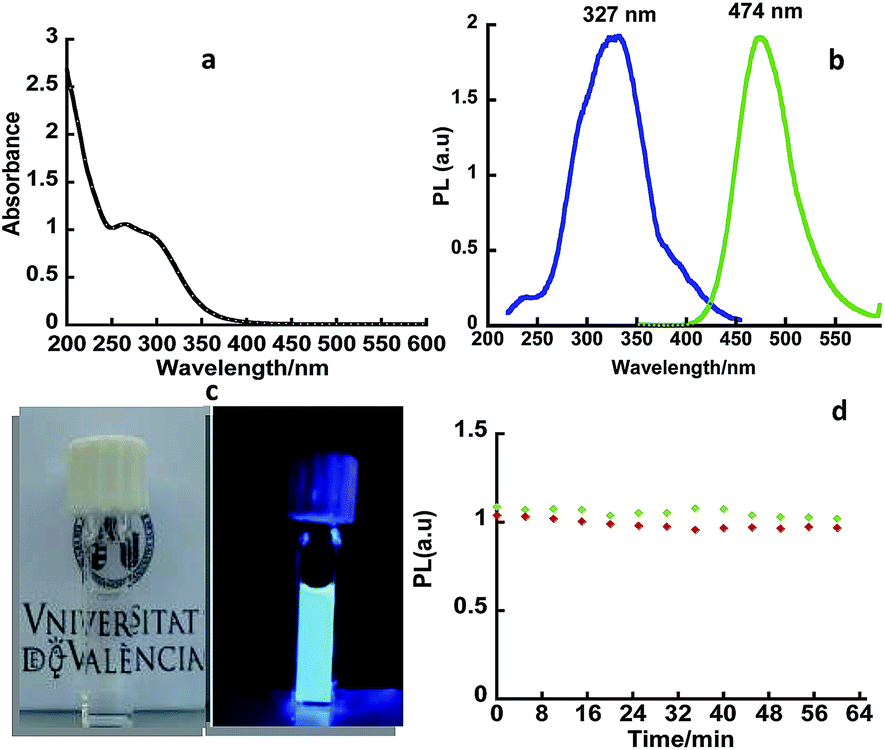 | ||
| Fig. 1 (a) Absorption spectrum of Au+ NCs in water; (b) emission spectrum of Au+ NCs in water recorded at λex = 300 nm (green) and their excitation spectra (blue) at λem = 474 nm; (c) picture of Au+ NCs under lab light and UVB light; (d) room-temperature PL (λem = 474 nm) of Au+ NCs in water as function of the irradiation time; (λex = 300 nm). | ||
The PL (λex = 300 nm) kinetic traces fitted to two components, the short lifetime component is dominant (80.1%) and has a lifetime (τ1) of ca. 70.3 ns and the long lifetime component has a lifetime (τ2) of ca. 424.5 ns (19.9%) (Table 1). The excitation spectrum (λem = 470 nm) showed a broad band with maximum at 327 nm that could be ascribed to the interaction between the ligand anchoring group(s) and the nanocluster surface.
| τav (ns) | τ1 (ns) | A1 (%) | τ2 (ns) | A2 (%) | χ2 | |
|---|---|---|---|---|---|---|
| Au+ NC | 282.7 | 70.3 | 80.1 | 424.5 | 19.9 | 1.0 |
| Au+/Y3+ NC | 421.3 | 115.2 | 75.8 | 604.3 | 24.2 | 1.1 |
| Au+/Yb3+ NC | 397.7 | 108.1 | 77.6 | 583.5 | 22.4 | 1.1 |
| Au+/Er3+ NC | 199.4 | 52.7 | 77.0 | 289.1 | 23.0 | 1.2 |
These nanoclusters proved to be considerably photostable in both nitrogen and oxygen atmosphere. Fig. 1d shows the negligible variation of their emission after prolonged irradiation (up to 1 h) under the fluorimeter lamp (λex = 300 nm).
X-ray photoelectron spectroscopy (XPS) can provide the binding energy (BE) of a core-level electron of an atom in the solid. This energy depends on the potential energy at that position, which in turn depends on the chemical environment of the atom. The Au 4f7/2 and 4f5/2 XPS spectra of the NCs showed two bands centred at 84.5 eV and 88.2 eV, respectively (Fig. 2a), attributed to Au+; therefore, the presence of Au(0) is, at the very most, minimal.24 In addition, the presence of both HEPES and AMP was patent in the S 2p and P 2p XPS spectra of the nanocluster (Fig. S4 in ESI†).
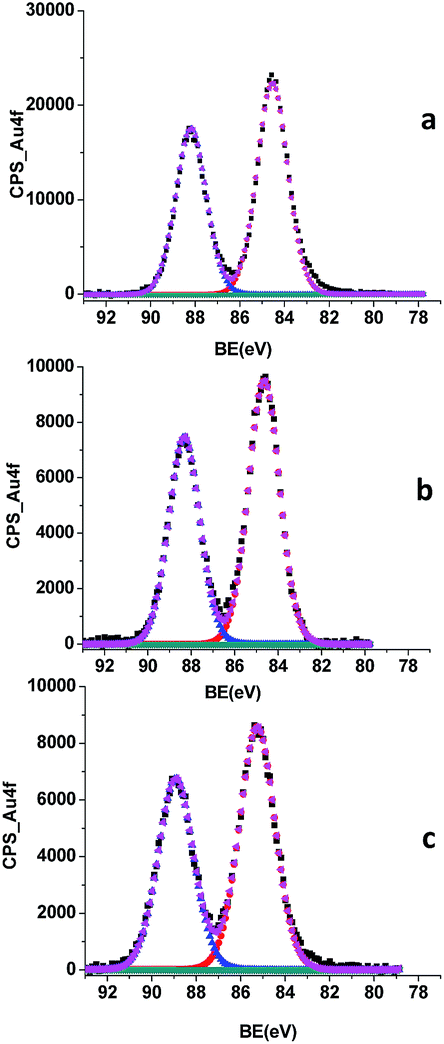 | ||
| Fig. 2 Comparison between the Au 4f XPS spectra of Au+ NCs (a), Au+/Y3+ NCs (b), and Au+/Yb3+ NCs (c). | ||
Fourier transform infrared (FTIR) spectrum of the Au+ NCs was also consistent with the presence of both AMP and HEPES. The band at 1645 cm−1, attributed to the NH2 scissoring vibrational mode of the adenine moiety, shifted to lower energy (1622 cm−1) in the NCs (Fig. S5 in ESI†).
Fig. 3 shows the comparison between the 1H NMR spectrum of the colloidal sample and that of AMP and HEPES. The most significant variation in the AMP was the up-field shift of ca. 0.1 ppm of the adenine H2. This contrasts with the considerable up-field shift of the H2 and H8 signals of the adenine moiety described for AMP-capped AuNPs with a multichelating binding of AMP to the nanoparticle surface involving the N7 and NH2 of the adenine unit.25,26 These data suggest that AMP is not anchored to the NC via the nucleobase.
 | ||
| Fig. 3 From the top to the bottom: 1H-NMR (D2O) spectra of the Au+ NCs, AMP, HEPES, and the Au+ NCs in the presence of YCl3·6H2O. | ||
On the other hand, almost all the signals of HEPES (Fig. 3 and Table S1†) underwent important down-field shifts ruling out the possibility of being free in the solution. It has previously been reported that HEPES facilitates the formation of layers via hydrogen–hydrogen interactions.27 This might be the reason for the failure to obtain the TEM image of the Au+ NCs.
Addition of lanthanides to the Au+ NCs
The absorbance of the Au+ NC water solutions was set to ca. 0.45 at 260 nm for these assays. The addition of Y3+ (9.5 μL of a 4.3 mM water solution of the ion) led to a considerable enhancement in the PL of the NCs and a similar effect was observed when adding Yb3+ (Fig. S6†). The NMR spectrum of the colloidal sample (Au+ NC plus Y3+ and Au+ NC plus Yb3+) showed negligible changes after the addition of the lanthanide ion; the most significant variation was the down-field shift of ca. 0.1 ppm of the adenine H2 (see Fig. 3 and Table S1 in ESI† for Y3+). Control assay was performed with another lanthanide, specifically Er3+. The addition of this ion caused PL quenching (spectrum not shown), thus demonstrating that the enhancement effect does not occur with all the lanthanides.Attempts were then made to induce the precipitation of the emissive species without adding any additional solvent in order to gain insight into the origin of the enhanced PL of the Au+ NCs. Addition of the Ln3+ (9.5 μL of a 4.3 mM water solution) to the Au+ NC solution, followed by maintenance of the mixture in the fridge at 8 °C in the dark for three days, and then centrifugation at 12000 rpm at 19 °C for 25 min, led to a white solid. It is worth mentioning that no precipitate was obtained under analogous conditions in the absence of Y3+ and Yb3+, thus indicating that they played a key role in the formation of the precipitate.
The absorption spectra of the precipitates showed a diminished absorbance around 260 nm compared to that of the initial colloidal solution; they only exhibited the maximum at ca. 300 nm (Fig. 4 left). Photoluminescence spectra (λex = 300 nm, Fig. 4 right) evidenced the presence of the luminescent species in the precipitates and they were termed Au+/Ln3+ NCs taking into account the XPS data (see below).
 | ||
| Fig. 4 Comparison between (left) the absorption spectra and (right) (λex = 300 nm) the precipitates obtained after addition of Y3+, or Yb3+ to the Au+ NCs. | ||
The analysis of the precipitates and the supernatants by XPS spectroscopy revealed that the lanthanide was only present in the precipitate (Tables S2–S9†). In addition, the Au 4f7/2 and 4f5/2 XPS spectra of the supernatants showed the presence of traces of Au(0), whereas those of the precipitates showed two bands slightly shifted to a higher energy than that of the Au+ NCs (0.1 eV and 0.7 eV, respectively) (Fig. 2b and c). These changes could be ascribed to a reduction of the electron density of the Au+ at the Au+ NC surface due to aurophilic interactions, specifically Au+–Ln3+ interactions.28
The binding energies of Y3+ 3d and Yb3+ 3d in the Au+/Ln3+ NCs were smaller than those of the LnCl3 (Tables S2 and S3†). Thus, the BE of the Y 3d3/2 was at 160.0 eV, whereas a value of about 161.0 eV29 has been found for YCl3. In addition, the BE of Yb 4d5/2 was at 185.9 eV, whereas that of YbCl3 has been reported at 186.6 eV.30 This is consistent with an increase in the electron density due to the above-mentioned aurophilic interaction.
In addition, the S 2p and P 2p XPS spectra of Au+/Y3+ and Au+/Yb3+ NCs and of the corresponding supernatants revealed that AMP mainly remained in the Au+/Ln3+ NCs, whereas HEPES was practically transferred to the supernatant together with the Au(0) (Au 4f7/2 and 4f5/2 bands centred at 83.6 eV and 87.3 eV); see (Tables S6–S9†).
These results are consistent with the formation of AMP-capped Au+ NCs after the reduction of the gold salt by HEPES in the presence of AMP and light exposure. The lanthanide attachment to the NCs diminished the solubility of the AMP-capped Au+ NCs, thus permitting their separation from HEPES and traces the Au(0) NCs.
Transmission electron microscopy (TEM) images of the Au+/Ln3+ NCs showed the crystallinity of the samples. The average NC sizes were measured to be 1.74 ± 0.38 nm, and 1.74 ± 0.42 nm for Au+/Y3+ and Au+/Yb3+, respectively (Fig. 5).
 | ||
| Fig. 5 HRTEM images Au+/Y3+ NCs (left) and Au+/Yb3+ NCs (right); scale bar of 2 nm. Insets: size distribution diagrams for the NCs based on the statistical analysis of TEM images. | ||
Photoluminescence properties of the Au+/Ln3+ NCs
The doped NCs exhibited a slightly red shifted PL peak (2 nm) compared to the undoped Au+ NCs (see Fig. 6). The emission peak position and shape of the Au+/Ln3+ NC PL did not exhibit dependence on the excitation wavelength (assayed wavelengths: 260, 300, and 350 nm) and the same behaviour was also observed for the initial Au+ NCs (spectra not shown). Moreover, the addition of Y3+- and Yb3+-doping led to about two-fold enhanced PL (see Fig. 6 for the Y3+-doped NC). | ||
| Fig. 6 Comparison between the emission spectrum (λex = 350 nm) of the Au+ NCs and that of Au+/Y3+ NCs at the same absorbance (0.016 at 350 nm). | ||
Time-resolved measurements were carried out to determine the effect of the Ln3+ on the luminescence lifetime of the nanocluster. Table 1 shows the average lifetime and that of the two components of the doped and undoped Au+ NCs and demonstrates that the doping increases the lifetime of both components in a similar ratio.
Conclusions
Luminescent AMP-capped Au+ NCs can be prepared by reduction of Au3+ by HEPES and light exposure in the presence of AMP. The Yb3+ and Y3+ rare earth ions anchored to the surface of the Au+ NCs, thus leading to an enhancement of about two-fold of their emission. To our knowledge, aurophilic interactions between gold and rare earth (RE) ions (Au+ → RE3+) have not previously been reported and it would be worth studying this interaction with other RE3+ ions as well as with Au+ NCs capped with other organic ligands.Acknowledgements
We thank the Spanish Ministry of Economy and Competitiveness (Project CTQ2014-27758; Maria de Maeztu: MDM-2015-0538; M. G. B. Ramón y Cajal contract), COLCIENCIAS (Colombia – Doctorado Exterior – 6171 – 2014, JPVG), and GVA (Santiago Grisolía grant to PL).Notes and references
- Y. Yu, S. Y. New, J. Xie, X. Su and Y. N. Tan, Chem. Commun., 2014, 50, 13805 RSC.
- X. Chen, J. B. Essner and G. A. Baker, Nanoscale, 2014, 6, 9594 RSC.
- (a) Y. Hu, W. Guo and H. Wei, Isr. J. Chem., 2015, 6, 682 CrossRef; (b) L. Zhang and E. Wang, Nano Today, 2014, 9, 132 CrossRef CAS.
- J. Sun, F. Yang and X. Yang, Nanoscale, 2015, 7, 16372 RSC.
- L. Chen, C. Wei Wang, Z. Yuan and H. Chang, Anal. Chem., 2015, 87, 216 CrossRef CAS PubMed.
- L. Gao and J. Rongchao, Acc. Chem. Res., 2013, 46, 1749 CrossRef PubMed.
- Y. Zhu, H. F. Qian, A. Das and R. C. Jin, Chin. J. Catal., 2011, 32, 1149 CrossRef CAS.
- C. Zhang, C. Li, Y. Liu, J. Zhang, C. Bao, S. Liang, Q. Wang, Y. Yang, H. Fu, K. Wang and D. Cui, Adv. Funct. Mater., 2015, 25, 1314 CrossRef CAS.
- J. Zheng, C. Zhang and R. M. Dickson, Phys. Rev. Lett., 2004, 93, 77402 CrossRef PubMed.
- S. L. Raut, R. Fudala, R. Rich, R. A. Kokate, R. Chib, Z. Gryczynski and I. Gryczynski, Nanoscale, 2014, 6, 2594 RSC.
- A. Lopez and J. Liu, J. Phys. Chem. C, 2013, 117, 3653 CAS.
- Z. Li, Y. Wu and W. Tseng, ACS Appl. Mater. Interfaces, 2015, 7, 23708 CAS.
- Z. Luo, X. Yuan, Y. Yu, Q. Zhang, D. T. Leong, J. Y. Lee and J. Xie, J. Am. Chem. Soc., 2012, 134, 16662 CrossRef CAS PubMed.
- X. Le Guevel, V. Trouillet, C. Spies, K. Li, T. Laaksonen, D. Auerbach, G. Jung and M. Schneider, Nanoscale, 2012, 4, 7624 RSC.
- W. Ge, Y. Zhang, J. Ye, D. Chen, F. Rehman, Q. Li, Y. Chen, H. Jiang and X. Wang, J. Nanobiotechnol., 2015, 13, 8 CrossRef PubMed.
- H. Liu, X. Zhang, X. Wu, L. Jiang, C. Burda and J.-J. Zhu, Chem. Commun., 2011, 47, 4237 RSC.
- Y. He, X. Wang, J. Zhu, S. Zhong and G. Song, Analyst, 2012, 137, 4005 RSC.
- X. Yang, L. Yang, Y. Dou and S. Zhu, J. Mater. Chem. C, 2013, 1, 6748 RSC.
- J. Ho, H. Chang and W. Su, Anal. Chem., 2012, 84, 3246 CrossRef PubMed.
- J. Xie, Y. Zheng and J. Ying, Chem. Commun., 2010, 46, 961 RSC.
- J. Xie, J. Y. Lee and D. I. C. Wang, Chem. Mater., 2007, 19, 2823 CrossRef CAS.
- G. Maiorano, L. Rizzello, M. A. Malvindi, S. S. Shankar, L. Martiradonna, A. Falqui, R. Cingolani and P. P. Pompa, Nanoscale, 2011, 3, 2227 RSC.
- It has been reported that reaction of Au(III) with 2-(N-morpholino)ethanesulfonic acid (MES) leads to AuNPs and AuNCs. Removal of the former by centrifugation provided a clear AuNC solution. These MES-capped AuNCs exhibited maximum absorption/luminescence at 420 nm/495 nm. Comparatively, the addition of HEPES to HAuCl4 in milli-Q water in the absence of AMP led to a black precipitate. L. Wintzinger, W. An, C. Turner and Y. Bao, Joshua, 2010, 7, 24 Search PubMed.
- C. Zong, L. Zheng, W. He, X. Ren, C. Jiang and L. Lu, Anal. Chem., 2014, 86, 1687 CrossRef CAS PubMed.
- N. H. Jang, Bull. Korean Chem. Soc., 2002, 12, 1790 Search PubMed.
- S. Avvakumova, P. Verderio, G. Speranza and F. Porta, J. Phys. Chem. C, 2013, 117, 3002 CAS.
- H. Liu, Y. Xu, Y. Qin, W. Sanderson, D. Crowley, C. H. Turner and Y. Bao, J. Phys. Chem. C, 2013, 117, 17143 CAS.
- It has been reported that the interaction between Au+ and Hg2+ at the surface of gold nanoclusters was responsible for the shift of the binding energy of Au+ to higher (ca. 1 eV) values. D. Tian, Z. Qian, Y. Xia and C. Zhu, Langmuir, 2012, 28, 3945 CrossRef CAS PubMed.
- P. Malacrida, H. G. Sanchez Casalongue, F. Masini, S. Kaya, P. Hernandez-Fernandez, D. Deiana, H. Ogasawara, I. E. L. Stephens, A. Nilsson and I. Chorkendorff, Phys. Chem. Chem. Phys., 2015, 17, 28121 RSC.
- Y. Uwamino, A. Tsuge, T. Ishizuka and H. Yamatera, Bull. Chem. Soc. Jpn., 1986, 59, 2263 CrossRef CAS.
Footnote |
| † Electronic supplementary information (ESI) available: Experimental details: general experimental methods, synthesis and optimization of Au@AMP/HEPES, XPS spectra of atoms and emission spectra of comparative assay with non-lanthanide. See DOI: 10.1039/c6ra01891b |
| This journal is © The Royal Society of Chemistry 2016 |