DOI:
10.1039/C6RA01790H
(Paper)
RSC Adv., 2016,
6, 26835-26855
Non-mulberry silk fibroin grafted poly(ε-caprolactone) nanofibrous scaffolds mineralized by electrodeposition: an optimal delivery system for growth factors to enhance bone regeneration†
Received
20th January 2016
, Accepted 4th March 2016
First published on 14th March 2016
Abstract
Mineralization of scaffolds enables them to mimic the chemistry of natural bone. Mineralizing nanofibrous scaffolds can successfully replicate both the architecture and chemical composition of bones and prove suitable for bone reconstruction. Non-mulberry silk fibroin (NSF) (from Antheraea mylitta) grafted poly(ε-caprolactone) (PCL) nanofibrous scaffolds (NSF-PCL) are fabricated using electrospinning, followed by aminolysis. Electrodeposition, due to its speed and simplicity is used to deposit calcium phosphate on these scaffolds at two deposition voltages: 3 V and 5 V. The deposition of nano-hydroxyapatite (nHAp) obtained is of high quality and its topology is dependent upon the voltage of electrodeposition. Along with scaffolds of nHAp deposited on a NSF-PCL matrix at 3 V and 5 V (NSF-PCL/3V and NSF-PCL/5V respectively), the unmodified NSF-PCL matrix is used as a control. The results of mechanical characterization and certain basic cell culture using the MG-63 cell line show the merits of NSF-PCL/5V over the other two compositions. The NSF-PCL/5V scaffold is then used for detailed cell culture studies after being loaded with growth factors like bone morphogenic protein-2 (rhBMP-2) and transforming growth factor beta (TGF-β) in a 1
:
1 (potency) proportion. Outcomes from these studies show a clear advantage of using a combination of the growth factors over using any one of them individually. Dual growth factor loaded matrices promote more significant expression of genes related to bone growth and better facilitate early differentiation of cells. The mineralized scaffolds thus created are mechanically suitable for bone tissue engineering and in combination with growth factors significantly enhance bioactivity, proliferation and differentiation of osteoblast-like cells. The engineered scaffolds hold the potential, with further development, to serve as an optimal alternative for bone tissue engineering.
1. Introduction
The two major components of natural bone are fibres of collagen and nano-hydroxyapatite (nHAp) crystals. Attempts to develop biomaterials that mimic this composition of bone is a major focus of current research.1 A composite of nanofibrous bio-absorbable polymers, synthetic or natural, and calcium phosphate-based minerals can provide the desired mechanical performance, biocompatibility and biodegradability.2 For the currently practiced clinical techniques, repair of large bone defects, due to trauma or disease, is still a challenge3 and the answer to this challenge may be in tissue engineering. Tissue engineering combines osteogenic cells, signalling proteins (like growth factors), and a 3-D scaffold to create an approximate replica of natural bone formation environment.4
Processing techniques like electrospinning,5,6 phase separation,1,7 and self-assembly8 have been used to create composite nanofibrous scaffolds of ceramics and polymers. The scaffolds so produced have better ability of osteogenic differentiation and bone formation, as verified by in vitro and in vivo runs, than scaffolds of just polymer or just ceramics. Electrospinning ceramic nano-particles in a polymer suspension is the most direct way to reach a composite scaffold but this process cannot ensure uniform distribution of the nano-particles inside the scaffold.9,10 The process of biomimetic mineralization relies on the growth of partially carbonated hydroxyapatite on polymer scaffolds in simulated body fluid (SBF).11,12 But this whole process may take weeks,12 during which certain polymeric scaffolds can degrade in the SBF, releasing any bio-molecules that may have been embedded in the scaffold for targeted release and delivery. Layer-by-layer (LBL) self-assembly uses polyelectrolyte media to accelerate formation of mineralized surfaces upon fibrous substrates for enhanced cytocompatibility.13 The challenges associated with LBL processing are that it needs several repetitions to get a coat of appreciable thickness. Thus, large scale and efficient production of polymer–mineral composite scaffolds remains an area of interest and challenge.14
Electrodeposition, in itself, is a fast and easily controlled process, and hence, it has been used to coat metallic substrates (like titanium, titanium alloys, stainless steel etc.) with hydroxyapatite to enhance the biocompatibility and bioactivity of the metallic implants.15,16 Little work is being carried out in the field of electrodeposition upon polymeric scaffold. A recent work using electrodeposition to produces a coat of calcium phosphate upon a nanofibrous scaffold.17
When it comes to choosing an apt bio-derived polymer for bone tissue engineering, silk – due to its strength, biocompatibility, biodegradability, remarkable permeability for oxygen and water, and nominal immune reactivity18 – becomes an obvious choice. Antheraea mylitta, the Indian tropical tasar silkworm, produces a silk fibroin (SF) variety that has the tri-peptide (Arg-Gly-Asp) integrin binding RGD sequence inherent to it, which can account for the better cell adhesion and proliferation produced by scaffolds of this SF.19,20 The current work combines SF from A. mylitta with nanofibrous matrices of poly(ε-caprolactone) (PCL). A biodegradable, aliphatic polyester, PCL has been used in multiple investigations relating to drug delivery, tissue culture, and grafting.21 In our previous work, non-mulberry silk fibroin grafted PCL nanofibrous matrix (NSF-PCL) is successfully fabricated (Scheme 1) to replicate bone ECM and these fabrications are cytocompatible and biodegradable.21
 |
| Scheme 1 The schematic representation of non-mulberry silk fibroin grafting via aminolysis on PCL nanofibrous matrix. | |
To inculcate nano HAp upon this scaffold made of NSF and PCL, we have previously attempted the alternative soaking method but this method yields unstructured, irregular deposits of HAp, difficult to modulate.22 On the other hand, electrodeposition produces a uniform network of calcium phosphate flakes on the substrate, which impacts the surface roughness in such a manner as to improve cell adhesion and proliferation.21
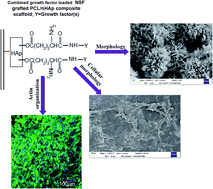
In this current study, nHAp depositions on the silk fibroin grafted PCL nanofibrous scaffolds,21 is achieved via electrodeposition. Graft polymerization, by free radical initiation, with aid of 4-methacryloyloxyethyl trimellitate anhydride (4-META) is represented in Scheme 2. 4-META has been used, without complications, with resin monomers for applications in clinical dentistry.23 To study the effect of deposition voltage, scaffolds are prepared using 3 and 5 V as deposition voltage and the NSF-PCL scaffold serves as control. Mechanical and physical properties, bioactivity and osteoblast-like cellular behaviour are tested in vitro on afore mentioned three scaffold compositions. Relying upon the results of biocompatibility and mechanical testing, nHAp deposited at 5 V on NSF-PCL scaffold is chosen for a second round of investigations. The scaffolds are now loaded with growth factors in different combination (Scheme 3). Bone morphogenic protein-2 (rhBMP-2) and transforming growth factor-beta (TGF-β) are applied independently and in combination, at concentrations close to their physiological levels. As both the above growth factors have distinct roles during natural regeneration of bone,24,25 we hypothesize that their combined delivery using a mineralized NSF-PCL scaffold will lead to significant improvements of osteogenic growth in the conducted investigations.
 |
| Scheme 2 The schematic representation of graft polymerization with 4-META onto the silk fibroin by free radical initiation and synthesis of NSF-PCL/nHAp composite by ionic interaction. | |
 |
| Scheme 3 The schematic representation of growth factor/(s) incorporation on NSF-PCL/nHAp composite by carbodiimide coupling reaction. | |
2. Materials and methods
2.1. Materials
Principal materials utilized for this work are listed here off: poly(ε-caprolactone) (PCL, mol. wt = 80
000), chloroform, glutaraldehyde, calcium nitrate, tetrahydrate [Ca(NO3)2·4H2O], ammonium dihydrogen phosphate (NH4H2PO4), pentaethylene glycol dodecyl ether (surfactant), L-glutamic acid, Thiazolyl Blue Tetrazolium Bromide (MTT) (Sigma, St. Louis, USA), 1,6-hexanediamine (TCI, Japan), 4-methacryloyloxyethyl trimellitate anhydride (4-META)monomer (Polysciences, Inc., USA); ammonium peroxodisulfate (APS, initiator), potassium hydroxide (KOH, Merck, India, ionizing reagent); cellulose dialysis tubing with cut off 12
000 and 3500 kDa (Pierce, USA); sodium dodecyl sulfate (mol. wt = 288.38) (J. T. Baker, NJ, USA); tissue culture grade polystyrene plastic flasks and plates (Tarsons, India); Dulbecco's modified eagle medium (DMEM), fetal calf serum, trypsin, EDTA, penicillin–streptomycin antibiotics (Gibco BRL, USA); polyethylene glycol (mol. wt = 6000); and alamar blue (Invitrogen, USA).
2.1.1. Silkworms. The larvae of Antheraea mylitta moths were reared at the Silk Farm of IIT Kharagpur, until they reached their late fifth instar and were about start spinning cocoons.
2.1.2. Cell lines. Human osteoblast-like cells (MG 63) were purchased from the National Centre for Cell Science (NCCS), Pune, India.
2.2. Isolation of silk protein fibroin from nonmulberry silk glands
Our previous works may be referred to for details of the procedure.21 Silk glands were taken from the dissected larvae, washed with de-ionized water to remove any traces of sericin, and the fibroin squeezed out of the glands with a pair of fine forceps. Extracted SF was dissolved in an aqueous solution of 1% w/v sodium dodecyl sulfate, 10 mM Tris (pH 8.0), and 5 mM EDTA, at room temperature. The solution was dialyzed to remove traces of surfactant. Final solution concentration was adjusted to 2 wt%.
2.3. Electrospinning (e-spinning) of PCL nanofibrous matrix and immobilization of silk protein fibroin through aminolysis
Nanofibrous matrices were fabricated using the electrospinning technique detailed in ref. 21. PCL solution was put in a 5 ml glass syringe, having a blunt tip stainless steel needle of ID 0.413 mm, controlled by a syringe pump. Syringe pump flow rate was set at 1 ml h−1 at 30 °C. Needle of the syringe linked to a 0.8 mm ID capillary, connected to the 11 kV DC supply. The copper net collector was grounded and was kept 15 cm from the capillary tube. The matrices from electrospinning were collected upon aluminum foils. When these matrices reached a thickness of 1 mm, they were stripped off the foils. Immobilization of NSF was carried out as previously described21 (for details procedure see ESI† document). The matrices were finally dried off and sterilized with ethanol before subsequent studies. Schematic representation of the aminolysis process is given in Scheme 1.
2.4. Graft polymerization with 4-META onto NSF-PCL and synthesis of NSF-PCL/nHAp composite by electrodeposition
A free radical initiation technique, aided by 4-META, was used to graft nHAp onto the NSF-PCL matrices. Methodology, as detailed in ref. 26 was followed while using NSF-PCL matrices of 1 × 1 cm2 dimension. An aqueous solution of 0.9 milli mol of 4-META monomer, 0.18 milli mol of APS, and 0.18 milli mol of the surfactant was created. Polymerization over the matrices was carried out in thick walled, 50 ml polymerization tubes and then the matrices were washed with acetone and distilled water to remove any unreacted monomers or homopolymers. Washed matrices were vacuum dried for 24 h. Weight gain of the matrices was calculated using eqn (1). |
 | (1) |
Here, Wi is initial weight of the NSF-PCL matrices and Wf is the final weight of the poly(4-META)-grafted NSF-PCL matrices, following drying. After weighing, the poly(4-META)-grafted NSF-PCL matrices were submerged for 10 min in a 0.01 M aqueous solution of KOH. This broke open and ionized the five-member ring of 4-META, that had been grafted onto the NSF-PCL matrices.
Electrodeposition of nHAp on NSF-PCL matrices (1.5 × 1.5 cm2) was carried out under potentiostatic conditions. A two-electrode system was used with a counter electrode of platinum wire (diameter 1 mm, length 37 mm) and the matrix attached onto a stainless steel (SS) sheet acted as working electrode.17 Inter-electrode distance of 2.5 cm was maintained. The electrochemical system was contained in a 250 ml electrochemical beaker which was then kept in a water-bath. The water-bath was heated to 50 °C while carrying out electrodeposition. Solution of 0.042 mol l−1 Ca(NO3)2·4H2O and 0.025 mol l−1 NH4H2PO4, with pH adjusted to 4.70, was the electrolyte. Prior to electrodeposition, the NSF-PCL matrices were immersed in alcohol for a couple of minutes to reduce hydrogen evolution at the working electrode. Electrodeposition was carried out for one hour and at two different voltages: 3 V and 5 V. Previous studies showed these two deposition voltage and time was optimum for nHAp deposition on a nanofibrous matrix.17 After the hour, NSF-PCL matrices with nHAp deposits were taken off the SS sheet and freeze dried before storage. The compositions of the different matrices thus prepared are detailed out in Table 1. Schematics of the above mentioned process has been given in Scheme 2.
Table 1 Composition details, surface roughness (Rq), tensile properties and dynamic contact angle with goniometer image (n = 3, mean ± SD) of the non-mulberry silk fibroin grafted PCL nanofibrous matrix (NSF-PCL), nHAp deposited on NSF-PCL by electrodeposition at different deposition voltage, 3 V (NSF-PCL/3V) and 5 V (NSF-PCL/5V)
Compositions |
Compositions details |
Surface roughness (Rq) (nm) |
Ultimate tensile strength (MPa) |
Elongation at break (%) |
Advancing contact angle (°) |
Receding contact angle (°) |
Mean contact angle (°) with goniometer image |
NSF-PCL |
Non-mulberry silk fibroin grafted PCL nanofibrous matrix (without nHAp coating) |
293.57 ± 0.07 |
10.62 ± 0.43 |
56.26 ± 2.81 |
37.62 |
32.42 |
 |
NSF-PCL/3V |
Deposition of nHAp on non-mulberry silk fibroin grafted PCL nanofibrous scaffold by electrodeposition (3 V) |
483.32 ± 0.13 |
15.1 ± 0.71 |
123.46 ± 5.62 |
20.48 |
13.66 |
 |
NSF-PCL/5V |
Deposition of nHAp on non-mulberry silk fibroin grafted PCL nanofibrous scaffold by electrodeposition (5 V) |
522.55 ± 0.18 |
18.14 ± 0.51 |
133.38 ± 5.91 |
13.11 |
9.07 |
 |
2.5. Morphology, crystal and chemical structure and thermo-gravimetric analysis of fabricated composite nanofibrous scaffolds
The morphology and corresponding elemental analysis (EDAX) of nHAp deposited NSF-PCL nanofibrous scaffolds, after gold coating, was observed by a field-emission scanning electron microscopy (FESEM, SUPRA 40) at accelerating voltage of 15 kV. Analysis of the FESEM images was performed with Image J® (release 1.47 for Windows). Average fiber diameter was calculated using Image J® to measure the diameters of 10 random fibers in each of 4 FESEM micrographs that were from different areas of the matrix.
X-ray diffraction (XRD) patterns of composite nanofibrous matrices were recorded on a X-ray diffractometer (PW1710, Philips, Netherlands) with CuKα radiation. The scanning range was from 10 to 70° in 2θ at a speed of 2° per min. Chemical analysis of fabricated matrices was carried out with matrices using ATR-FTIR equipment from Nexus-870, Thermo Nicolet Corporation, USA. To determine the actual content of nHAp in the composite matrices, thermogravimetric analysis (TGA) was conducted (Perkin Elmer Pyris Diamond TG-DTA thermo-gravimetric analyzer) from room temperature to 800 °C at 10 °C min−1 heating rate, in synthetic air (N2–O2 is 80
:
20).
2.6. Weight change and amount of nHAp formation after electrodeposition
Scaffolds (n = 5) of 1 × 1 cm2 dimension were deposited by nHAp by electrodeposition at 3 V and 5 V. After deposition each voltage, dry weight of the matrices was measured. Weight percent of nHAp deposition was calculated following eqn (2). |
 | (2) |
W1 is weight of the poly(4-META)modified NSF-PCL scaffold and W2 is weight of the scaffolds after nHAp deposition.
The amount of nHAp formed on the poly(4-META) modified NSF-PCL after different deposition voltage was calculate using eqn (3).
|
 | (3) |
In eqn (3), Wpost is the weight of scaffold post deposition and Wpre is the weight of the scaffold pre-deposition. The scaffold dimension was 1 cm × 1 cm × 0.1 cm.
2.7. Water uptake capacity and ion concentration in water immersion
Water up-take of the scaffolds was calculated using eqn (4). |
 | (4) |
The composite scaffolds (dry weight, Wd) of all different compositions, were immersed in 15 ml, room temperature water. Until a constant final weight was reached, weight change (wet weight, Ww) values were measured at intermediate time steps.
The composite scaffolds were soaked 20 ml of ultrapure water, at room temperature, for 1, 3, 5, 10, 20, and 30 min and 2 days. Supernatant liquid resulting after soaking was analysed using Inductive Coupled Plasma spectrometry (ICP) for measuring Ca2+ ions concentration.
2.8. Dynamic contact angle measurement
The hydrophilicity of the scaffolds was determined from advancing and receding angle of water using a goniometer (Data Physics Instruments, Filderstadt, Germany).
2.9. Atomic force microscopy (AFM)
Matrix samples of 10 × 10 μm2 area were examined using atomic force microscope (AFM; Model 5100, Agilent Technologies, USA) to determine their surface roughness. The topography was imaged using silicon cantilevers (PPPNCL, Nanosensors, Inc., USA, force constant ∼40 N m−1, resonating frequency ∼169.52 kHz) operating in intermittent contact mode. Pico Image Basic Software (Agilent Technologies) was used to perform AFM image analysis for surface roughness of the scaffolds expressed as a surface root mean square (RMS) roughness (Rq).
2.10. Characterization of mechanical properties
The matrices were cut into dumbbell shaped samples, ASTM 638-5 standard, for performing tensile tests on a universal testing machine (UTM; Instron Electroplus, E1000). The samples were 50 mm long and 10 mm wide. Tests were carried out at 25 °C temperature and 50% relative humidity with a 5 kg load-cell and 3 mm min−1 extension rate. Tests yielded stress–strain curve and ultimate tensile strength of the matrices.
2.11. Enzymatic degradation
To a phosphate buffer solution (PBS, pH 7.4), 2 μg ml−1 of Proteinase K (Tritirachium album origin; Sigma Aldrich, USA) was added and 1 × 1 cm2 sized composite scaffolds were soaked in this solution maintained at 37 °C and 100 rpm shaking. Fresh enzyme was used to replace used up solution every alternate day. Control samples were incubated in just PBS. Samples were retrieved at day points 1, 7, 14, and 21 days to weigh them and calculate the enzymatic degradation.
2.12. In vitro studies to evaluate cell proliferation capability of different composite nanofibrous matrices
2.12.1. Cell culture on the composite nanofibrous scaffolds. The cell culture medium, for the human osteoblasts like cells was made of DMEM and 10% fetal calf serum, with 1% penicillin/streptomycin added. The cultures were kept in a humidified environment of 5% CO2, at 37 °C till reaching 90% confluence. At this point, cells were trypsinized, centrifuged, and suspended back in media for counting. Scaffolds of 1 × 1 cm2 size were sterilized with 70% ethanol and UV light for 30 min. Sterilized scaffolds were washed repeatedly with sterile PBS (pH 7.4) and treated with DMEM medium for 4 h. This was done to ensure a conducive environment for the cells. Just prior to cell seeding, to ensure better penetration of cells, scaffolds were partially dried for 2 h.Fifteen micro-litres of the cell suspension in medium, containing 8 × 10⁴ cells, were added on to each nanofibrous matrix drop-by-drop. To boost cell adhesion in the initial hour after cell-seeding, the matrices were maintained in a humidified environment, at 37 °C and 5% CO2. The matrices were kept in medium for 14 days, with media being replaced every alternate day.
2.12.2. Cell viability (MTT) and proliferation (alamar blue) assay. The MTT assay was performed at different time points during cell culture to investigate cell viability on the matrices (for details procedure see ESI† document).Cell proliferation on matrices over 14 days of culture was assessed using alamar blue dye-reduction21 (for details procedure see ESI† document).
After preliminary cell culture studies, NSF-PCL/5V nanofibrous scaffold showed the most promise for cell growth and proliferation, along with better mechanical properties. Hence, NSF-PCL/5V matrix was selected for loading of growth factors and detailed in vitro studies of growth factor loaded matrices.
2.13. Preparation and in vitro studies of growth factor loaded composite scaffolds
2.13.1. Preparation of growth factors loaded composite scaffolds. Carbodiimide coupling reaction through L-glutamic acid modification was used to covalently couple TGF-β and rhBMP-2 (Sigma, St. Louis, USA) to NSF-PCL/5V.27 NSF-PCL/5V scaffolds (1 × 1 cm2) were immersed in an aqueous solution of L-glutamic acid, 1-ethyl-3-(3-dimethylaminopropyl)carbodiimide hydrochloride (EDC, 0.25 wt%), and N-hydroxysuccinimide (NHS, 0.25 wt%) (Sigma, St. Louis, USA) and gently stirred for 6 h. This step was performed to trigger the free terminal COOH group located on the surface of HAp-g. The matrices were washed twice in distilled water and loaded with 100 ng rhBMP-2, 4 ng TGF-β, or 100 ng rhBMP-2 (100 ng) + 4 ng TGF-β (4 ng) in coupling buffer for 6 h, on a shaker maintained at room temperature. After the 6 h duration, growth factor(s) incorporated scaffolds were rinsed with distilled water to eliminate impurities and freeze dried. Type of growth factors loaded in NSF-PCL/5V nanofibrous scaffold has been summarized with proper abbreviations in Table 2. Scheme 3 illustrates incorporation of growth factor(s) on NSF-PCL/5V scaffolds by carbodiimide coupling reaction.
Table 2 Type of growth factors loaded in different proportion on nHAp deposited at 5 V on non-mulberry silk fibroin grafted PCL nanofibrous matrices (NSF-PCL/5V) with proper abbreviation
Compositions |
Compositions details |
Growth factor |
Loading efficiency of growth factor (ng) |
NSF-PCL/5V |
Deposition of nHAp on non-mulberry silk fibroin grafted PCL nanofibrous scaffold by electrodeposition (5 V) |
No growth factor |
— |
T5V |
TGF-β loaded nHAp deposited non-mulberry silk fibroin grafted PCL nanofibrous matrix (5 V) |
TGF-β |
4 |
B5V |
rhBMP-2 loaded nHAp deposited non-mulberry silk fibroin grafted PCL nanofibrous matrix (5 V) |
rhBMP-2 |
100 |
T/B 5V |
TGF-β and rhBMP-2 loaded nHAp deposited non-mulberry silk fibroin grafted PCL nanofibrous matrix (5 V) |
TGF-β + rhBMP-2 |
(4 ng TGF-β + 100 ng rhBMP-2) = 104 |
2.13.2. TGF-β and rhBMP-2 loading and release kinetics of NSF-PCL/5V matrix. Dosage of 100 ng for rhBMP-2 and 4 ng for TGF-β was used to study release kinetics and loading efficacy of the growth factors. Controlled release kinetics was determined by incubating growth factor loaded nanofibrous scaffolds in PBS at 37 °C for 28 days. The media was collected at pre-fixed time points and release of rhBMP-2 and TGF-β was measured using an ELISA kit (Invitrogen, USA).
2.13.3. Cell culture on the growth factors loaded composite nanofibrous scaffolds. Maintaining of cell line and pre-treatment of different growth factor loaded matrices was as described in Section 2.12.1. Fifteen micro-litres of the cell suspension in medium, containing 2 × 10⁴ cells, was added drop-by-drop on to each nanofibrous matrix. The matrices were kept in medium for 14 days with media being replaced every alternate day.
2.13.4. Cell adhesion assay, cell viability (MTT) and proliferation (alamar blue) assay. Following one, three and six hours of cell seeding, cell adhesion on scaffolds was measured using concentration of unattached cells in the culture media as the parameter. Culture media was flushed, using a pipette, onto the culture dish, dislodging any cells that might have attached to the culture dish. This was carried out carefully, so as not to disturb the cell laden scaffolds themselves. Ten microliter of the cell suspension was transferred to a chamber of the haemocytometer to obtain unattached cell concentration. The number of unattached cells was subtracted from the density of cells initially seeded to obtain number of cells adhering to each scaffold.21Cell viability and proliferation assay on different growth factor loaded composite nanofibrous scaffold were performed as described in Section 2.12.2.
2.13.5. Total protein analysis. A bicinchoninic acid (BCA) assay kit (Thermo Fisher Scientific) was used to analyse total protein content. Proteinase inhibitor of phenylmethyl sulfonyl fluoride (PMSF, 1 mM) was added to prevent degradation of protein (for details procedure see ESI† document).
2.13.6. Gene expression by real-time RT-PCR. MG-63 cultured on different growth factors loaded composite scaffolds for 14 days were transferred to 2 ml plastic tubes containing 1.5 ml Trizol solution (Invitrogen, USA) and incubated for 15 min. The tubes were centrifuged at 12
000g, 4 °C, for 10 min. Supernatant from the centrifugation was taken in a fresh tube with 200 ml chloroform and incubated for 5 min at room temperature. This solution was stirred gently for about 15 s and incubated for 15 more minutes before being centrifuged at 12
000g and 4 °C. The supernatant was put in the RNeasy Plus mini-spin column (Qiagen, Germany). Washing and elution of RNA was carried as per manufacturer protocol. High capacity cDNA reverse transcription kit (Applied Biosystems, USA) was used for reverse transcribing of RNA to cDNA.Conditions for the real time PCR (RTPCR) were optimized. RTPCR was performed with SYBR Green (Applied Biosystems, USA) using the ABI Prism® 7000 Sequence Detection System (Applied Biosystems, USA). A reaction volume of 50 μl was reached and it contained SYBR Green supermix, 5 pmol ml−1 of forward and reverse primers, and 5 μl cDNA template. Plate loading was done through a RT loading platform. Cycling conditions used were: denaturation step (8 min 45 s, 95 °C), 45 cycles (30 s each at 95 °C, 58 °C, and 72 °C). Data was collected at the 72 °C phase in each cycle. Applied Biosystems' Relative Quantification software was used to calculate the values of CT (threshold cycle).
Gene specific primers, of high purity, were designed based on previous reports (Table 3) and synthesized commercially (MWG-Biotech AG Ltd, India)28–30 for the following: alkaline phosphatase (ALP), osteopontin (OPN), osteonectin, collagen I, osteocalcin (OCN), Runx2, bone sialoprotein (BSP) and housekeeping gene GAPDH were designed based on previous reports (Table 3) and synthesized commercially (MWG-Biotech AG Ltd, India).28–30 Ct value of the housekeeping GAPDH gene (2−ΔΔCt formula, Perkin Elmer User Bulletin s≠ 2) was used to normalize and find the relative expression level of each target gene.
Table 3 RT-PCR primer sequences (forward and reverse) used in the current gene expression study
Genes |
Forward primer |
Reverse primer |
Ref. |
Runx2 |
5′-GCTTCTCCAACCCACGAATG-3′ |
5′-GAACTGATAGGACGCTGACGA-3′ |
28 |
OCN |
5′-AAAGCCCAGCGACTCT-3′ |
5′-CTAAACGGTGGTGCCATAGAT-3′ |
28 |
Osteonectin |
5′-ACAAGCTCCACCTGGACTACA-3′ |
5′-TCTTCTTCACACGCAGTTT-3′ |
28 |
OPN |
5′-GACGGCCGAGGTGATAGCTT-3′ |
5′-CATGGCTGGTCTTCCCGTTGC-3 |
28 |
ALP |
5′-TCAGAAGCTCAACACCAACG-3′ |
5′-TTGTACGTCTTGGAGAGGGC-3′ |
29 |
BSP |
5′-CAGGGAGGCAGTGACTCTTC-3′ |
5′-AGTGTGGAAAGTGTGGCGTT-3′ |
30 |
COL I |
5′-TCCTGCCGATGTCGCTATC-3′ |
5′-CAAGTTCCGGTGTGACTCGTG-3′ |
28 |
GAPDH |
5′-AGGTCGGTGTGAACGGATTTG-3′ |
5′-TGTAGACCATGTAGTTGAGGTCA-3′ |
30 |
2.13.7. Cell viability, live/dead assay. Live/dead assay was performed as per the kit manufacturer's protocol (Molecular Probes, USA) (for details procedure see ESI† document).
2.13.8. Morphology and distribution of cells within the scaffolds. Laser confocal and SEM images were used to examine cell morphology and dispersion over the scaffolds. Cells were fixed onto the scaffolds using one hour treatment with 4% paraformaldehyde. Scaffolds to be examined by SEM were then dehydrated with ethanol gradients (50 to 100% v/v H2O, increasing in steps of 10% v/v), 20 min placement in each gradient. At the end, scaffolds were briefly exposed to isoamyl acetate and vacuum dried. The dried samples were sputtered with gold and FESEM was carried out at 15 kV (FESEM, SUPRA 40).For confocal laser microscopy, scaffolds with 7 days of culture were fixed using 4% paraformaldehyde and blocked with 1% bovine serum albumin (BSA) for an hour. The cells were then permeabilized over 5 min by use of 0.1% Triton X-100, prepared in BSA. Staining of actin filaments used Alexa Fluor® 488 and the nuclei with Hoechst 33342. The confocal laser microscopy was performed on Olympus FV 1000 (Olympus, Japan) and post-processing was carried out with Olympus FV 1000 Advanced software version 4.1 (Olympus, Japan).
2.13.9. DNA analysis. Cell numbers on the cultured scaffolds was determined using quantitative DNA assays. The numerical values thus determined were used for analysing cell seeding efficiency and cell growth on the scaffolds. Genomic DNA Purification kit from Thermo Fisher Scientific was used to isolate DNA. Seeded scaffolds were washed twice in PBS, placed in a 1.5 ml tube and crushed with a homogenizer. DNA isolation was undertaken as per manufacturer's protocol provided in the kit. Absorbance at 260 nm was measured in a microplate reader. Cell numbers were calculated using the absorbance values against a DNA standard curve of identical cells.
2.13.10. Alkaline phosphatase assay (ALP). Protocol given by Kim et al.31 was used to spectrophotometrically measure the alkaline phosphatase produced by the cultured MG-63. At intermediate day points, cell laden constructs were washed with PBS (pH 7.4) and homogenized with 1 ml Tris buffer (1 M, pH 8.0). Suspension was formed by sonication on ice for 4 min and 20 μl suspension was incubated with 1 ml of 16 mM solution of p-nitrophenyl phosphate (Sigma) for 5 min, at 30 °C. To measure p-nitrophenol produced in presence of ALP, absorbance at wavelength of 405 nm was determined. ALP activity was reported as: μmole per min per 104 cells, i.e., p-nitrophenol produced normalized by incubation duration and cell count.
2.13.11. Mineralization assay by ARS staining. Alizarin Red-S (ARS) binds selectively with salts of calcium. So, ARS staining was used to detect and quantify mineralization produced on the scaffolds. Cell laden scaffolds were washed in PBS and fixed for an hour in 70% ethanol at 0 °C. After further washing with distilled water, scaffolds were stained over 20 minutes in 40 mM ARS, at room temperature. Stained constructs were repeatedly washed using distilled water to remove any trace remains. The constructs were then observed with an optical microscope. Stain was later desorbed using 10% cetylpyridinium chloride, over one hour. Desorbed dye was collected to read absorbance values at 540 nm in a microplate reader.
2.13.12. Calcium assay. Calcium deposits on cell laden scaffolds were quantified the method reported in ref. 31 (for details procedure see ESI† document).
2.14. Statistical analysis
Unless otherwise specified, data has been presented as mean ± standard deviation (SD) with sample size (n) of 3. One way ANOVA was used to compare the results obtained for different scaffold compositions followed by post-hoc Tukey's HSD test. Significant differences are categorized as: ***p < 0.001; **p < 0.01; *p < 0.05. All statistical analysis was conducted in the R statistical environment.
3. Results
3.1. Weight gain of scaffolds after graft polymerization
Weight gain from poly(4-META) increased with reaction time and plateaued at about 19.47 wt% [show as ESI data, (Fig. S1†)]. It is theorized that the graft polymerization has a low efficiency and is hindered from going beyond a certain value due to the steric hindrance between 4-META side chains and those of the silk substrate.23 The graft-polymerization reaction using 4-META has the ability to be well controlled, and we use the 4-META-grafted NSF-PCL of 18.91 wt% gain in all further investigations.
3.2. Morphology analysis by FESEM
As evidenced from the FESEM analysis, morphology of the NSF grafted PCL (NSF-PCL) nanofibrous scaffold was uniform, with beadles, smooth nanofibers [Fig. 1(a) and (b)]. The architecture was random and nonwoven along with interconnected pores. In other words, they were a near replica of the ECM of bone. Average fiber diameter was estimated at 455 ± 12 nm. This scaffold was successfully mineralized with nHAp by electrodeposition method. Images for HAp deposited onto nanofibrous scaffolds at 3 V (NSF-PCL/3V) and 50 °C, over 60 min are presented in Fig. 1(c) and (d). The structures are formed uniformly over the entire surface, are dense and lamellar, with random alignment and may be described as being flower-like. These lamellar structures combine to from a final flake-like, dense network. The image at higher magnification [Fig. 2(d)] indicated that individual lamella had a diameter of about 730 nm. With an increase in deposition voltage, while other conditions remained the same, more abundant, nano sized needle-like deposits of highly porous calcium phosphate formed on the surface of nanofibrous matrix (NSF-PCL/5V) [Fig. 1(e) and (f)]. Due to the dense deposit, diameter of individual needle-like structures could not be calculated. The EDS spectra of the material deposited on surface of scaffolds suggests that it was calcium phosphate (Fig. 1), with calcium to phosphorous ratio of about 1.67 – matching the expected stoichiometry of HAp, Ca10(PO4)6(OH)2. Thus, it may be unequivocally said that the scaffolds were covered with a dense layer of nHAp mineralized on their surfaces.
 |
| Fig. 1 Field-emission scanning electron micrographs and corresponding EDAX analysis of the different nHAp deposited composite nanofibrous scaffolds (NSF-PCL, NSF-PCL/3V, and NSF-PCL/5V) by electrodeposition method. About all composition Ca/P about 1.6 which is almost equal to biological hydroxyapatite (Ca/P = 1.67). | |
 |
| Fig. 2 (a) X-ray diffraction patterns of NSF-PCL, NSF-PCL/3V and NSF-PCL/5V composite nanofibrous matrices indicated that after deposition of nHAp, the crystalline characteristics of the constitutive components, HAp, PCL and NSF still existed. (b) ATR-FTIR spectra of NSF-PCL, NSF-PCL/3V and NSF-PCL/5V composite nanofibrous matrices. The nHAp deposited composite nanofibrous matrices reveal peaks of PCL, NSF and HAp without any major alterations. | |
3.3. X-ray diffraction analysis
Deposit crystallinity was analysed with X-ray diffraction measurement [Fig. 2(a)]. The NSF-PCL membrane prepared from silk fibroin and PCL, showed major two very intensive and sharp peaks specific for PCL at 2θ = 21.5° and 23.8° [Fig. 2(a)], which can be assigned to (1 1 0) and (2 0 0) planes of PCL.32 Among silk fibroin specific peaks, the crystalline peak at 2θ = 17° confirmed β-sheet structure after ethanol treatment.33 After electrodeposition, crystalline peaks still confirmed characteristics from all the constituents, i.e., HAp, PCL and NSF. Weakened PCL peaks were there along with characteristic peaks assignable to crystalline structure of HAp at 2θ = 26°, 31.8° (JCPDS # 09-0432).34 With the increased deposition voltage, NSF-PCL/5V composite matrix showed more intense and sharper HAp peaks. This also supported the conclusion that deposition increased with the voltage.
3.4. ATR-FTIR spectroscopy analysis
ATR-FTIR spectroscopy of different nHAp deposited nanofibrous scaffolds were presented in Fig. 2(b). Of the major vibration peaks detected, following strongest bands associated with PCL were identified: 1726 cm−1 corresponding to C
O and C–O groups in PCL along with three peaks at 1367, 2864, and 2940 cm−1, assignable to C–H in PCL.35 For NSF, three vibration peaks were distinguished: 1650–1630 cm−1 for amide I (C
O stretching), 1540–1520 cm−1 for amide-II (secondary NH bending, due to β-sheet structure), and 1270–1230 cm−1 for amide III (C–N and N–H functionalities)33 [Fig. 2(b)]. Absorption peaks at ∼1535 cm−1 and ∼1648 cm−1 corresponded to β-sheet structure (amide II). There were additional peaks around 1023 cm−1, corresponding to P–O stretching of phosphate group. Peaks around 560 and 600 cm−1 could be ascribed to P–O bending and the peak at 3384 cm−1 to O–H stretching.36 These results further support HAp being formed on the NSF-PCL nanofibrous surface. Intensity of these absorbance bands was greater for structures created with a deposition voltage of 5 V than those created at 3 V.
3.5. Thermal analysis
Thermal properties of composite scaffolds were analysed with TGA. For the NSF-PCL nanofibrous matrix, weight loss started from 321 °C till reaching 100% at 545 °C – Fig. 3(a). For NSF-PCL/nHAp nanofibrous scaffolds, the temperature of weight loss initiation decreased as nHAp amount on the scaffolds increased. Amounts of nHAp in nanofibrous scaffolds, calculated from the residual weight after complete thermal decomposition of scaffolds, were nearly equal to those calculated from the percentage of weight of nHAp deposited after different deposition voltage, which were 49.69% (for NSF-PCL/3V) and 66.04% (for NSF-PCL/5V), respectively. The peak temperatures at which highest rate of weight loss occurred also decreased with the nHAp concentration, i.e., at temperature points of 391 °C, 342 °C and 331 °C for NSF-PCL, NSF-PCL/3V and NSF-PCL/5V nanofibrous scaffolds respectively, Fig. 3(b). This implied that increasing HAp content reduced thermal stability of NSF-PCL.
 |
| Fig. 3 TGA analysis in term of (a) % of weight and (b) % of weight derivatives of NSF-PCL, NSF-PCL/3V and NSF-PCL/5V composite nanofibrous matrices. (c) Increase in percentage deposition of nHAp significantly (*p < 0.05) on the poly(4-META) modified NSF-PCL matrix after different deposition voltage at 50 °C for 1 h. (d) Effects of deposition voltage on the amount of nHAp formed on poly(4-META) modified NSF-PCL matrix. | |
3.6. Increase of weight and amount of nHAp formation on nanofibrous scaffolds
The weight percentage of nHAp deposition on the NSF-PCL scaffold was found to increase with different deposition voltages at 50 °C for 60 min [Fig. 3(c)]. About 49.8 ± 0.08% (w/w) of nHAp was deposited on the NSF-PCL scaffold at 3 V and 66.1 ± 0.03% (w/w) at 5 V. The amount deposited was observed to be dependent on the deposition voltages through weight analysis. More importantly, deposition voltage also affected the deposit's topography. Fig. 3(d) presented the effects of deposition voltage on the formation of nHAp on NSF-PCL nanofibrous scaffolds. The amount of nHAp gradually increased as a function of deposition voltage. About 95.86 mg cm−3 and 127.87 mg cm−3 of nHAp were formed at 3 V and 5 V respectively. These results gave direct evidence for HAp formation amount strongly depending on deposition voltage.
3.7. Water uptake property
The water uptake capacity of the composite scaffolds with different deposition voltage showed in Fig. S2(a) [ESI† data]. Except for the case of the control (NSF-PCL), water uptake reached to the equilibrium within 3 h for both NSF-PCL/3V and NSF-PCL/5V scaffolds. This may be explained by the fact that greater nHAp deposition resulted in the higher water uptake within lesser time, thus showing that mineralization with nHAp can be used to modulate hydrophilic nature of the scaffolds. Hydrophilicity is an important aspect for the application of scaffolds in tissue engineering.
3.8. Calcium ion elution from composite nanofibrous scaffolds in water
Calcium ion elution from the composite scaffolds in ultrapure water, with respect to time and for the different deposition voltage showed as Fig. S2(b) [given as ESI† data]. ICP measurements were used to analyse calcium ion concentration in the supernatant liquid. Calcium ion leaching from the scaffolds started as soon as they were immersed and reached a plateau. The calcium ions were probably stably bonded through ionic interaction to the β-sheet structure, which is why elution was not too rapid.37
3.9. Surface topography and surface roughness of scaffolds
Cell adhesion and proliferation can be significantly affected by surface topology of scaffolds. Surface topology of the nHAp deposited nanofibrous scaffolds were characterized by AFM [Fig. 4(a–d)]. AFM images clearly showed that mineralization altered the surface topography. Spiky ridges and granular structures were observed on different composite nanofibrous scaffolds. This may be attributed to the SF in the scaffold which leads to efficient nucleation of nHAp. The surface RMS roughness (Rq) was determined by processing AFM images with Pico Image® software and the values for different matrices are given in Table 1. NSF-PCL/5V (522.55 nm) showed maximum surface roughness followed by NSF-PCL/3V (483.32 nm) and the difference was statistically significant (p < 0.01). The enhanced surface roughness is likely to have provided more surface for cell adhesion. This could have also improved surface area availability for medium and serum proteins. This can lead to the better cellular growth as compared with matrices of less surface irregularity.38
 |
| Fig. 4 The AFM pictographs of composite nanofibrous matrices (NSF-PCL, NSF-PCL/3V and NSF-PCL/5V) show the surface topography (10 μ s× 10 μm scan area). Surface roughness (Rq) was calculated from AFM images using Pico Image Basic Software and presented in Table 1. | |
3.10. Wettability of the scaffolds
Hydrophilicity has an important effect on cytocompatibility of scaffolds. The contact angles of different nanofibrous scaffolds were measured (Table 1). The results showed that NSF-PCL could be rendered significantly less hydrophobic by increasing the amount of nHAp-deposition. This result was concordant with Lee et al.’s results39 where the adding HAp made the surface of poly(lactide-co-glycolide) more hydrophilic. But, since nucleation of minerals could occur at a sub-microscopic level of the surface, NSF could enhance HAp mineralization without impacting wettability.
3.11. Tensile properties
Fig. 5(a) shows stress–strain curves of the composite nanofibrous scaffolds. These scaffolds behaved similar to ductile materials when subjected to tensile stress. The scaffolds obeyed Hooke's law initially, i.e. strain values less than 10%. But as strain increased, the curves deviated from their linear nature. Scaffold mechanical properties have been listed in Table 1. HAp addition increased tensile modulus and strain at break of the composite nanofibrous matrices significantly (p < 0.01). The NSF-PCL/5V scaffold showed the greatest mechanical strength.
 |
| Fig. 5 (a) Stress–strain curves of NSF-PCL, NSF-PCL/3V and NSF-PCL/5V composite nanofibrous matrices. A substantial difference in tensile stress (MPa) observed between different nanofibrous matrices; (b) controlled release kinetics of rhBMP-2 and TGF-β from NSF-PCL/5V nanofibrous matrices. A burst release over the first 3 days for both growth factors was observed. However, only 20.02% of the rhBMP-2 and 20.93% of the TGF-β was released from the composite nanofibrous scaffolds. | |
3.12. Enzymatic degradation of the scaffolds
Treatment with enzymes over 21 days lead to 45.23% loss of dry weight for NSF-PCL, 59.54% for NSF-PCL/3V and 65% for NSF-PCL/5V nanofibrous scaffolds [Fig. S2(c), given as ESI† data]. When submerged in the control PBS solution (pH 7.4), none of the matrices had any notable weight loss [show as ESI data, Fig. S2(d)†], similar to the findings of Li et al.40
3.13. Cell culture
3.13.1. Viability and proliferation assay of the cells on different composite nanofibrous scaffolds. Initially (up to day 5) there was no significant difference in cell viability and proliferation [show at ESI data, Fig. S3(a) and (d)†] between different nHAp deposited nanofibrous scaffolds. Day 14 results of viability (MTT assay) [show at ESI data, Fig. S3(a)†] and cell proliferation (alamar blue assay) [show at ESI data, Fig. S3(b)†] were higher for NSF-PCL/5V nanofibrous scaffolds than NSF-PCL/3V and NSF-PCL scaffolds. Compared with their values from days 1, 5 and 9, both metabolic activity and cell proliferation had risen by day 14.From physical characterization and preliminary cell culture studies, indicated that NSF-PCL/5V scaffold was better than NSF-PCL/3V and NSF-PCL scaffolds. For further detail in vitro examination with growth factor loading, finally NSF-PCL/5V scaffold was selected. Composition details of the different growth factor loaded NSF-PCL/5V scaffolds are presented in Table 2.
3.13.2. rhBMP-2 and TGF-β loading and release kinetics. Hundred nanograms rhBMP-2 and four nanograms TGF-β respectively were loaded onto different NSF-PCL/5V nanofibrous scaffolds via carbodiimide coupling reaction. Controlled release kinetics for rhBMP-2 and TGF-β loaded NSF-PCL/5V nanofibrous scaffolds in PBS, over 28 days appears in Fig. 5(b) and cumulative release of growth factors, normalized to maximum release was calculated. There was a burst release over the first 3 days for both 20.02% of the rhBMP-2 and 20.93% of the TGF-β were released from the NSF-PCL/5V nanofibrous scaffolds.
3.13.3. Cellular adhesion on scaffolds. MG 63 cells more promptly attached onto growth factor loaded nanofibrous scaffolds than control (NSF-PCL/5V) [Fig. 6(a)]. There was no significant difference of cell adhesion between different growth factor loaded nanofibrous scaffolds. Within the first hour, 66.54, 88.32, 89.91 and 91.15 percentages of cells had attached onto NSF-PCL/5V, T5V, B5V and T/B 5V scaffolds respectively. These values increased to 89.93, 96.65, 97.21 and 98.89 over the next five hours. Thus, the results showed that growth factor loading could have enhanced the expression of fibronectin and of specific integrin receptor subunits,41 leading to better cellular adhesion.42
 |
| Fig. 6 The response of osteoblast like cells (MG-63) seeded on different growth factors loaded nanofibrous matrices and cultured for 14 days at 37 °C and 5% CO2 humidified atmosphere. (a) Initial cell attachment efficiency on different growth factors loaded nanofibers measured up to 6 h by counting the cells from suspension at each time point. NSF-PCL/5V (without growth factor) served as control. (b) Viability (c) proliferation of cells and (d) the changes in content of the total protein of MG-63 cultured on different growth factors loaded nanofibrous matrices at various time points, indicating superior cell response on the dual growth factor loaded composite nanofibrous matrices (T/B 5V) compare to single growth factor loaded matrices (T5V and B5V) and control (NSF-PCL/5V). ***p < 0.001, **p < 0.01 and *p < 0.05, n = 3 at each time point (one way ANOVA followed by Tukey's Honest significant difference test). | |
3.13.4. Viability and proliferation assay of the cells. Day 14 results of viability (MTT assay) [Fig. 6(b)] and cell proliferation (alamar blue assay) [Fig. 6(c)] were higher for dual growth factor loaded (T/B 5V) scaffolds as compared to single growth factor loaded scaffolds (T5V and B5V) and the control sample. Up to day point 5, cellular viability and proliferation between two single growth factor loaded scaffolds (T5V and B5V) did not differ significantly [Fig. 6(b) and (c)]. Compared with their values from days 1, 5 and 9, both viability and cellular proliferation had increased by day 14 for all compositions. This confirmed that the selected scaffolds had not cytotoxic nature.
3.13.5. Total protein analysis. The changes in content of the total protein were shown in Fig. 6(d). At day point 1, there was no significant difference for the total protein between different growth factor loaded scaffolds (T5V, B5V and T/B 5V). For day points 5, 9, and 14, total protein content of T/B 5V was significantly more than that of the single growth factor loaded scaffolds (T5V and B5V). Protein content of all scaffolds increases from day point 1 to day points 5, 9 and 14.
3.13.6. Gene expression of MG63 on composite nanofibrous scaffolds. For investigating the osteogenic potential of different nanofibrous scaffolds, the mRNA expression of representative bone-associated genes, such as alkaline phosphatase (ALP), osteopontin (OPN), osteonectin, collagen I, osteocalcin (OCN), Runx2 and bone sialoprotein (BSP) was measured by real-time RT-PCR. Fig. 7 compared the gene expression of cells on the different growth factor loaded scaffolds after 14 days of culture. Dual growth factor loading led to all concerned genes being expressed at a significantly higher level and without growth factor (NSF-PCL/5V) loaded matrices. For Runx2, osteonectin, and ALP B5V showed significantly higher gene expression than T5V. However, for OCN, OPN, Col I, BSP there was no significant difference in gene expression between T5V and B5V after 2 weeks of osteogenic. All values had to be normalized against the housekeeping gene (GAPDH). All growth factor loaded groups (T5V, B5V, T/B 5V) showed significantly higher level of gene expression control (NSF-PCL/5V).
 |
| Fig. 7 Levels of mRNA for osteogenic specific genes (ALP, OCN, OPN, COLI, osteonectin, BSP, and Runx2) of MG-63 cultured on NSF-PCL/5V, T5V, B5V and T/B 5V for 2 weeks. The mRNA levels were quantified using real-time RT-PCR and are normalized to that of the reference gene GAPDH. All genes were expressed significantly higher on the dual growth factor loaded composite nanofibrous matrices (T/B 5V) than on single growth factor loaded matrices (T5V and B5V) and control (NSF-PCL/5V). ***p < 0.001, **p < 0.01 and *p < 0.05, data are presented as mean ± SD, n = 3. | |
3.13.7. Live/dead assay. Viability and growth of cells on different nanofibrous matrices were examined using live/dead staining (Fig. 8). From the distribution of green stained cells in confocal images taken on day 5, T/B 5V and B5V appeared to have the most viable cells, followed by T5V and control.
 |
| Fig. 8 The viability of MG-63 on different growth factors loaded nanofibrous matrices (NSF-PCL/5V, T5V, B5V and T/B 5V) using live/dead assay (live cells appear as green and dead cells as red) with confocal microscopy on day 5. High viability was maintained for dual growth factor loaded matrix (T/B 5V) followed by rhBMP-2 (B5V) and TGF-β loaded (T5V) matrices. Magnification = 20×. Scale bar = 100 μm. | |
3.13.8. Observations of cytoskeleton organization under confocal microscope. Organization of cell cytoskeleton is important for cell attachment and morphology. The actin filaments on constructs were stained using Alexa Fluor® 488 (green), nuclei were stained with Hoechst 33342 (blue), and the constructs were examined under confocal microscope (Fig. 9). The 3D constructs were Z-scanned during confocal microscopy to examine cell growth upon different layers. Scans across multiple layers were then merged into the final image given. Images showed more extensive and uniformly distributed actin filaments on growth factors loaded matrices than control. Maximum number of cells was seen on T/B 5V, followed by T5V and B5V (Fig. 9). In the control sample cell numbers were minimal and actin distribution was sparse and isolated to just around the cell nuclei.
 |
| Fig. 9 The cytoskeletal actin organization and distribution of MG-63 cells grown on different growth factors loaded nanofibrous constructs (NSF-PCL/5V, T5V, B5V and T/B 5V) at day-point 7. The confocal images were taken after staining the actin filaments with Alexa Fluor® 488 (green) and counterstaining with Hoechst 33342 (blue) for nuclei. Better actin organization, cell–cell contiguity, and larger cell numbers were observed in dual growth factor loaded matrix (T/B 5V) compared to single growth factor loaded matrices (T5V and B5V). Magnification = 20×. Scale bar = 100 μm. | |
3.13.9. Cell morphology within the scaffold constructs by SEM. The cells control (NSF-PCL/5V) had round to oval forms and had no characteristic orientation [Fig. 10(a) and (b)]. On T5V and B5V, the cells had spindle like structure and filopodia-like/filament-like appendages extending from them, along with large neo-matrix depositions [Fig. 10(c)–(f)]. On the dual growth factor loaded constructs though, most cells showed a nearly flat form and were integrated well with each other, occupying almost the entire examined area [Fig. 10(g) and (h)]. Abundant cell secreted neo-matrix deposition was observed mainly on the T/B 5V scaffolds with the deposits being extensive enough to make the underlying fibrous structure indiscernible [Fig. 10(g) and (h)]. While the nanofibrous structure and randomness in arrangement could provide topological cues for cellular adhesion,43 the integrin binding motif of silk fibroin and nHAp implemented on the nanofiber could have contributed in improving the subsequent cellular processes.
 |
| Fig. 10 Scanning electron micrographs of the osteoblast-like cells (MG-63) seeded on the different growth factors loaded nanofibrous matrices (NSF-PCL/5V, T5V, B5V and T/B 5V) after 14 days of culture. The cells formed continuous multilayer sheets on (g, h) dual (T/B 5V) and (c–f) single growth factor loaded matrices (T5V and B5V) with large amount of neo-matrix deposition compared to a few isolated cells on the (a, b) without growth factor loaded (NSF-PCL/5V) matrix. Scale bar = 10 μm. Magnification = 1k× (a, c, e, g) and 3.5k× (b, d, f, h). | |
3.13.10. DNA analysis. The percentage increase of cell density after 2 weeks of culture was calculated from DNA analysis [Fig. 11(a)]. The average cell density of T/B 5V scaffolds was 3.87 × 10⁴ cells per scaffold after two weeks in culture. That of scaffolds T5V and B5V scaffolds was 3.45 × 10⁴ and 3.66 × 10⁴ cells per scaffold respectively. These numbers corresponded to 96.4% (T/B 5V), 88.45% (B5V), and 78.92% (T5V) increase in cell density from initial attachment of cells at day 1. The increase of cell density is only 67.4% for control (NSF-PCL/5V).
 |
| Fig. 11 (a) Cell count through DNA analysis (b) alkaline phosphatase (ALP) activity (c) quantification of mineral deposition using ARS staining and (d) calcium deposition of osteoblast-like cells (MG-63) seeded on different growth factors loaded nanofibrous matrices (NSF-PCL/5V, T5V, B5V and T/B 5V) after 14 days of cell culture. ALP activity was reported as p-nitrophenol produced, normalized by incubation duration and cell count: μmole per min per 104 cells. ALP activity of all the constructs increased with time, the highest activity observed on dual growth factor loaded (T/B 5V) constructs. Both mineral deposition (Ca2+) studies (c & d) provided same trend and highest calcium deposition was observed for dual growth factor loaded matrix (T/B 5V) followed by single growth factor loaded matrices (T5V, B5V). ***p < 0.001; **p < 0.01; *p < 0.05, n = 3 at each time point (one way ANOVA followed by Tukey's Honest significant difference test). | |
3.13.11. Alkaline phosphatase (ALP) assay. Being an established marker of osteogenic differentiation, ALP was analysed during cell culture. The activity was presented [Fig. 11(b)] as the value of p-nitrophenol produced, normalized with respect to the cell density [Fig. 11(a)]. The T/B 5V constructs showed maximum ALP activity, followed by B5V and T5V constructs. These findings affirm the ability of growth factor loaded matrices to bolster differentiation of osteogenic cells.
3.13.12. Quantification assay of mineral deposition (ARS staining). Mineral deposits, as quantified using Alizarin Red-S (ARS) staining, were discernible on all matrices by day 9 [Fig. 11(c)]. The deposit amounts grew to day 14. The T/B 5V scaffolds contained significantly greater calcium deposits (p < 0.05) than T5V or B5V. These results were similar to those obtained for cell proliferation. B5V, in turn, showed significantly higher calcium content (p < 0.05) compared to T5V. Higher mineral deposit quantities point to a higher degree of differentiation among the cells. Thus, it would be natural to expect enhanced bone formation ability scaffolds with dual growth factor loading.
3.13.13. Mineralization by calcium assay. Further mineralization was confirmed by calcium deposition assay [Fig. 11(d)]. Both ARS staining [Fig. 11(c)] and calcium assay [Fig. 11(d)] gave the same trend of depositions being significantly higher (p < 0.05) on the T/B 5V scaffolds than on the B5V or T5V scaffolds during the culture duration. Deposition on all composite scaffolds increased over the culture period. Calcium deposition on the control matrices was significantly lower than the growth factors loaded matrices.
4. Discussion
Inculcation of calcium-phosphate into nanofibrous scaffolds broadens the scope of bone tissue engineering scaffolds as they now mimic both structure and composition of native bone ECM. This study attempted to do something similar. Silk fibroin grafted PCL nanofibrous matrix (NSF-PCL) is fabricated using aminolysis (Scheme 1). NSF-PCL matrix is modified by graft polymerization with 4-META and HAp nanoparticles are deposited on them using electrodeposition at two separate potentials (3 V and 5 V). The nHAp deposition relies on the strong affinity between HAp and 4-META to prompt an ionic interaction23 (Scheme 2). a-plane of HAp has Ca2+ ions on its surface.23 After ring opening, triggered by the aqueous solution of KOH, the NSF-PCL matrices have carboxylate groups on their surface. The a-plane of HAp particles gets absorbed on to this surface having carboxylate groups. Later, washing with distilled water removes the K+ ions and the COO− establishes ionic bonds with the Ca2+ ions from HAp particles. Electrochemical reactions on the cathode surface increase local pH levels to an extent where the cathode vicinity gets super-saturated with calcium phosphate, thus triggering deposit of the calcium phosphate. The NSF-PCL matrices, having been attached to the cathode, act as the substrate for this deposition process. As the nanofibrous matrix itself is mostly porous, positively charged ions can still pass unhindered to the cathode. The electrical current density is higher on the scaffold outer surface,44 making it easier for calcium phosphate to be deposited on the outer surface. Local concentrations of alkaline environment may partially hydrolyze PCL during start of electrodeposition and activate carboxyl groups on the substrate.17 These activated sites are favourable for nucleation of calcium phosphate.45 The state of super saturation maintained dur to the applied voltage leads to rapid crystallization and hence larger crystals of calcium phosphate.
Adjusting deposition voltage could influence the surface morphology of NSF-PCL matrices. Literature reveals that a low deposition potential of 2 V leads to lower super saturation during the process and thus large crystals of deposits, spread wide apart.17 Raising to 3 V increases the degree of super saturation, leading to more uniform and compact deposits. At 5 V, some hydrogen bubbling is initiated at the cathode and this can lead to forming a porous HAp deposit. EDAX results confirm that the electrodeposited minerals (3 V and 5 V, at 50 °C for 1 h) are hydroxyapatite and there is no significant difference in terms of Ca/P ratio for the mineral deposits formed at the two voltages. XRD and FTIR results of the composite scaffolds confirm the successful deposition of nHAp. TGA analysis reveals that the contents of nHAp on nanofibrous scaffolds deposited at different deposition voltage – calculated using the residual mass found following complete thermal decomposition of the scaffolds – are almost similar those calculated from the wt% of nHAp deposited after different deposition voltage.
A hydrophilic surface is a useful attribute and can positively impact initial attachment of cells. In this study, we observe that HAp deposition progressively reduces hydrophobicity, as indicated from reduced contact angles.
Deligianni et al.46 found that with increased surface roughness, about 40% more human bone marrow cells adhered to hydroxyapatite, while Webster et al.47 have reported significant rise in osteoblast adhesion by fabricating surfaces with large nanometer range surface roughness using small grain size of ceramics (specifically, alumina, titania, and hydroxyapatite). Studies have also shown that osteoblasts cultured on surfaces with nano-range roughness gave greater deposition of calcium containing minerals and alkaline phosphatase synthesis compared to traditional ceramic surfaces.21 Thus, surface roughness, in nanometre range can also serve as a positive attribute. Topography analysis using AFM shows surface roughness is highest for NSF-PCL/5V matrix, followed by NSF-PCL/3V matrix. Results of tensile tests show improvement of mechanical properties with HAp deposition with NSF-PCL/5V matrices showing highest tensile strength, ductility and toughness. It is likely that the HAp particles on the surface of the scaffolds show mechanical reinforcement ability by presenting an additional channel for energy dissipation. The mobile nature of the nano particles means that during an imposed deformation; they can reorient and align along directions of stress, form temporary cross linkages across polymer chains, and create a local zone of higher mechanical strength.48 All composite scaffolds showed considerable degradation in the enzymatic degradation study using proteinase K. While degradation of silk-based scaffolds due to proteinase K has similar trends as the degradation caused by certain typical human enzymes,40 it would not be justifiable to extrapolate this study data to a human body's process. This is an aspect that would benefit from further studies. Up to day 5, there is no significant difference between NSF-PCL/3V and NSF-PCL/5V in terms of cellular viability and proliferation. Nano HAp deposited at 5 V on NSF-PCL contains porous structures; this may lead to enhance cellular viability and proliferation than NSF-PCL/3V and control after 14 days of culture.
NSF-PCL/5V is chosen for studies by loading of growth factors in different combination and details in vitro studies of growth factor loaded matrices, based upon its favourable aspects discussed above. Growth factors (rhBMP-2 and TGF-β) are covalently coupled by carbodiimide coupling reaction with NSF-PCL/nHAp scaffolds. Release kinetics studies show that only 20.02% of the rhBMP-2 and 20.93% of the TGF-β are released from the NSF-PCL/5V nanofibrous scaffolds after 4 weeks. The covalent interaction between growth factors and HAp nuclei is presented in Scheme 3. It is likely that the strong bonding between functional groups of growth factors and HAp nuclei slows down the release of growth factors.
Prior studies that have successfully demonstrate bone regeneration by use of single growth factors embedded in polymeric substrates49 used supra-physiological concentration levels for the growth factors. For reference, the physiological level for BMP is just about 1 μg protein per g bone tissue.50 Use of growth factor concentrations much larger than this value effectively makes the technique economically impractical and so clinically infeasible.51 Our study uses growth factors at physiological concentrations (approximately 4–104 ng protein per g scaffold) and also targets at delivering rhBMP-2 and TGF-β together. Results of in vitro studies show significant advantages of this approach, supporting the initial hypothesis regarding dual growth factor delivery. Selection of rhBMP-2 and TGF-β to be used in combination is based on the fact that they are both expressed during natural regeneration of bone, while playing their own unique roles.
Effective adherence of cells onto scaffolds leads to formation of ordered ECM52 and presence of ECM is a requirement for successful tissue reconstruction. Nano-scaled structure, the inherent integrin binding peptide (RGD) sequences in SF of this particular silkworm species, favourability of calcium phosphate for proliferation of osteoblast-like cells and dual growth factors delivery, all together conceivably contribute to the favourable cyto-compatibility of the T/B 5V matrices. Increasing ALP activity throughout culture duration, intensity of mineralization (Alizarin Red staining and Ca2+ assay), significantly improved expression levels of all tested bone-associated genes, and SEM micrographs that show sheet-like arrangement of cells upon the matrices, these observations together indicate the commendable nature of dual growth factor loaded matrices. Similarly, images from confocal laser microscopy show random actin-stress fibers along with dense cell colony deposits across the dual growth factor loaded nanofibrous matrices. These aspects are observed to a lesser extent on the single growth factor loaded matrices. Culmination of all these observations strongly favours the strategy of dual growth factor loading as an attractive for further exploration in bone tissue engineering research. Further improvements can be achieved by optimizing the quantity, delivery rate and mode, and proportion of the growth factors. Using polymeric scaffolds for multiple growth factor delivery – that have distinct kinetics53,54 – better replication of the sequence of growth factor expression during natural repair of bones could possibly be achieved.24
Overall results show that the electrodeposition of nHAp at 5 V on NSF grafted PCL nanofibrous matrices leads to significant improvement of scaffold properties in terms of biocompatibility, mechanical strength, cell viability and proliferation. At the same time, incorporation of dual growth factors (rhBMP-2 + TGF-β) on NSF-PCL/5V scaffold are a notably better choice for furthering the beneficial aspects of the scaffold and for aiding differentiation of cells.
5. Conclusion
Silk fibroin grafted PCL nanofibrous matrices (NSF-PCL) with average fiber diameter 455 nm are mineralized using electrodeposition process. The morphology of the formed mineral layer can be influenced by controlling applied deposition potential. Nano HAp deposited at 5 V on NSF-PCL nanofibrous scaffold (NSF-PCL/5V) provides better strength and cytocompatibility compared to the nano HAp deposited at 3 V on NSF-PCL nanofibrous scaffold (NSF-PCL/3V) and control (NSF-PCL). Growth factors loading and subsequent detailed in vitro studies are carried out with NSF-PCL/5V scaffold. Findings from in vitro studies show the combined loading of growth factors to be better at supporting cell adhesion, proliferation, ECM formation, and bone-associated gene expression. These findings validate the starting hypothesis-dual growth factor loading of this scaffold shows definite promise as a suitable material in the field of bone tissue engineering. This scaffold mimics the composition and structure of the natural bone extracellular matrix. In doing so, it can act as a suitable biocompatible interface for bone regeneration and a platform for further developments. Investigations regarding the aspects of scaffold design and growth factor loading are on-going in our group towards an optimal solution, which would culminate in in vivo trials in future.
Funding sources
Department of Biotechnology (BT/PR10941/MED/32/333/2014), and Indian Council of Medical Research (5/13/12/2010/NCD-III), Govt. of India.
Acknowledgements
Department of Metallurgical & Materials Engineering, IIT Kharagpur provided electrodeposition set-up. We also thank Ms S. Biswas for her help in carrying out the electrodeposition process. Department of Biotechnology and Indian Council of Medical Research, Govt. of India supported the work.
References
- P. X. Ma, Adv. Drug Delivery Rev., 2008, 60, 184–198 CrossRef CAS PubMed.
- F. Yang, J. Wolke and J. Jansen, Chem. Eng. J., 2008, 137, 154–161 CrossRef CAS.
- Y. Liu, G. Wu and K. de Groot, J. R. Soc., Interface, 2010, rsif20100115 Search PubMed.
- C. He, X. Jin and P. X. Ma, Acta Biomater., 2014, 10, 419–427 CrossRef CAS PubMed.
- N. Bhardwaj and S. C. Kundu, Biotechnol. Adv., 2010, 28, 325–347 CrossRef CAS PubMed.
- S. Agarwal, J. H. Wendorff and A. Greiner, Adv. Mater., 2009, 21, 3343–3351 CrossRef CAS PubMed.
- G. Wei and P. X. Ma, Adv. Funct. Mater., 2008, 18, 3568–3582 CrossRef CAS PubMed.
- S. Zhang, Nat. Biotechnol., 2003, 21, 1171–1178 CrossRef CAS PubMed.
- H.-W. Kim, H.-H. Lee and J. Knowles, J. Biomed. Mater. Res., Part A, 2006, 79, 643–649 CrossRef PubMed.
- G. Sui, X. Yang, F. Mei, X. Hu, G. Chen, X. Deng and S. Ryu, J. Biomed. Mater. Res., Part A, 2007, 82, 445–454 CrossRef PubMed.
- G. Wei and P. X. Ma, J. Biomed. Mater. Res., Part A, 2006, 78, 306–315 CrossRef PubMed.
- J. Chen, B. Chu and B. S. Hsiao, J. Biomed. Mater. Res., Part A, 2006, 79, 307–317 CrossRef PubMed.
- X. Li, J. Xie, X. Yuan and Y. Xia, Langmuir, 2008, 24, 14145–14150 CrossRef CAS PubMed.
- J. Myung V aJun and M. V. P. aAltoe, et al., Chem. Commun., 2015, 51, 10218–10221 RSC.
- S. Chen, W. Liu, Z. Huang, X. Liu, Q. Zhang and X. Lu, Mater. Sci. Eng C, 2009, 29, 108–114 CrossRef CAS.
- R. Hu, C. Lin, H. Shi and H. Wang, Mater. Chem. Phys., 2009, 115, 718–723 CrossRef CAS.
- C. He, G. Xiao, X. Jin, C. Sun and P. X. Ma, Adv. Funct. Mater., 2010, 20, 3568–3576 CrossRef CAS PubMed.
- M. Santin, A. Motta, G. Freddi and M. Cannas, J. Biomed. Mater. Res., 1999, 46, 382–389 CrossRef CAS PubMed.
- D. Naskar, S. Nayak, T. Dey and S. C. Kundu, Sci. Rep., 2014, 4, 4735 Search PubMed.
- C. Patra, S. Talukdar, T. Novoyatleva, S. R. Velagala, C. Muhlfeld, B. Kundu, S. C. Kundu and F. B. Engel, Biomaterials, 2012, 33, 2673–2680 CrossRef CAS PubMed.
- P. Bhattacharjee, D. Naskar, H.-W. Kim, T. K. Maiti, D. Bhattacharya and S. C. Kundu, Eur. Polym. J., 2015, 71, 490–509 CrossRef CAS.
- G.-J. Lai, K. Shalumon and J.-P. Chen, Int. J. Nanomed., 2015, 10, 567 CAS.
- A. Korematsu, T. Furuzono, S. Yasuda, J. Tanaka and A. Kishida, J. Mater. Sci.: Mater. Med., 2005, 16, 67–71 CrossRef CAS PubMed.
- L. C. Gerstenfeld, D. M. Cullinane, G. L. Barnes, D. T. Graves and T. A. Einhorn, J. Cell. Biochem., 2003, 88, 873–884 CrossRef CAS PubMed.
- T. Onishi, Y. Ishidou, T. Nagamine, K. Yone, T. Imamura, M. Kato, T. Sampath, P. Ten Dijke and T. Sakou, Bone, 1998, 22, 605–612 CrossRef CAS PubMed.
- T. Furuzono, K. Ishihara, N. Nakabayashi and Y. Tamada, J. Appl. Polym. Sci., 1999, 73, 2541–2544 CrossRef CAS.
- A. Haider, S. Kim, M.-W. Huh and I.-K. Kang, BioMed Res. Int., 2015, 2015, 281909 Search PubMed.
- M. T. Valarmathi, M. J. Yost, R. L. Goodwin and J. D. Potts, Biomaterials, 2008, 29, 2203–2216 CrossRef CAS PubMed.
- Y. Zhang, C. Wu, T. Friis and Y. Xiao, Biomaterials, 2010, 31, 2848–2856 CrossRef CAS PubMed.
- J.-H. Ye, Y.-J. Xu, J. Gao, S.-G. Yan, J. Zhao, Q. Tu, J. Zhang, X.-J. Duan, C. A. Sommer and G. Mostoslavsky, et al., Biomaterials, 2011, 32, 5065–5076 CrossRef CAS PubMed.
- S.-S. Kim, M. S. Park, O. Jeon, C. Y. Choi and B.-S. Kim, Biomaterials, 2006, 27, 1399–1409 CrossRef CAS PubMed.
- S. Nojima, K. Hashizume, A. Rohadi and S. Sasaki, Polymer, 1997, 38, 2711–2718 CrossRef CAS.
- B. B. Mandal and S. C. Kundu, Biotechnol. Bioeng., 2008, 100, 1237–1250 CrossRef CAS PubMed.
- M. Martina and D. W. Hutmacher, Polym. Int., 2007, 56, 145–157 CrossRef CAS.
- T. Elzein, M. Nasser-Eddine, C. Delaite, S. Bistac and P. Dumas, J. Colloid Interface Sci., 2004, 273, 381–387 CrossRef CAS PubMed.
- G. Wu, B. Su, W. Zhang and C. Wang, Mater. Chem. Phys., 2008, 107, 364–369 CrossRef CAS.
- K. S. Hossain, A. Ochi, E. Ooyama, J. Magoshi and N. Nemoto, Biomacromolecules, 2003, 4, 350–359 CrossRef CAS PubMed.
- B. D. Lawrence, Z. Pan, A. Liu, D. L. Kaplan and M. I. Rosenblatt, Acta Biomater., 2012, 8, 3732–3743 CrossRef CAS PubMed.
- J. H. Lee, N. G. Rim, H. S. Jung and H. Shin, Macromol. Biosci., 2010, 10, 173–182 CrossRef CAS PubMed.
- M. Li, M. Ogiso and N. Minoura, Biomaterials, 2003, 24, 357–365 CrossRef CAS PubMed.
- A. K. Shah, J. Lazatin, R. K. Sinha, T. Lennox, N. J. Hickok and R. S. Tuan, Biol. Cell, 1999, 91, 131–142 CrossRef CAS PubMed.
- S.-i. Aota, M. Nomizu and K. M. Yamada, J. Biol. Chem., 1994, 269, 24756–24761 CAS.
- B. Wang, Q. Cai, S. Zhang, X. Yang and X. Deng, J. Mech. Behav. Biomed. Mater., 2011, 4, 600–609 CrossRef CAS PubMed.
- Q. Zhang, Y. Leng and R. Xin, Biomaterials, 2005, 26, 2857–2865 CrossRef CAS PubMed.
- W. Cui, X. Li, C. Xie, H. Zhuang, S. Zhou and J. Weng, Biomaterials, 2010, 31, 4620–4629 CrossRef CAS PubMed.
- D. D. Deligianni, N. D. Katsala, P. G. Koutsoukos and Y. F. Missirlis, Biomaterials, 2000, 22, 87–96 CrossRef.
- T. J. Webster, C. Ergun, R. H. Doremus, R. W. Siegel and R. Bizios, Biomaterials, 2000, 21, 1803–1810 CrossRef CAS PubMed.
- F. Yang, S. K. Both, X. Yang, X. F. Walboomers and J. A. Jansen, Acta Biomater., 2009, 5, 3295–3304 CrossRef CAS PubMed.
- M. P. Lutolf, F. E. Weber, H. G. Schmoekel, J. C. Schense, T. Kohler, R. Muller and J. A. Hubbell, Nat. Biotechnol., 2003, 21, 513–518 CrossRef CAS PubMed.
- C. A. Simmons, E. Alsberg, S. Hsiong, W. J. Kim and D. J. Mooney, Bone, 2004, 35, 562–569 CrossRef CAS PubMed.
- J. R. Lieberman, A. Daluiski and T. A. Einhorn, J. Bone Jt. Surg., Am. Vol., 2002, 84, 1032–1044 Search PubMed.
- S. Verma and N. Kumar, Mater. Sci. Eng C, 2010, 30, 1118–1128 CrossRef CAS.
- A. Raiche and D. Puleo, Biomaterials, 2004, 25, 677–685 CrossRef CAS PubMed.
- T. P. Richardson, M. C. Peters, A. B. Ennett and D. J. Mooney, Nat. Biotechnol., 2001, 19, 1029–1034 CrossRef CAS PubMed.
Footnote |
† Electronic supplementary information (ESI) available. See DOI: 10.1039/c6ra01790h |
|
This journal is © The Royal Society of Chemistry 2016 |
Click here to see how this site uses Cookies. View our privacy policy here.