Tailoring of ammonia reduced graphene oxide into amine functionalized graphene quantum dots through a Hofmann rearrangement

Yongqiang Daiabd, Hao Pangac, Jianheng Huangac, Yong Yangab, Hao Huangab, Kun Wangab, Zhe Maab and Bing Liao*ac
aKey Laboratory of Cellulose and Lignocelluloses Chemistry, Guangzhou Institute of Chemistry, Chinese Academy of Sciences, Guangzhou 510650, China. E-mail: liaobing@gic.ac.cn; Fax: +86 020 85231236; Tel: +86 020 87687689
bUniversity of Chinese Academy of Sciences, Beijing 100049, China
cGuangzhou GIC Green Building Materials Academy, Guangzhou 510650, China
dHunan University of Science and Technology, Yongzhou 425199, China

Received 19th January 2016 , Accepted 30th March 2016

First published on 31st March 2016


Abstract

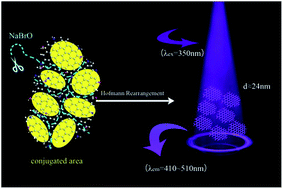
Graphene quantum dots (GQDs) are regarded as promising materials in building biocompatible nanodevices. This paper puts forward a protocol to fabricate amine functionalized graphene quantum dots (afGQDs) by tailoring and exfoliating multilayered ammonia reduced graphene oxide (NH2-G) into afGQDs through a Hofmann rearrangement. The principle on how a Hofmann rearrangement assists in tailoring and exfoliating of NH2-G sheets into afGQDs was posited. The size distribution of afGQDs was tuned by a simple but efficient method based on the adjustment of sodium hypobromite dosage, accompanied by hydrolysis and filtration. The afGQDs emitted broad spectral wavelengths photoluminescence (PL) with two peaks centered at 430 and 510 nm, attributed to unmodified graphene oxide quantum dots and the amine group respectively.

Graphene quantum dots (GQDs) are graphene-based materials that have gained a tremendous amount of interest in the last few years,1 due to their superior and universal combination of a series of unique merits, such as tunable photoluminescence (PL),2 high photo stability3 and biocompatibility.4 Furthermore, GQDs possess better biocompatibility over semiconductor quantum dots and have better photo stability over green fluorescence protein.5,6 GQDs have been regarded as reliable components for constructing nano-devices for bio-imaging, drug delivery7,8 and photothermal or direct therapy.9–11

Interest in GQDs has been mainly focused on their distinct PL properties which are sensitive to the GQDs size, edge configuration, shape, hetero-atom doping, defect and even pH value.1,12–14 Theoretical and experimental attempts have been made to explore the origin and tuning of PL,15,16 yet reports of GQDs fabrication accompanied with a control on size, functional groups, and distribution including type, number and bonding sites (e.g. on the edge or not), still lack in quality and quantity at the present time.17

Amination of oxidized graphene sheets have emerged as normal method to provide GQDs for prospective applications.18,19 Amine groups introduced during amination may act as an important role in biocompatibility and PL tuning of GQDs,2,13,20,21 but they are hypersensitive to oxidation reagents and high temperatures. In most protocols for GQDs preparation, especially those applying an oxidization or carbonization method, amine groups are apt to be corrupted.22 As for those methods adopting a procedure of direct amination by ammonia or organic amine at the epoxy or carboxylic acid site, amine and amide groups coexist in GQDs, hindering a complete understanding of the PL origins and properties.

We propose a novel and selective top-down route applying Hofmann rearrangement to tailor and exfoliate the ammonia-reduced multilayer graphene oxide into afGQDs with high yields. In this experiment specifically, Hofmann rearrangement not only exfoliated and tailored the reduced graphene oxide sheets into GQDs, but also generated amine groups from amide and kept the amine groups in NH2-G unoxidized as well.

Results and discussion

Fourier transform infrared spectroscopy (FT-IR) absorbance spectra were firstly used to investigate the influences of reaction temperatures and sodium hypobromite dosages on afGQDs, considering the strong oxidative nature of Hofmann rearrangement reagent and influence of temperature on oxidative capacity.23 As shown in Fig. 1a, the broad absorbance at 3000 to 3800 cm−1 is assigned to stretching vibrations of O–H and N–H. The bands at approximately 1590 and 1430 cm−1 can be attributed to the stretching vibrations of COO groups. The bands at approximately 1690 cm−1 showed the vibrations of carbonyl groups, 1245 cm−1 of the vibration of C–O, and 1315 cm−1 of C–N bonds.2 The bands at 1430 cm−1 are regarded as the only credible signal to track COO groups, because the bands near 1610 cm−1, which were attributed to C[double bond, length as m-dash]C bonds,24 easily overlapped the signal of COO groups near 1590 cm−1. When the temperature was raised, the absorbance at 3500, 1690, 1430, and 1315 cm−1 were enhanced, yet the bands at 1245 cm−1 decreased compared to the bands at 1610 cm−1. This was mainly caused by the oxidization of C[double bond, length as m-dash]C bonds and the formation of amine, carbonyl and carboxyl groups. When the dosage of sodium hypobromite was increased (Fig. 1b), the absorbance at 1245 cm−1 of samples afGQDs-2 and afGQDs-3 decreased, yet the bands at 1690 cm−1 increased dramatically. This indicated the oxidization of hydroxyl and massive formation of new carbonyl groups. The increased absorbance at 1430 cm−1 indicated that more carboxyl groups were formed. The wide absorbance from 1900 to 2200 cm−1, which can be attributed to the vibration of C–H from aromatic hydrocarbons, vanished when the reaction temperature reached 80 °C, or when more sodium hypobromite was added to the reaction. The augment of absorption at 1315 cm−1, attributed to stretching vibration of C–N bonds of aromatic amine, proved the successful preservation of amine groups in afGQDs.
image file: c6ra01587e-f1.tif
Fig. 1 (a) FT-IR absorbance spectrum of afGQDs prepared at 40, 60 and 80 °C. (b) FT-IR absorbance spectrum of afGQDs-1, afGQDs-2 and afGQDs-3.

X-ray photoelectron spectroscopy (XPS) also confirmed the conclusion of FT-IR, as shown in Fig. 2a. Six types of carbon components with different chemical states were observed, which appeared at 284.8 eV for C–C and C[double bond, length as m-dash]C components, 286.3 eV for C–N, 286.9 eV for C–O, 287.3 eV for C[double bond, length as m-dash]O, 288.7 eV for O–C[double bond, length as m-dash]O, and 289.3 eV for π–π*, respectively.25 Correspondingly, the peak areas of C–C bonds in NH2-G and afGQDs ascended significantly, but those for the C–O bond decreased significantly compared to those of the GO, as shown in Fig. 2b. This was caused mainly by the stripping of oxide debris which are considered to contain more oxidative moieties and can be removed by a base-wash from the graphene sheets.26,27 Furthermore, ammonia adopted in NH2-G fabrication helped to reduce the content of oxygen-containing functional groups. Additionally it must be emphasized that the signals for hydroxyl, carbonyl and carboxyl groups in the afGQDs are slightly higher than those in NH2-G. This is attributed to the partly oxidization of NH2-G to gain carbonyl and carboxyl groups, owning to the strong oxidization property of sodium hypobromite.


image file: c6ra01587e-f2.tif
Fig. 2 (a) C 1s XPS spectrum of afGQDs and (b) contrast of GO, NH2-G and afGQDs. The inlet graph shows contrast of NH2-G and afGQDs.

The 13C nuclear magnetic resonance (NMR) spectrum of the afGQDs-4 could also confirm the formation of carbonyl and carboxyl groups (Fig. 3). The 13C NMR spectrum of the afGQDs was inaccessible unless enough oxidation reagents were added. The signals at 131.2, 137.6, 140.1 and 141.3 ppm can be assigned to conjugated C[double bond, length as m-dash]C groups, while signals at about 177.9 and 186.9 ppm to carbonyl and carboxyl carbon atoms.28 It's worth noting that aromatic carbon atoms bound with amino groups always show signals at around 140 ppm.


image file: c6ra01587e-f3.tif
Fig. 3 13C NMR spectrum of afGQDs.

The atomic force microscope (AFM) study showed the tailoring and exfoliating procedure of NH2-G. As shown in the cross-section images (Fig. 4) and height distribution image (Fig. 5), the height and size of the afGQDs-1, afGQDs-2 and afGQDs-3 declined obviously. The decreasing of the GDQs layers indicated the exfoliating effect of sodium hypobromite. Furthermore, size distribution revealed the “scissors effect” of sodium hypobromite. It's easy to get the conclusion that the NH2-G sheets were tailored by this oxidant reagent in Fig. 6. The mass of residue gained between dialysis and filtration also showed a direct proof of tailoring and exfoliating. The percentage of residues (compared to mass of GO), was approximately 43.6%, 21.3% and 8.4% for GQDs-1, afGQDs-2 and afGQDs-3, with the yields of 4.1%, 11.6% and 26.8%, respectively. In addition, it must be added that, an ultrasonic process of approximately 20 minutes was adopted to get GO dispersed in ethylene glycol in the synthesis of NH2-G. This may also contribute to the tailoring and exfoliating process, too.


image file: c6ra01587e-f4.tif
Fig. 4 AFM and cross-section images of afGDQs-1, afGQDs-2 and afGQDs-3.

image file: c6ra01587e-f5.tif
Fig. 5 Height distribution of afGDQs-1, afGQDs-2 and afGQDs-3, obtained by AFM studies.

image file: c6ra01587e-f6.tif
Fig. 6 Size distributions of afGDQs-1, afGQDs-2 and afGQDs-3 collected from AFM studies.

We propose a principle to show transformations occurring to the raw materials during the Hofmann rearrangement process, based on the experiment facts described above. Firstly, sodium hypobromite acted as scissors, tailored the conjugated aromatic parts away from the NH2-G sheets at the site where there were amine groups. As shown in Scheme 1, if there were amine groups on sp2 hybridized carbon atoms, the formation of carbonyl groups which were resulted from oxidization of C[double bond, length as m-dash]C, led to generation of amide groups. Following the elimination the carbonyl group from the new-formed amide group by Hofmann rearrangement, the adjacent sp2 hybridized carbon atoms to which the residual amine group is linked were oxidized to carbonyl groups to form new amide groups. This circulation continued until the NH2-G sheets were thoroughly tailored or sodium hypobromite ran out. This conversion can also interpret how the size distribution of afGQDs was well controlled.


image file: c6ra01587e-s1.tif
Scheme 1 The lateral and isolated C[double bond, length as m-dash]C were oxidized to C[double bond, length as m-dash]O groups, the resulting amide groups provided the probability to reduce the size of afGQDs.

Secondly, it must be emphasized that the distinct structure of conjugated carbon atom networks were preserved during the tailoring and exfoliating procedure. This was proven by Raman spectroscopy, transmission electron microscope (TEM) and thermogravimetric analysis (TGA). The normalized Raman spectroscopy of afGQDs showed D peaks at 1590 cm−1, and G peaks at 1350 cm−1, which reflects the in-plane vibration of sp2 carbon atoms and the lattice distortions respectively (Fig. 7). The D/G ratio of afGQDs slightly increased compared to that of GO and NH2-G. High-resolution TEM images showed clearly the lattice spacing structure of afGQDs in Fig. 8. At approximately 600 °C as shown in Fig. 9, the mass lost of afGQDs is attributed to the decomposition or sublimation of graphite regions.29 It can be concluded that the honey lattice of graphene is primarily preserved during the Hofmann rearrangement.


image file: c6ra01587e-f7.tif
Fig. 7 Raman spectrum of GO, NH2-G and afGQDs-4.

image file: c6ra01587e-f8.tif
Fig. 8 Size distribution (up) and lattice spacing structure (down) of afGQDs by high resolution TEM.

image file: c6ra01587e-f9.tif
Fig. 9 TGA (a) and DTG (b) of afGQDs.

Finally, the lateral and isolated sp2-hybridized carbon atoms at the distortion edge were easily oxidized to carbonyl groups. The signals between 1900 and 2200 cm−1, which is attributed to the vibration of C–H from aromatic hydrocarbons, vanished when the amount of sodium hypobromite was sufficient or the reaction temperature was enhanced to 80 °C, as shown in Fig. 1. This provided a substantial proof for this conclusion. In most top-down approaches of GQDs fabrication, oxidization is requisite to provide reaction sites before other processing (e.g. hydrothermal synthesis or amidative cutting) is applied (e.g. hydrothermal synthesis or amidative cutting). The function of oxidization reagents can be summarized to be exfoliating and cutting.30 In our opinion, the C[double bond, length as m-dash]C bonds and the structural distortions provided abundant sites for sodium hypobromite to tear apart the aromatic areas on the NH2-G sheets. Besides, electronic perturbations observed by electrostatic force microscopy,31 might also cause tailoring and exfoliating of NH2-G sheets.

The interesting property of afGQDs was the broad downconversion fluorescence emitted in visible areas, as shown in Fig. 10. All the samples, afGDQs-1, afGQDs-2 and afGQDs-3 showed broad emission from 400 to 550 nm. In addition, afGDQs-1, afGQDs-2 and afGQDs-3 showed two downconversion PL emission peaks. The emission peaks were centred at approximately 430 and 510 nm respectively. The former might come from unmodified graphene oxide quantum dots by tuning their nanoscopic aggregation properties.14 The latter was attributed to PL from the amine group.13 As more sodium hypobromite was applied, the emission peak at 510 nm became stronger. This was in accordance with the conclusion that amine groups were preserved during Hofmann rearrangement. The abundant amine groups in afGQDs provide greater space for tuning the PL properties of GQDs.32,33


image file: c6ra01587e-f10.tif
Fig. 10 PL emission of afGQDs.

All afGQDs samples were easily dispersed and re-dispersed in water easily, displaying excellent solubility.19 The photographs of afGQDs and GO suspensions are shown in Fig. 11, which were taken 6 months later after the suspensions were prepared. The excellent solubility may come from the aspects as follows. Firstly, the GO sample was prepared using an improved method, according to which, more epoxy groups could be achieved more than any other method. These facilitated the introduction of more amine groups into the products than other GO synthesis methods during the ammonia-reduction procedure. Secondly, through Hofmann rearrangement, the conversion of amide in NH2-G to amine groups also improved the stability and solubility of afGQDs (the results of elemental analysis showed that afGQDs contained about 4.2% of nitrogen element by weight). Finally, the oxygen-containing groups resulting from oxidation may also have given rise to the solubility. The afGQDs samples all showed a major mass loss below 300 °C in TGA study (Fig. 9), which can be attributed to the loss of absorbed water and decomposition of oxygen-containing functional groups. Zeta potential of the afGQDs-4 could reach −60.3 mV, indicating that the high stability of afGQDs dispersion in water.


image file: c6ra01587e-f11.tif
Fig. 11 Photograph of GO (left) and afGQDs (right).

Conclusions

In summary, we demonstrated a novel protocol to fabricate the amine-modified graphene quantum dots through Hofmann rearrangement of ammonia reduced graphene oxide. Hofmann rearrangement had graphene sheets exfoliated and tailored but preserved the amine groups. The tailoring and exfoliating of NH2-G sheets into afGQDs through Hofmann rearrangement has been proven by a series of characterizations. A simple principle was raised. A conclusion is drawn that the Hofmann rearrangement not only keeps the honey lattice of graphene, but also preserves the amine group in the raw material and turns the amide groups into amine groups.

The size of afGQDs can be easily controlled by dosages of sodium hypobromite accompanied with dialysis and filtration. All samples, afGDQs-1, afGQDs-2 and afGQDs-3, showed broad downconversion PL emission with two emission peaks, centred at approximately 430 and 510 nm respectively. This protocol provides a convenient way to fabricate amine functionalized GQDs with different size and PL properties.

Experimental

Preparation of graphene oxide (GO) and ammonia reduced graphene oxide (NH2-G)

GO was prepared by an improved Hummers method.28 In a typical experiment, a 9[thin space (1/6-em)]:[thin space (1/6-em)]1 mixture of concentrated H2SO4/H3PO4 (360[thin space (1/6-em)]:[thin space (1/6-em)]40 mL) was added to a mixture of 3.0 g graphite flakes and 18.0 g KMnO4. The reaction was then heated to 50 °C and stirred for 12 h before cooled to room temperature and poured over ice (400 mL) with 30% H2O2 (3.0 mL). The mixture was centrifuged (4000 rpm for 15 min). The remaining solid material was then washed with 200 mL of water, 200 mL of 30% HCl, and 200 mL of ethanol. The remaining material was vacuum-dried overnight at 60 °C.

NH2-G was obtained by the reduction of GO using ammonia water via a solvothermal process in ethylene glycol.25 In a typical experiment, 1.0 g GO was added to 80 mL of ethylene glycol under ultrasonication. After a further addition of 5.0 mL of ammonia water, the solution was transferred to a Teflon lined autoclave for solvothermal reaction at 180 °C for 10 h to produce NH2-G.

Fabrication of afGQDs

The sample of NH2-G was prepared from 1.0 g GO was filtrated, washed with deionized water, and added to a flask containing a solution of 10.0 g sodium hydrate, and 5.62 g bromine in an ice bath to produce sodium hypobromite in situ. The mixture was heated to 80 °C for 2 h. A sodium bisulfate solution was added to remove the rest of the NaBrO after cooling. The afGQDs solution was purified by dialysis using a dialysis bag with a retained molecular weight 14[thin space (1/6-em)]000 Da. The products were filtrated using a membrane with the pore size of 0.30 μm, before the filtrate was dried in a rotary evaporator and then in vacuum.

Characterization

FT-IR measurements were performed on a Bruker TENSOR27 spectrophotometer. Direct 13C NMR measurements were acquired on a Bruker DRX-400 spectrometer. AFM images were taken using a MultiMode8 system (Bruker) with a SCANNSYST-AIR probe. High resolution TEM was performed on JEM-2100F. TGA was carried out in N2 on TG209F3 from NETZSCH instrument. The PL spectra were recorded at room temperature on a Hitachi F-4600 spectrophotometer. XPS measurements were taken using a SHIMADZU EPMA-1600 spectrophotometer. Raman spectrum was collected on a HORIBA LabRAM HR800 spectrophotometer. Zeta potential was measured using a Malvern nano zs90 zetasizer.

Acknowledgements

The project was funded by State Key Laboratory for Modification of Chemical Fibers and Polymer Materials, Donghua University, China.

Notes and references

  1. X. T. Zheng, A. Ananthanarayanan, K. Q. Luo and P. Chen, Small, 2015, 11, 1620–1636 CrossRef CAS PubMed.
  2. H. Tetsuka, R. Asahi, A. Nagoya, K. Okamoto, I. Tajima, R. Ohta and A. Okamoto, Adv. Mater., 2012, 24, 5333–5338 CrossRef CAS PubMed.
  3. S. J. Zhu, J. H. Zhang, C. Y. Qiao, S. J. Tang, Y. F. Li, W. J. Yuan, B. Li, L. Tian, F. Liu, R. Hu, H. N. Gao, H. T. Wei, H. Zhang, H. C. Sun and B. Yang, Chem. Commun., 2011, 47, 6858–6860 RSC.
  4. S. Kim, S. W. Hwang, M. K. Kim, D. Y. Shin, D. H. Shin, C. O. Kim, S. B. Yang, J. H. Park, E. Hwang, S. H. Choi, G. Ko, S. Sim, C. Sone, H. J. Choi, S. Bae and B. H. Hong, ACS Nano, 2012, 6, 8203–8208 CrossRef CAS PubMed.
  5. X. M. Li, M. C. Rui, J. Z. Song, Z. H. Shen and H. B. Zeng, Adv. Funct. Mater., 2015, 25, 4929–4947 CrossRef CAS.
  6. M. Nurunnabi, Z. Khatun, K. M. Huh, S. Y. Park, D. Y. Lee, K. J. Cho and Y. K. Lee, ACS Nano, 2013, 7, 6858–6867 CrossRef CAS PubMed.
  7. X. T. Zheng, A. Than, A. Ananthanaraya, D. H. Kim and P. Chen, ACS Nano, 2013, 7, 6278–6286 CrossRef CAS PubMed.
  8. C. H. Lu, B. Willner and I. Willner, ACS Nano, 2013, 7, 8320–8332 CrossRef CAS PubMed.
  9. P. Roy, P. C. Chen, A. P. Periasamy, Y. N. Chen and H. T. Chang, Mater. Today, 2015, 18, 447–458 CrossRef CAS.
  10. V. Volarevic, V. Paunovic, Z. Markovic, B. S. Markovic, M. Misirkic-Marjanovic, B. Todorovic-Markovic, S. Bojic, L. Vucicevic, S. Jovanovic, N. Arsenijevic, I. Holclajtner-Antunovic, M. Milosavljevic, M. Dramicanin, T. Kravic-Stevovic, D. Ciric, M. L. Lukic and V. Trajkovic, ACS Nano, 2014, 8, 12098–12109 CrossRef CAS PubMed.
  11. Z. S. Qian, J. J. Ma, X. Y. Shan, L. X. Shao, J. Zhou, J. R. Chen and H. Feng, RSC Adv., 2013, 3, 14571–14579 RSC.
  12. J. Kim and J. S. Suh, ACS Nano, 2014, 8, 4190–4196 CrossRef CAS PubMed.
  13. S. H. Jin, D. H. Kim, G. H. Jun, S. H. Hong and S. Jeon, ACS Nano, 2013, 7, 1239–1245 CrossRef CAS PubMed.
  14. T. Ghosh and E. Prasad, J. Phys. Chem. C, 2015, 119, 2733–2742 CAS.
  15. H. S. Yunhai Li, X. Niu and J. Wang, J. Phys. Chem. C, 2015, 119, 24950–24957 Search PubMed.
  16. S. J. Zhu, J. R. Shao, Y. B. Song, X. H. Zhao, J. L. Du, L. Wang, H. Y. Wang, K. Zhang, J. H. Zhang and B. Yang, Nanoscale, 2015, 7, 7927–7933 RSC.
  17. M. Nurunnabi, K. Parvez, M. Nafiujjaman, V. Revuri, H. A. Khan, X. L. Feng and Y. K. Lee, RSC Adv., 2015, 5, 42141–42161 RSC.
  18. F. Jiang, D. Q. Chen, R. M. Li, Y. C. Wang, G. Q. Zhang, S. M. Li, J. P. Zheng, N. Y. Huang, Y. Gu, C. R. Wang and C. Y. Shu, Nanoscale, 2013, 5, 1137–1142 RSC.
  19. Q. Xue, H. Huang, L. Wang, Z. W. Chen, M. H. Wu, Z. Li and D. Y. Pan, Nanoscale, 2013, 5, 12098–12103 RSC.
  20. S. K. Singh, M. K. Singh, P. P. Kulkarni, V. K. Sonkar, J. J. A. Gracio and D. Dash, ACS Nano, 2012, 6, 2731–2740 CrossRef CAS PubMed.
  21. Z. S. Qian, X. Y. Shan, L. J. Chai, J. J. Ma, J. R. Chen and H. Feng, Nanoscale, 2014, 6, 5671–5674 RSC.
  22. W. Zhu, H. J. Song, L. C. Zhang, Y. Y. Weng, Y. Y. Su and Y. Lv, RSC Adv., 2015, 5, 60085–60089 RSC.
  23. C. H. Senanayake, L. E. Fredenburgh, R. A. Reamer, R. D. Larsen, T. R. Verhoeven and P. J. Reider, J. Am. Chem. Soc., 1994, 116, 7947–7948 CrossRef CAS.
  24. W. R. Collins, W. Lewandowski, E. Schmois, J. Walish and T. M. Swager, Angew. Chem., Int. Ed., 2011, 50, 8848–8852 CrossRef CAS PubMed.
  25. L. F. Lai, L. W. Chen, D. Zhan, L. Sun, J. P. Liu, S. H. Lim, C. K. Poh, Z. X. Shen and J. Y. Lin, Carbon, 2011, 49, 3250–3257 CrossRef CAS.
  26. X. B. Fan, W. C. Peng, Y. Li, X. Y. Li, S. L. Wang, G. L. Zhang and F. B. Zhang, Adv. Mater., 2008, 20, 4490–4493 CrossRef CAS.
  27. H. R. Thomas, S. P. Day, W. E. Woodruff, C. Valles, R. J. Young, I. A. Kinloch, G. W. Morley, J. V. Hanna, N. R. Wilson and J. P. Rourke, Chem. Mater., 2013, 25, 3580–3588 CrossRef CAS.
  28. D. C. Marcano, D. V. Kosynkin, J. M. Berlin, A. Sinitskii, Z. Z. Sun, A. Slesarev, L. B. Alemany, W. Lu and J. M. Tour, ACS Nano, 2010, 4, 4806–4814 CrossRef CAS PubMed.
  29. J. P. Rourke, P. A. Pandey, J. J. Moore, M. Bates, I. A. Kinloch, R. J. Young and N. R. Wilson, Angew. Chem., Int. Ed., 2011, 50, 3173–3177 CrossRef CAS PubMed.
  30. D. Y. Pan, J. C. Zhang, Z. Li and M. H. Wu, Adv. Mater., 2010, 22, 734–738 CrossRef CAS PubMed.
  31. S. S. Datta, D. R. Strachan, E. J. Mele and A. T. C. Johnson, Nano Lett., 2009, 9, 7–11 CrossRef CAS PubMed.
  32. B. P. Qi, H. Hu, L. Bao, Z. L. Zhang, B. Tang, Y. Peng, B. S. Wang and D. W. Pang, Nanoscale, 2015, 7, 5969–5973 RSC.
  33. G. S. Kumar, R. Roy, D. Sen, U. K. Ghorai, R. Thapa, N. Mazumder, S. Saha and K. K. Chattopadhyay, Nanoscale, 2014, 6, 3384–3391 RSC.

This journal is © The Royal Society of Chemistry 2016
Click here to see how this site uses Cookies. View our privacy policy here.