Dual-functional α-NaYb(Mn)F4:Er3+@NaLuF4 nanocrystals with highly enhanced red upconversion luminescence

Xia Xuab, Peng Zhangc, Qinghai Yuanc, Pengpeng Leiab, Lile Dongab, Zhuo Wangab, Xiuling Liua, Shuyan Songa, Jing Feng*a and Hongjie Zhang*a
aState Key Laboratory of Rare Earth Resource Utilization, Changchun Institute of Applied Chemistry, Chinese Academy of Science, 5625 Renmin Street, Changchun 130022, China. E-mail: fengj@ciac.ac.cn; hongjie@ciac.ac.cn; Fax: +86-431-85698041; Tel: +86-431-85262127
bUniversity of Chinese Academy of Sciences, Beijing 100049, China
cDepartment of Radiology, The Second Hospital of Jilin University, Changchun 130041, China

Received 19th January 2016 , Accepted 21st March 2016

First published on 22nd March 2016


Abstract

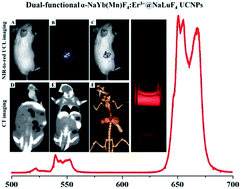
Rare earth doped upconversion nanoparticles (UCNPs) used as bioprobes for in vivo upconversion luminescence (UCL) deep tissue imaging have been extensively studied. Red emission possesses high penetration length in biological tissue, so it's more convenient for naked eyed red emission to be performed in biological imaging and detection. However, improved in vivo imaging depth based on the NIR-to-red UCL is still challenging and desirable. Herein, novel α-NaYb(Mn)F4:Er3+@NaLuF4 core–shell nanocrystals with enhanced red emission and improved imaging depth have been synthesized. Under 980 nm excitation, there is a 220% increase in red-to-green ratio and even a 400% increase in red-emission when the Yb3+ core doping concentration is increased from 18% to 68% in the core–shell structure. And the UCL signals detection of pork muscle tissues could be visualized even at a depth of 18 mm. By the tail vein injection of PEG modified α-NaYb(Mn)F4:Er3+@NaLuF4 UCNPs, the in vivo and ex vivo NIR-to-red UCL deep tissue imaging present significant UCL signals in liver and spleen. Moreover, the UCNPs could also be used as in vitro and in vivo X-ray computed tomography (CT) contrast agent owing to the large X-ray absorption efficiency and high atomic number of ytterbium and lutetium elements. The synergistic combination of the in vivo NIR-to-red UCL deep tissue and CT imaging could provide comprehensive diagnosis information for cancer.


Introduction

Photoluminescence (PL) imaging technique offers a unique approach for monitoring the physiological procedures in biomedical and diagnostic medicine research due to low biological toxicity, high sensitivity, and fast imaging.1,2 PL imaging in the visible and near-infrared (400–750 nm and 750–900 nm) regions have been widely investigated for visualizing morphological details from living cells to tissues, but a single-modality imaging technique does not meet all required capabilities due to its intrinsic defects rooted in limited resolution or image depths.3–5 Imaging probes, as one of the most important parts of biomedical and theranostic platforms, have obtained more and more attention.6–8 Therefore, designing and synthesizing multi-modal bioimaging probes is essential for biomedical research, diagnostics, and therapeutics.9–15

Recently, rare-earth doped upconversion nanoparticles (UCNPs) have been proposed as a promising new generation of multifunctional bioprobes due to its abundant optical properties, magnetic properties, and strong X-ray attenuation.16–21 Compared with traditional organic dyes, fluorescent proteins, and semiconductor quantum dots (QDs), rare-earth doped UCNPs are excited by NIR light rather than visible light or ultraviolet (UV). This could significantly conquer the drawback of photobleaching, phototoxicity, auto-fluorescence, and light scattering, and provide advantages, such as improved signal-to-noise ratio, increased penetration length, highly elevated resolution, and sensitivity.22–27 In addition, UCNPs exhibit a narrow emission band, large Stoke's shifts and low cytotoxicity.28,29 In light of the application of upconversion nanoprobes for in vivo deep tissue imaging, requirements include not only relative small size, uniform shape, enhanced luminescence intensity and good biocompatibility of the bioprobes,20,30 but also high penetration length of the excitation and emission wavelengths. In other words, it's essential for both the excitation and emission wavelength to enter the “optical window” (650–1000 nm) of the biological tissues.31–36 Hence, it's penetration ability is of great importance for preparing efficient and biocompatible UCNPs with excitation and emission within the red and NIR windows of tissue optical transmission. More significantly, the sensitive and intense red and NIR emission of Er3+ and Tm3+ doped UCNPs have been successfully achieved via types of methods, such as design special UC hosts or energy transfer routes.37–44

What's more, Yb and Lu-based UCNPs have been developed as promising contrast agents for larger K-edge energy, high atomic number, and X-ray absorption coefficients.45,46 X-ray computed tomography (CT) is one of the most used molecular imaging techniques due to its high resolution and deep tissue penetration, but it is still a challenge to distinguish mysterious changes of the soft tissues due to slight density differences. Once high-resolution and deep-penetration CT technology is combined with a fast-response PL imaging technique, then more accurate information for biomedical and diagnostic medicine research may be anticipated.43,47,48 Surface passivation with core/shell structure is an effective way to enhance emission intensity and has benefits for UCL deep tissue imaging.49 Red emission also possesses high penetration length in biological tissue; and what's more, red emission is visible to the naked eye so it's more convenient for naked eyed red emission to be performed in biological imaging and detection fields. Yet, very few reports focus their attention on enhancing red emission via core–shell structure to benefit improved in vivo imaging depth.

In this work, a dual-functional imaging nanoprobe based on DSPE–PEG 2000 modified α-NaYb(Mn)F4:Er3+@NaLuF4 UCNPs was developed. Under 980 nm excitation, Er3+-doped α-NaYb(Mn)F4@NaLuF4 UCNPs exhibit enhanced red UCL intensity and the UCL signals detection in pork muscle tissues could be visualized even at a depth of 18 mm. In addition, uniform morphology, low cytotoxicity, good biocompatibility, adequate red emission intensity, and a high X-ray absorption coefficient of α-NaYb(Mn)F4@NaLuF4@PEG UCNPs guarantee them as excellent nanoprobes for in vivo NIR-to-red UCL deep tissue and CT imaging.

Experimental section

Materials

LuCl3·6H2O (99.99%), YbCl3·6H2O (99.99%), ErCl3·6H2O (99.99%), Lu2O3 (99.99%), trifluoroacetic acid (99%), Na(CF3COO) (97%), oleic acid (OA), and 1-octadecene (ODE) (90%) were purchased from Alpha Reagents. MnCl2·4H2O (99%) was obtained from Xilong Chemical Co., Ltd. DSPE–PEG 2000 was purchased from Yvette Reagents. NaOH, NaF, absolute ethanol, and cyclohexane were all obtained from Beijing Chemical Reagents and used as received without further purification. Lu(CF3COO)3 was synthesized by dissolving Lu2O3 in trifluoroacetic acid.

Synthesis of dual-functional nanoprobe

Synthesis of α-NaYb(Mn)F4:Er3+ UCNPs. Mn2+-doped α-NaYbF4:Er3+ nanocrystals (Mn[thin space (1/6-em)]:[thin space (1/6-em)]Yb[thin space (1/6-em)]:[thin space (1/6-em)]Er = 30[thin space (1/6-em)]:[thin space (1/6-em)]68[thin space (1/6-em)]:[thin space (1/6-em)]2) were synthesized according to a typical experimental procedure.31 In brief, 1.5 mL of NaOH (5 M), 10 mL of ethanol, and 5 mL of OA were added together with stirring to form sodium–OA complex. Then, a 2.6 mL mixed water solution of YbCl3, ErCl3 and MnCl2 (1 mmol in total) was added into the sodium–OA complex. After sufficient stirring for 15 min, 2 mL of NaF (2 M) was added dropwise to the mixture and stirred continuously for 30 min, then the white emulsion-like solution was transferred into a 50 mL Teflon-lined autoclave, sealed and heated at 200 °C for 8 h. The final product was separated by centrifugation and washed with ethanol and cyclohexane for several times, and then dispersed in cyclohexane.

The synthesis of different Yb3+ concentrations (48% and 18%) doped α-NaLu(Mn)F4:Er3+ nanoparticles was carried out exactly as outlined for the Mn2+-doped α-NaYbF4:Er3+ nanocrystals above, except that the amount of Yb3+ was substituted by Lu3+.

Synthesis of α-NaYb(Mn)F4:Er3+@NaLuF4 nanocrystals. The synthesis of α-NaYb(Mn)F4:Er3+@NaLuF4 nanocrystals was similar to a previous procedure:50 the obtained α-NaYb(Mn)F4:Er3+ core nanocrystals, 1 mmol of NaCF3COO, and 1 mmol of Lu(CF3COO)3 were added into a three-necked flask within a mixture of OA and ODE (v/v = 6.5 mL[thin space (1/6-em)]:[thin space (1/6-em)]6.5 mL). The mixture was vigorously magnetically stirred and heated to 100 °C under vacuum to remove oxygen and water, then the mixture was maintained at 100 °C for 30 min under Ar atmosphere to form a transparent solution. The transparent solution was then heated to 250 °C and maintained at this temperature for 30 min under Ar atmosphere. When the reaction was completed and the mixture was cooled to room temperature, an excessive amount of absolute ethanol was added, and the as-precipitated product was collected by centrifugation, washed several times with ethanol, and finally re-dispersed in cyclohexane. The synthesis of α-NaLu(Mn)F4:Yb3+,Er3+@NaLuF4 nanocrystals was carried out as described above.

The α-NaYb(Mn)F4:Er3+@NaLuF4 nanocrystals with different particle sizes were synthesized by using an identical procedure, except for the amount of α-NaYb(Mn)F4:Er3+ core crystals.

Preparation of PEG-modified α-NaYb(Mn)F4:Er3+@NaLuF4 UCNPs

According to a typical procedure,31 40 mL of chloroform containing 200 mg of α-NaYb(Mn)F4:Er3+@NaLuF4 UCNPs was added into a 200 mL round-bottom flask, then another 40 mL of chloroform containing 400 mg of DSPE–PEG 2000 was added. After gently stirring for one night, the solvent was evaporated in a rotary evaporator with a water bath at 30 °C, the product was dispersed in water with ultrasonication, and then washed several times with water, followed by filtering through a 0.22 μm membrane filter. The PEG-modified α-NaYb(Mn)F4:Er3+@NaLuF4 was labelled as α-NaYb(Mn)F4:Er3+@NaLuF4@PEG.

Characterization

The powder X-ray diffraction (XRD) patterns were obtained on a D8 Focus diffractometer (Bruker), using Cu Kα radiation (40 kV, 40 mA, λ = 0.15418 nm). The 2θ angle of the spectra was obtained at a scanning rate of 5° min−1. Inductively Coupled Plasma (ICP) was taken on an iCAP 6300 (Thermo Scientific, USA). Transmission electron microscopy (TEM) and high-resolution transmission electron microscopy (HRTEM) images were performed using a FEI Tecnai G2 S-Twin high-resolution transmission electron microscope operating at 200 kV. Energy-dispersive X-ray spectroscopy (EDS) was performed using a field emission scanning electron microscope (XL30, Philips). The upconversion luminescence spectra were measured using a 980 nm laser diode and recorded by a triple grating monochromator (Spectra Pro-2758, Acton Research Corporation). Fourier-transform infrared (FT-IR) spectra were measured on a Bruker TENSOR 27 FT-IR spectrometer. The decay curve measurements were performed and analyzed with a LeCroy Wave Runner 6100 1 GHz oscilloscope.

In vitro cytotoxicity assay

In vitro cytotoxicity assay of α-NaYb(Mn)F4:Er3+@NaLuF4@PEG UCNPs was evaluated against osteoblast cells. An osteoblast cell suspension solution was seeded in a 96-well plate with a dose of 100 μL per well and cultured at 37 °C in 5% CO2 for 24 h. Then, osteoblast cells were treated with 10 μL α-NaYb(Mn)F4:Er3+@NaLuF4@PEG UCNPs suspension using a series of different concentrations (0, 15.6, 31.2, 62.5, 125, 250, 500, and 1000 μg mL−1) for about 6 h. At the end of the incubation, cells were treated with CCK-8 reagent and incubated for another 2 h. Then a microplate reader was used to examine optical density at a wavelength of 450 nm.

Animal experiments

The female Kunming mice were purchased from the Center for Experimental Animals, Jilin University (Changchun, China). The in vivo study conformed to the guidelines of the National Regulation of China for Care and Use of Laboratory Animals.

In vivo NIR-to-red UCL deep tissue imaging

In vivo NIR-to-red UCL imaging of female Kunming mice (18–20 g) was performed using a modified in vivo Maestro whole-body imaging system with an external 980 nm laser as the excitation source. In vivo NIR-to-red UCL imaging was administered after the tail vein injection of α-NaYb(Mn)F4:Er3+@NaLuF4@PEG UCNPs (2 mg mL−1, 150 μL) for 60 min. Then, the major internal organs were removed for ex vivo imaging.

In vitro and in vivo CT imaging

In vitro and in vivo CT imaging was tested at 120 kVp voltages with a Philips 256-slice CT Scanner (Philips Medical System). The α-NaYb(Mn)F4@NaLuF4@PEG nanoparticles and iobitridol with a series of concentrations were placed in 1.5 mL centrifuge tubes (0.5 mL for each tube) for CT imaging.

To perform in vivo CT imaging, the Kunming mice were first scanned before tail vein injection, then 100 μL of α-NaYb(Mn)F4:Er3+@NaLuF4@PEG UCNPs was intravenously injected into each mouse (80 mg mL−1). CT images were acquired at timed intervals. Imaging parameters were given as follows: thickness, 0.9 mm; pitch, 0.99; 120 kVp, 300 mA; field of view, 350 mm; gantry rotation time, 0.5 s; table speed, 158.9 mm s−1.

Results and discussion

Synthesis and characterization

Fig. 1 shows the transmission electron microscopy (TEM) images and X-ray diffraction (XRD) patterns of 30% Mn2+ doped α-NaYbF4:Er3+ (expressed as α-NaYb(Mn)F4:Er3+) and α-NaYb(Mn)F4:Er3+@NaLuF4 UCNPs. As demonstrated in Fig. 1A and B, the as-synthesized α-NaYb(Mn)F4:Er3+ core-only nanocrystals exhibit a nearly spherical shape and excellent monodispersity, with an average size of 18.8 nm (Fig. S1). The TEM images in Fig. 1D and E show that α-NaYb(Mn)F4:Er3+@NaLuF4 core–shell UCNPs possess uniform size but irregular shape, and the particle size of core–shell nanostructure increase obviously (about 31 nm), indicating the core–shell structure as suspected. High-resolution TEM images (insets in Fig. 1B and E) reveal that d-spacings of the lattice fringes are about 0.318 and 0.315 nm for core and core–shell UCNPs, respectively. Both of them correspond to the (111) planes of α-NaYbF4. Furthermore, α-NaYb(Mn)F4:Er3+ and α-NaYb(Mn)F4:Er3+@NaLuF4 UCNPs were characterized by XRD pattern. As shown in Fig. 1C and F, both core and core–shell nanoparticles show well-defined diffraction peaks, confirming their good crystallinity. The XRD patterns can be well indexed to cubic structure, and no trace of other phases or impurities were detected. As reported in our previous work, for Mn2+ doped α-NaYbF4, the Mn2+ ions successfully induce the product transformed from the mixture of hexagonal and cubic NaYbF4 to pure cubic NaYbF4 with small size.51 The compositional analysis by energy-dispersive X-ray spectroscopy (EDS) revealed the existence of Mn2+, Yb3+, Na+ and F ions in core and Mn2+, Lu3+, Yb3+, Na+ and F ions in core–shell UCNPs (Fig. S2). However, after being coated with NaLuF4 shell via thermal decomposition of Ln(CF3COO)3 precursors, most Mn2+ ions were replaced by Lu3+ due to the lattice match of the Lu3+ relative to Yb3+; the actual Mn2+ ions doping level is less than 2% in core–shell UCNPs. What's more, the size of the α-NaYb(Mn)F4:Er3+@NaLuF4 UCNPs could be efficiently controlled. As shown in Fig. 1G–I, the particle size could be varied from 31 to 82 nm by decreasing the amount of α-NaYb(Mn)F4:Er3+ core crystals (as shown in Table S1). Simultaneously, with the increase of nanoparticle size, α-NaYb(Mn)F4:Er3+@NaLuF4 UCNPs grow up to be nanospheres instead of irregular shapes. Those size-controlled nanospheres are composed of several ultra-small nanoparticles. Assembled ultra-small nanoparticles making core–shell UCNPs have extremely high specific surface area, and have potential applications in drug delivery and energy-transfer (ET) systems.52
image file: c6ra01569g-f1.tif
Fig. 1 (A) Low-, (B) high-magnification TEM images, and (C) XRD pattern of α-NaYb(Mn)F4:Er3+ core UCNPs, (D and G) low-, (E and H) high-magnification TEM images and (F) XRD patterns of α-NaYb(Mn)F4:Er3+@NaLuF4 core–shell UCNPs. (I) Size distribution of core–shell UCNPs in (D) and (G). Insets in (B) and (E) are the corresponding HRTEM images of core and core–shell UCNPs.

Upconversion luminescence properties

Fig. 2A shows the UCL spectra of α-NaYb(Mn)F4:Er3+ core and α-NaYb(Mn)F4:Er3+@NaLuF4 core–shell UCNPs. Compared with bare emission of α-NaYb(Mn)F4:Er3+ UCNPs, the NaLuF4 coated core–shell UCNPs showed intense red UCL emission when they were dispersed in cyclohexane. There are three resolved UCL bands centered at 521, 540, and 651 nm, which are attributed to 2H11/24I15/2, 4S3/24I15/2, and 4F9/24I15/2 transitions of Er3+ ions, respectively. Furthermore, the intensity of the red emission from 4F9/24I15/2 transition is very strong and even more than 16 times stronger than that of all other UCL bands. The UCL dynamic process of the Er3+ in core–shell UCNPs was also measured. For the 4S3/24I15/2 and 4F9/24I15/2 transitions of Er3+, the decay of the intensity is exponential. The decay times were fitted to be 125.6 μs for the 4S3/24I15/2 transition and 324.6 μs for the 4F9/24I15/2 transition, respectively (shown in Fig. 2B). Moreover, to further understand the possible UCL mechanism, the power-dependent curve of α-NaYb(Mn)F4:Er3+@NaLuF4 peaked at 651 nm was also measured. As shown in Fig. S3, the slope is fitted to be 2.20, indicating that a two-photon upconversion process is involved to populate the 4F9/2 level of Er3+. Generally, like α-NaYb(Mn)F4:Er3+ UCNPs, they usually possess a very high surface area-to-volume ratio due to small-size effect, and a majority of the dopants should be located at the surface of the UCNPs. After being coated with shell, the excitation energy would be protected from the surface defects, impurities, and solvents, and the UCL intensity and lifetime would be efficiently improved by avoiding surface-related quenching. Thus, α-NaYb(Mn)F4:Er3+@NaLuF4 shows stronger UCL intensity and longer UCL lifetime than those of α-NaYb(Mn)F4:Er3+ core-only nanocrystals.
image file: c6ra01569g-f2.tif
Fig. 2 (A) UCL spectra of α-NaYb(Mn)F4:Er3+ core and α-NaYb(Mn)F4:Er3+@NaLuF4 core–shell UCNPs, (B) UCL dynamic curve for the 4S3/24I15/2 and 4F9/24I15/2 transitions of α-NaYb(Mn)F4:Er3+@NaLuF4 core–shell UCNPs.

In addition, for a high red-to-green ratio of the core–shell UCNPs, except in apparent non-radiative energy transfer between Mn2+ and Er3+ (due to trace amounts of Mn2+ ions in the core), the above properties might be caused mainly by the high Yb3+ doping level. In order to confirm this assumption, we optimized a series of monodispersed α-NaLu(Mn)F4:Yb3+,Er3+@NaLuF4 UCNPs with different Yb3+ levels (18%, 48%) in the core. The phase and morphology of α-NaLu(Mn)F4:Yb3+ (18%/48%),Er3+ core and α-NaLu(Mn)F4:Yb3+ (18%/48%),Er3+@NaLuF4 core–shell UCNPs were characterized by XRD and TEM. As shown in Fig. S4, the morphology of both core and core–shell are consistent with 68% Yb3+ doped core and core–shell UCNPs. Simultaneously, with the change of the Yb3+ concentration, the phase did not change (as shown in Fig. S5). Fig. 3 shows the UCL spectra, red-to-green ratios and the integrated counts of red emission of α-NaLu(Mn)F4:Er3+@NaLuF4 UCNPs with different Yb3+ core doping levels. Under 980 nm excitation, both the α-NaLu(Mn)F4:Yb3+,Er3+@NaLuF4 and α-NaYb(Mn)F4:Er3+@NaLuF4 UCNPs exhibit bright UCL in hexane. When the Yb3+ core doping concentration increased from 18% to 68%, the red-to-green ratio elevated from 7.3 to 16.27. There is a 220% increase in red-to-green ratio and even a 400% increase in red-emissions. Whether the red-to-green ratio or the red-emission, the increased percent from α-NaLu(Mn)F4:Yb3+ (18%),Er3+@NaLuF4 to α-NaYb(Mn)F4:Er3+@NaLuF4 is higher than α-NaYF4:Yb3+,Er3+@CaF2 with the Yb3+ core doping level which increased from 20% to 80%.37 In a word, to α-NaLu(Mn)F4:Yb3+,Er3+@NaLuF4 UCNPs, the optimal Yb3+ doping level for NIR-to-red UCL is 68%. High Yb3+ doping concentration not only facilities the energy transfer between Yb3+ and Er3+, but also causes back-energy-transfer from Er3+ to Yb3+ (4S3/2(Er3+) + 2F7/2(Yb3+) → 4I13/2(Er3+) + 2F5/2(Yb3+)).53 The back-energy-transfer process inhibits the population of 4S3/2 state, which results in an increase of the 4I13/2 state of Er3+. Followed by 2F5/2(Yb3+) + 4I13/2(Er3+) → 2F7/2(Yb3+) + 4F9/2(Er3+) energy transfer, the 4F9/2(Er3+) state could be directly populated and efficiently enhance the red emission. Thus, the dominated red emission is due to not only non-radiative energy transfer between Mn2+ and Er3+, but also to the back-energy-transfer from Er3+ to Yb3+ (as shown in Fig. 3B). Due to high penetration length of the red emission and being visible to the naked eyes, it's more convenient to use the enhanced red emission of α-NaYb(Mn)F4:Er3+@NaLuF4 as an output signal to achieve the NIR-to-red UCL deep tissue imaging and biological detection.


image file: c6ra01569g-f3.tif
Fig. 3 (A) UCL spectra, (B) possible UCL mechanism, (C) the red-to-green rations, and (D) integrated counts of red emission of α-NaLu(Mn)F4:Yb3+,Er3+@NaLuF4 UCNPs with different Yb3+ core doping levels under 980 nm excitation.

In order to enable oleic acid capped core–shell UCNPs for bioapplications, the nanocrystals were modified with DSPE–PEG 2000 to yield water soluble α-NaYb(Mn)F4:Er3+@NaLuF4@PEG. The reduced characteristic bands of OA and two emerged bands of PEG at 1736 and 1109 cm−1 (stretching vibrations of the carboxyl ester band and the ether band) in the Fourier transform-infrared spectrum (FT-IR) of α-NaYb(Mn)F4:Er3+@NaLuF4@PEG confirm the successful modification of core–shell UCNPs with PEG (Fig. 4A).47,48 The UCL spectrum of PEG modified α-NaYb(Mn)F4:Er3+@NaLuF4 is shown in Fig. 4B. The emission intensity of α-NaYb(Mn)F4:Er3+@NaLuF4@PEG remains more than 50% compared with that of OA-coated UCNPs. The strong red emission, good monodispersing, and biocompatibility guarantee α-NaYb(Mn)F4:Er3+@NaLuF4@PEG UCNPs as excellent nanoprobes for in vivo NIR-to-red UCL deep tissue imaging.


image file: c6ra01569g-f4.tif
Fig. 4 (A) FTIR spectra and (B) UCL spectra of OA-coated α-NaYb(Mn)F4:Er3+@NaLuF4 UCNPs and PEG-modified α-NaYb(Mn)F4:Er3+@NaLuF4 UCNPs.

In vitro cytotoxicity assay

As the α-NaYb(Mn)F4:Er3+@NaLuF4@PEG UCNPs are intended to circulate in vivo and to accumulate in major organs, possessing low cytotoxicity and good biocompatibility is of great importance. The cytotoxicity of α-NaYb(Mn)F4:Er3+@NaLuF4@PEG UCNPs was evaluated against osteoblast cells using CCK-8 assay. As shown in Fig. S6, it is clearly observed that after being treated with α-NaYb(Mn)F4:Er3+@NaLuF4@PEG of varied concentrations for 6 h, the viabilities of all osteoblast cells remain nearly 100%, demonstrating low cytotoxicity and good biocompatibility of α-NaYb(Mn)F4:Er3+@NaLuF4@PEG UCNPs in vitro.

In vivo NIR-to-red UCL deep tissue imaging

To evaluate the suitability of α-NaYb(Mn)F4:Er3+@NaLuF4@PEG UCNPs for in vivo NIR-to-red UCL deep tissue imaging, UCL signal detection in pork muscle tissues treated with different Yb3+ levels core–shell UCNPs at different depths was performed. As shown in Fig. 5, the UCL signals of all core–shell UCNPs could be detected at about 10 and 14 mm beneath the tissue surface. And the UCL signals of α-NaYb(Mn)F4:Er3+@NaLuF4@PEG are visualized even at a depth of 18 mm. The results indicate that α-NaYb(Mn)F4:Er3+@NaLuF4@PEG can be used as a promising nanoprobe for in vivo NIR-to-red deep tissue imaging. To further verify the image quality, a female Kunming mouse was injected through its tail vein with α-NaYb(Mn)F4:Er3+@NaLuF4@PEG. The Kunming mouse was imaged after intravenous administration for 60 min using a modified in vivo Maestro whole-body imaging system, and the scattered excitation light was filtered out in front of the imaging camera by an emission filter. Fig. 6 shows the whole-body imaging results, and the overlay of bright field and UCL images of the mouse indicates that the detectable strong signals at 60 min post-injection could be ascribed to the liver and spleen. This result indicates that the red emission from α-NaYb(Mn)F4:Er3+@NaLuF4@PEG UCNPs is strong enough for a whole-body PL imaging.
image file: c6ra01569g-f5.tif
Fig. 5 UCL signal detection of pork muscle tissues treated with different α-NaLu(Mn)F4:x%Yb3+,Er3+@NaLuF4@PEG UCNPs (5 mg mL−1, I: 0.5 A) in different depths (10, 14, and 18 mm).

image file: c6ra01569g-f6.tif
Fig. 6 Whole-body imaging of a Kunming mouse after intravenous administration for 60 min. (A, D and G) Bright-field images; (B, E and H) UCL images; (C, F and I) corresponding merged bright-field and UCL images of (A, D, G, and B, E, H). The (D–I) images are ex vivo UCL imaging after injection for 60 min. (1) Spleen; (2) heart; (3) liver; (4) kidney.

In spite of the deeper tissue penetration and higher sensitivity of NIR-to-red UCL imaging, the ex vivo UCL imaging was also performed to verify the distribution of α-NaYb(Mn)F4:Er3+@NaLuF4@PEG UCNPs after sacrificing the mouse at 60 min post-injection. As shown in Fig. 6D–I, significant NIR-to-red UCL signals in liver and spleen are observed, which imply that α-NaYb(Mn)F4:Er3+@NaLuF4@PEG UCNPs mainly accumulate in the liver and spleen after intravenous administration for 60 min. The strong NIR-to-red UCL signals detected in vivo deep tissues demonstrated that α-NaYb(Mn)F4:Er3+@NaLuF4@PEG UCNPs are suitable and excellent NIR-to-red UCL deep tissue imaging nanoprobes.

In vitro and in vivo CT imaging

In order to evaluate CT contrast efficacy, water soluble α-NaYb(Mn)F4:Er3+@NaLuF4@PEG nanocrystals with various Yb3+ and Lu3+ concentrations and a series of iobitridol were prepared to test X-ray absorption. The in vitro CT images of α-NaYb(Mn)F4:Er3+@NaLuF4@PEG show that the higher concentration of Yb3+ and Lu3+ is, the brighter the signal is. And the Hounsfield units (HU) value varies linearly as a function of concentration of Yb3+ and Lu3+. As shown in Fig. 7, by comparing the X-ray absorption signal of α-NaYb(Mn)F4:Er3+@NaLuF4@PEG UCNPs with iobitridol, the CT signals of UCNPs are much brighter than that of iobitridol with equivalent concentrations. The in vitro CT imaging result indicates that α-NaYb(Mn)F4:Er3+@NaLuF4@PEG nanoparticles are promising CT contrast agents. Thus, the feasibility of using α-NaYb(Mn)F4:Er3+@NaLuF4@PEG as in vivo CT imaging agents has been assessed.
image file: c6ra01569g-f7.tif
Fig. 7 (A) CT images of α-NaYb(Mn)F4:Er3+@NaLuF4@PEG UCNPs and iobitridol with a series of concentrations. (B) CT value (HU) of α-NaYb(Mn)F4:Er3+@NaLuF4@PEG UCNPs (red circles) and iobitridol (black squares) as a function of the concentration.

For in vivo CT imaging, α-NaYb(Mn)F4:Er3+@NaLuF4@PEG was injected into a female Kunming mouse via tail vein, then the mouse was imaged at various time periods. As shown in Fig. 8, strong CT signals began to arise in the heart after intravenous administration for 1 min. What's more, obviously enhanced CT signals in great vessels can be clearly observed in the 3D-renderings of CT images and continues for up to 30 min post-injection. Long-lasting circulation in vessels is essential for vascular imaging and diseases diagnose. As time goes on, the CT signal began to decrease in the heart, while increasing in the liver and spleen (shown in Fig. 9). After intravenous administration for 180 min, the persistently strong signals in the liver and spleen can also be observed. In addition, no obvious CT signal in a kidney in the whole circulation also indicates long circulation time of the α-NaYb(Mn)F4:Er3+@NaLuF4@PEG UCNPs in vivo. The excellent CT signals in great vessels and main organs indicate that α-NaYb(Mn)F4:Er3+@NaLuF4@PEG UCNPs could also be used as a promising in vivo CT contrast agent.


image file: c6ra01569g-f8.tif
Fig. 8 In vivo CT coronal view images of a mouse after intravenous injection of α-NaYb(Mn)F4:Er3+@NaLuF4@PEG UCNPs at various time periods. (A) Heart, liver and spleen, (B) liver, spleen and kidney, (C) the corresponding 3D renderings of in vivo CT images.

image file: c6ra01569g-f9.tif
Fig. 9 HU values of different organs after intravenous injection of α-NaYb(Mn)F4:Er3+@NaLuF4@PEG UCNPs at timed intervals.

Conclusions

In summary, an excellent α-NaYb(Mn)F4:Er3+@NaLuF4 dual-functional nanoprobe for efficient in vivo NIR-to-red UCL deep tissue and CT imaging has been synthesized. Under 980 nm excitation, α-NaYb(Mn)F4:Er3+@NaLuF4 core–shell UCNPs protect the excitation energy from surface defects, impurities and solvents, efficiently enhance UCL intensity, and improve the imaging depth. Through elaborately regulating the Yb3+ core doping level, there was a 220% increase in red-to-green ratio (and even a 400% increase in red-emissions) when the Yb3+ concentration increased from 18% to 68%, and the UCL signals were visualized even at a depth of 18 mm. The enhanced naked eyed red emission was used as an output signal to perform in vivo NIR-to-red deep tissue imaging which was acquired with outstanding performance. Simultaneously, the Yb3+ and Lu3+ based UCNPs also exhibit excellent CT contrast efficacy in great vessels and main organs via tail vein injection. The in vivo imaging with strong NIR-to-red signals and excellent CT signals demonstrate that α-NaYb(Mn)F4:Er3+@NaLuF4@PEG UCNPs are suitable and excellent dual-functional bioimaging nanoprobes.

Acknowledgements

The authors are grateful for the financial aid from the National Natural Science Foundation of China (Grant No. 21371165, 21590794, 51372242, 21221061, 21210001, and 21501167), Science and Technology Cooperation Special Project of Hong Kong, Macao and Taiwan (Grant no. 2014DFT10310), the National Key Basic Research Program of China (No. 2014CB643802), the Youth Innovation Promotion Association of Chinese Academy of Sciences (No. 2015181).

Notes and references

  1. H. Hyun, H. Wada, K. Bao, J. Gravier, Y. Yadav, M. Laramie, M. Henary, J. V. Frangioni and H. S. Choi, Angew. Chem., Int. Ed., 2014, 53, 10668–10672 CrossRef CAS PubMed.
  2. X. Y. Ji, F. Peng, Y. L. Zhong, Y. Y. Su, X. X. Jiang, C. X. Song, L. Yang, B. B. Chu, S. T. Lee and Y. He, Adv. Mater., 2015, 27, 1029–1034 CrossRef CAS PubMed.
  3. X. M. Sun, Z. Liu, K. Welsher, J. T. Robinson, A. Goodwin, S. Zaric and H. J. Dai, Nano Res., 2008, 1, 203–212 CrossRef CAS PubMed.
  4. V. Biju, T. Itoh, A. Anas, A. Sujith and M. Ishikawa, Anal. Bioanal. Chem., 2008, 391, 2469–2495 CrossRef CAS PubMed.
  5. M. Nyk, R. Kumar, T. Y. Ohulchanskyy, E. J. Bergey and P. N. Prasad, Nano Lett., 2008, 8, 3834–3838 CrossRef CAS PubMed.
  6. Z. Chen, W. Zheng, P. Huang, D. T. Tu, S. Y. Zhou, M. D. Huang and X. Y. Chen, Nanoscale, 2015, 7, 4274–4290 RSC.
  7. T. M. Sun, Y. S. Zhang, B. Pang, D. C. Hyun, M. X. Yang and Y. N. Xia, Angew. Chem., Int. Ed., 2014, 53, 12320–12364 CAS.
  8. G. N. Wang, X. J. Zhang, Y. X. Liu, Z. J. Hu, X. F. Mei and K. Uvdal, J. Mater. Chem. B, 2015, 3, 3072–3080 RSC.
  9. Z. G. Yi, S. J. Zeng, W. Lu, H. B. Wang, L. Rao, H. R. Liu and J. H. Hao, ACS Appl. Mater. Interfaces, 2014, 6, 3839–3846 CAS.
  10. L. J. Zhou, X. P. Zheng, Z. J. Gu, W. Y. Yin, X. Zhang, L. F. Ruan, Y. B. Yang, Z. B. Hu and Y. L. Zhao, Biomaterials, 2014, 35, 7666–7678 CrossRef CAS PubMed.
  11. S. Lu, D. T. Tu, P. Hu, J. Xu, R. F. Li, M. Wang, Z. Chen, M. D. Huang and X. Y. Chen, Angew. Chem., Int. Ed., 2015, 54, 7915–7919 CrossRef CAS PubMed.
  12. G. Y. Chen, H. L. Qiu, P. N. Prasad and X. Y. Chen, Chem. Rev., 2014, 114, 5161–5214 CrossRef CAS PubMed.
  13. Y. Wang and H. C. Gu, Adv. Mater., 2015, 27, 576–585 CrossRef CAS PubMed.
  14. Y. J. Lu, B. C. He, J. Shen, J. Li, W. T. Yang and M. Z. Yin, Nanoscale, 2015, 7, 1606–1609 RSC.
  15. Y. H. Wang, S. Y. Song, J. H. Liu, D. P. Liu and H. J. Zhang, Angew. Chem., Int. Ed., 2015, 54, 536–540 CAS.
  16. X. Chen, D. F. Peng, Q. Ju and F. Wang, Chem. Soc. Rev., 2015, 44, 1318–1330 RSC.
  17. Y. I. Park, K. T. Lee, Y. D. Suh and T. Hyeon, Chem. Soc. Rev., 2015, 44, 1302–1317 RSC.
  18. M. Haase and H. Schafer, Angew. Chem., Int. Ed., 2011, 50, 5808–5829 CrossRef CAS PubMed.
  19. H. Dong, L. D. Sun and C. H. Yan, Nanoscale, 2013, 5, 5703–5714 RSC.
  20. C. Y. Liu, Y. Hou and M. Y. Gao, Adv. Mater., 2014, 26, 6922–6932 CrossRef CAS PubMed.
  21. X. M. Li, F. Zhang and D. Y. Zhao, Chem. Soc. Rev., 2015, 44, 1346–1378 RSC.
  22. F. Wang and X. G. Liu, Chem. Soc. Rev., 2009, 38, 976–989 RSC.
  23. V. A. Vlaskin, N. Janssen, J. van Rijssel, R. Beaulac and D. R. Gamelin, Nano Lett., 2010, 10, 3670–3674 CrossRef CAS PubMed.
  24. J. Feng, K. J. Tian, D. H. Hu, S. Q. Wang, S. Y. Li, Y. Zeng, Y. Li and G. Q. Yang, Angew. Chem., Int. Ed., 2011, 50, 8072–8076 CrossRef CAS PubMed.
  25. J. Zhou, Z. Liu and F. Y. Li, Chem. Soc. Rev., 2012, 41, 1323–1349 RSC.
  26. E. J. McLaurin, V. A. Vlaskin and D. R. Gamelin, J. Am. Chem. Soc., 2011, 133, 14978–14980 CrossRef CAS PubMed.
  27. R. Abdul Jalil and Y. Zhang, Biomaterials, 2008, 29, 4122–4128 CrossRef CAS PubMed.
  28. Y. Sun, W. Feng, P. Y. Yang, C. H. Huang and F. Y. Li, Chem. Soc. Rev., 2015, 44, 1509–1525 RSC.
  29. A. Gnach, T. Lipinski, A. Bednarkiewicz, J. Rybka and J. A. Capobianco, Chem. Soc. Rev., 2015, 44, 1561–1584 RSC.
  30. S. Y. Han, R. R. Deng, X. J. Xie and X. G. Liu, Angew. Chem., Int. Ed., 2014, 53, 11702–11715 CrossRef CAS PubMed.
  31. G. Tian, Z. J. Gu, L. J. Zhou, W. Y. Yin, X. X. Liu, L. Yan, S. Jin, W. L. Ren, G. M. Xing, S. J. Li and Y. L. Zhao, Adv. Mater., 2012, 24, 1226–1231 CrossRef CAS PubMed.
  32. J. Shen, G. Chen, A.-M. Vu, W. Fan, O. S. Bilsel, C.-C. Chang and G. Han, Adv. Opt. Mater., 2013, 1, 644–650 CrossRef.
  33. Q. Q. Zhan, J. Qian, H. J. Liang, G. Somesfalean, D. Wang, S. L. He, Z. G. Zhang and S. Andersson-Engels, ACS Nano, 2011, 5, 3744–3757 CrossRef CAS PubMed.
  34. A. M. Smith, M. C. Mancini and S. M. Nie, Nat. Nanotechnol., 2009, 4, 710–711 CrossRef CAS PubMed.
  35. R. Weissleder, Nat. Biotechnol., 2001, 19, 316–317 CrossRef CAS PubMed.
  36. Y. T. Zhong, G. Tian, Z. J. Gu, Y. J. Yang, L. Gu, Y. L. Zhao, Y. Ma and J. N. Yao, Adv. Mater., 2014, 26, 2831–2837 CrossRef CAS PubMed.
  37. G. Y. Chen, J. Shen, T. Y. Ohulchanskyy, N. J. Patel, A. Kutikov, Z. P. Li, J. Song, R. K. Pandey, H. Agren, P. N. Prasad and G. Han, ACS Nano, 2012, 6, 8280–8287 CrossRef CAS PubMed.
  38. Q. Liu, Y. Sun, T. S. Yang, W. Feng, C. G. Li and F. Y. Li, J. Am. Chem. Soc., 2011, 133, 17122–17125 CrossRef CAS PubMed.
  39. Y. H. Hu, X. H. Liang, Y. B. Wang, E. Z. Liu, X. Y. Hu and J. Fan, Ceram. Int., 2015, 41, 14545–14553 CrossRef CAS.
  40. D. Q. Chen, L. Liu, P. Huang, M. Y. Ding, J. S. Zhong and Z. G. Ji, J. Phys. Chem. Lett., 2015, 6, 2833–2840 CrossRef CAS PubMed.
  41. L. Q. Xiong, Z. G. Chen, M. X. Yu, F. Y. Li, C. Liu and C. H. Huang, Biomaterials, 2009, 30, 5592–5600 CrossRef CAS PubMed.
  42. J. Tang, L. Chen, J. Li, Z. Wang, J. H. Zhang, L. G. Zhang, Y. S. Luoand and X. J. Wang, Nanoscale, 2015, 7, 14752–14759 RSC.
  43. S. J. Zeng, Z. G. Yi, W. Lu, C. Qian, H. B. Wang, L. Rao, T. M. Zeng, H. R. Liu, H. J. Liu, B. Feiand and J. H. Hao, Adv. Funct. Mater., 2014, 24, 4051–4059 CrossRef CAS.
  44. W. Wei, Y. Zhang, R. Chen, J. L. Goggi, N. Ren, L. Huang, K. K. Bhakoo, H. D. Sun and T. T. Y. Tan, Chem. Mater., 2014, 26, 5183–5186 CrossRef CAS.
  45. Y. L. Liu, K. L. Ai, J. H. Liu, Q. H. Yuan, Y. Y. He and L. H. Lu, Angew. Chem., Int. Ed., 2012, 51, 1437–1442 CrossRef CAS PubMed.
  46. Y. L. Liu, K. L. Ai, J. H. Liu, Q. H. Yuan, Y. Y. He and L. H. Lu, Adv. Healthcare Mater., 2012, 1, 461–466 CrossRef CAS PubMed.
  47. H. Y. Xing, W. B. Bu, Q. G. Ren, X. P. Zheng, M. Li, S. J. Zhang, H. Y. Qu, Z. Wang, Y. Q. Hua, K. L. Zhao, L. P. Zhou, W. J. Peng and J. L. Shi, Biomaterials, 2012, 33, 5384–5393 CrossRef CAS PubMed.
  48. J. A. Damasco, G. Y. Chen, W. Shao, H. Agren, H. Y. Huang, W. T. Song, J. F. Lovell and P. N. Prasad, ACS Appl. Mater. Interfaces, 2014, 6, 13884–13893 CAS.
  49. X. S. Zhai, P. P. Lei, P. Zhang, Z. Wang, S. Y. Song, X. Xu, X. L. Liu, J. Feng and H. J. Zhang, Biomaterials, 2015, 65, 115–123 CrossRef CAS PubMed.
  50. H.-X. Mai, Y.-W. Zhang, L.-D. Sun and C.-H. Yan, J. Phys. Chem. C, 2007, 111, 13721–13729 CAS.
  51. X. Xu, Z. Wang, P. P. Lei, Y. N. Yu, S. Yao, S. Y. Song, X. L. Liu, Y. Su, L. L. Dong, J. Feng and H. J. Zhang, ACS Appl. Mater. Interfaces, 2015, 7, 20813–20819 CAS.
  52. Y. D. Ding, F. Wu, Y. L. Zhang, X. M. Liu, E. M. de Jong, T. Gregorkiewicz, X. Hong, Y. C. Liu, M. C. Aalders, W. J. Buma and H. Zhang, J. Phys. Chem. Lett., 2015, 6, 2518–2523 CrossRef CAS PubMed.
  53. A. Punjabi, X. Wu, A. Tokatli-Apollon, M. El-Rifai, H. Lee, Y. W. Zhang, C. Wang, Z. Liu, E. M. Chan, C. Y. Duan and G. Han, ACS Nano, 2014, 8, 10621–10630 CrossRef CAS PubMed.

Footnote

Electronic supplementary information (ESI) available. See DOI: 10.1039/c6ra01569g

This journal is © The Royal Society of Chemistry 2016