Template-free assembling Ni nanoparticles to a 3D hierarchical structure for superior performance supercapacitors†
Xiangye Liua,
Chenlong Donga,
Xiaotao Yuana,
Xin Wanga,
Wujie Donga and
Fuqiang Huang*ab
aBeijing National Laboratory for Molecular Sciences and State Key Laboratory of Rare Earth Materials Chemistry and Applications, College of Chemistry and Molecular Engineering, Peking University, Beijing 100871, P. R. China. E-mail: huangfq@pku.edu.cn
bCAS Key Laboratory of Materials for Energy Conversion and State Key Laboratory of High Performance Ceramics and Superfine Microstructures, Shanghai Institute of Ceramics, Chinese Academy of Sciences, Shanghai 200050, P. R. China
First published on 10th March 2016
Abstract
Nanoflake arrays of Ni nanoparticles were assembled by template-free methods, including metal hydroxide arrays grown in situ on Ni foams and the following non-contact Al-reduction processes. After electrochemical activation, they achieved superior specific capacitances and excellent rate capabilities, owing to their good electric conductivity and mass transport properties.
Supercapacitors, as a new class of energy storage devices, are attracting growing attention,1,2 because of their higher energy density than conventional dielectric capacitors and higher power density than rechargeable batteries.3 Compared to double-layer capacitors (EDLCs), pseudo-capacitors have the potential to achieve high energy densities, resulting from the fast and reversible redox reactions at/near the interface of the active storage material and an electrolyte.4 3D transition-metal oxides (such as NiO, CoO, Co3O4, Fe2O3, MnO2, and MoO3) have been the most attractive active materials because of their high theoretical specific capacitance, low cost, and environmental compatibility.5–10 However, the intrinsic insulating properties of those oxides result in great gaps between the experimental capacitances and the theoretical ones, as well as unsatisfactorily rate capability and long-term cycle stability.
In contrast, metallic nickel with excellent electric conductivity can be applied directly to supercapacitors instead of nickel oxides. During electrochemical polarization in an alkaline electrolyte, the surfaces of the metals can be converted to hydroxide species, which can serve as capacitively active materials.11,12 Furthermore, delicate nanostructures are in favor of higher specific capacitances, owing to their large effective areas and excellent mass transport properties. Therefore, Ni nanoparticles,13 mesoporous nickel,11 Ni/carbon material composite,14 nanoporous Ni–Mn alloy,15 and Ni nanoparticle tube arrays16 have been fabricated to achieve improved supercapacitor performances. Among them, 3D hierarchical structures grown in situ on the current collectors have attracted increasing interest, considering their higher surface areas and reliable stabilities.16–18 However, it remains a challenge to assemble metal nanoparticles into such a structure by template-free methods.
Here, we assembled nickel nanoparticles directly into porous nanoflake arrays without the assistance of a template, through treating the nickel hydroxide precursors by a non-contact Al-reduction method. This unique reduction method could ingeniously convert the hydroxide precursors to homogeneous interconnected metal nanoparticles and retain the pristine array structures. The as-prepared 3D hierarchical structured metal nanoparticles possess good electric conductivity, effective electrolyte diffusion, and large active surface area. After electrochemical activation, the nickel nanoflake arrays (NFAs) exhibited remarkable specific capacitance (1385 F g−1 at 5 A g−1) and excellent rate capabilities, which are significantly superior than the nickel oxide analogues.
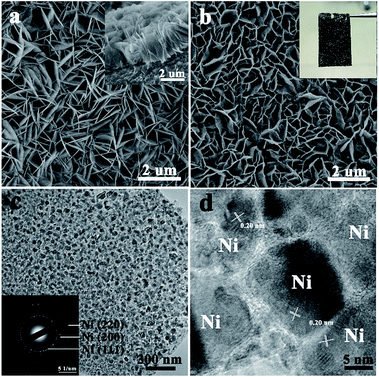
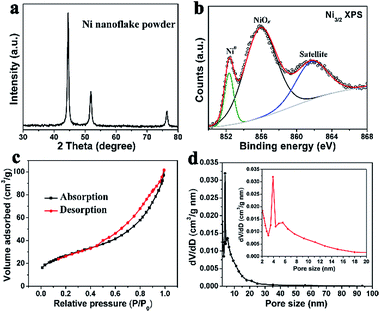
The NFAs were fabricated by a two-step method (details in ESI†). Well-aligned arrays of nickel hydroxide nanoflakes on nickel foam were first prepared by a hydrothermal method.19,20 These nanoflakes have an edge length of 1–3 μm and a uniform thickness of less than 20 nm, as shown in Fig. 1a. The as-grown nickel hydroxide arrays on the nickel foam are crystallized in hexagonal Ni(OH)2·0.75H2O structure with high purity, as confirmed by the corresponding XRD result (Fig. S1a†). They were then treated by a non-contact Al-reduction process in a vacuum two-zone tube furnace to obtain the desired arrays of Ni nanoparticles. The working principle was detailed in the ESI.† The SEM image (Fig. 1b) indicates that the Ni nanoparticles on the Ni foam retain the nanoflake array structure, with each unit contacting the substrate vertically. The cubic metallic phases of the Ni nanoparticles were confirmed by the powder XRD (Fig. 2a) and SAED (Fig. 1c). TEM images show that the nanoflake is composed of homogeneous opaque nanoparticles interconnected with each other, with a uniform size of 15–20 nm (Fig. 1c). The opaque nanoparticles in the nanoflake were identified as metallic Ni, as seen from their interplanar spacings of 0.20 nm for (111) planes in their lattice-resolved HRTEM image (Fig. 1d). At the interfaces between the Ni nanoparticles, there are some thinner layer species with low crystallization. This is believed to be a small amount of unreduced nickel oxide (NiOx) and fine metallic nickel crystal nucleus. Those species serve as the linker to connect the Ni nanoparticles to the 3D hierarchical structures. Numerous inter-particle mesopores with a size about 5 nm are seen in the Ni nanoflakes. These pores originated from the release of water and oxygen molecules during the reduction process. The existence of unreduced NiOx could be evidenced by X-ray photoelectron spectroscopy (XPS), as shown in Fig. 2b. In the Ni 2p3/2 core level XPS spectrum of the Ni nanoflake powder, the peak at 852.3 eV was assigned to metallic Ni; the peak at 856.1 eV is related to an intense non-local screening effect in the oxygen-defective NiOx;21–23 the peak at 861.7 eV is the charge transfer satellite. These results suggest some NiOx species exist around the Ni nanoparticles, but with a small amount under the XRD detection limit.
The pore structures of the porous nickel nanoflakes were examined further by N2 adsorption–desorption measurements. The isotherms with H3 hysteresis loops were observed (Fig. 2b), which are commonly observed for plate-like particles with slit-shaped pores.19 The pore size distributions calculated from the desorption isotherms by the Barrett–Joyner–Halenda (BJH) method are shown as a plot of the relative pore filling versus pore size in Fig. 2c. This indicates that mesopores with a size of 2–20 nm are in the nickel nanoflakes with the main peak at 3.9 nm and a small peak at 5.6 nm and a broad distribution between 6 and 20 nm. This is in accordance with the TEM results. Nanoporous structures are important to facilitate the mass transport of electrolytes within the electrodes for fast redox reactions and also provide a large electroactive area for the electrochemical reaction. By the Brunauer–Emmett–Teller (BET) method, the specific surface area of nickel nanoflake powder was calculated to be 64.8 m2 g−1, which is a considerably large value among porous nickel-based electrode materials.19,24,25
To highlight the importance of the non-contact Al-reduction method for the preparation of NFAs, the precursors of Ni(OH)2·0.75H2O nanoflake arrays were also treated by conventional H2 reduction for comparison. The products from H2 reduction are only irregular Ni particles, confirmed by the XRD (Fig. S1c†) and SEM (Fig. S2†) characterizations. Owing to the small size and high diffusion ability of H2 molecules, they are easy to fully absorb on the surfaces of the precursors, as well as the pores of their decomposition products during the annealing process. Furthermore, the reaction rate of hydrogen and metal oxides is uncontrollably fast at elevated temperature. Therefore, the metal phases were rapidly separated and immediately fused into unfavorable agglomerates. Interestingly, different mechanisms are encountered in the non-contact Al-reduction process. The metal hydroxide precursors and Al powder reductant were placed separately in a vacuum two-zone tube furnace. The furnace was constantly pumped to remove the gases generated during the annealing process, and Al further decreased the oxygen partial pressure to provide a kinetic driving force to reduce the sample. The metallic Ni first nucleates uniformly on the sample surface and gradually grows to be nanoparticles within the pristine hydroxide frameworks. By this way, the 3D hierarchical structured Ni nanoparticles can be formed.
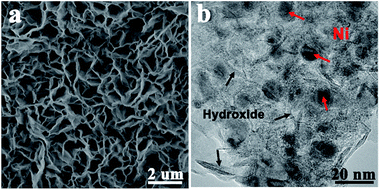
The NFAs were activated electrochemically using the cyclic voltammetry (CV) technique with a three-electrode system in 2 M KOH solution. During these processes, the redox peak currents were found to increase gradually, reaching nearly steady values after 200 cycles (Fig. S4†). This corresponds to the formation of metal hydroxide species on the metal nanoparticles, which then act as the active materials to contribute to the faradaic pseudocapacitance. After this activation process, the nanoflake array structure was well maintained, as seen from the corresponding SEM image (Fig. 3a). Fig. 3b shows TEM images of a nickel nanoflake after 200 cycles of CV test. Thin layers of metal hydroxides are loosely packed on the surfaces, with abundant porosity to facilitate the diffusion of electrolyte ions into the deep portion of the electrodes. The Ni nanoparticles are embedded in the hydroxide layers, avoiding further oxidation and serving as the conductive agent to improve the electric conductivity.
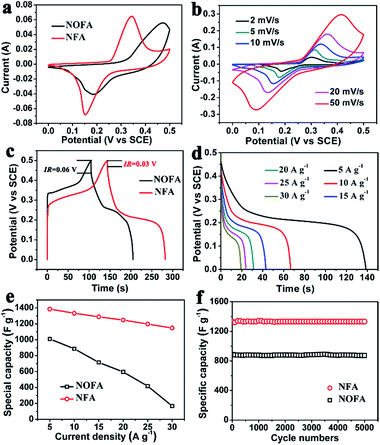
After electrochemical activation, the supercapacitor performance of the NFAs was measured using a three-electrode system in a 2 M KOH solution. For comparison, the NiO nanoflake arrays (NOFAs) were prepared from the same nickel hydroxide precursors annealed in Ar, and the phase and morphology confirmed by XRD (Fig. S1b†) and SEM (Fig. S3†) characterization, respectively. The supercapacitor performance of NOFAs was also measured under the same condition. Fig. 4a shows their CV curves at a scan rate of 5 mV s−1. The NFAs no doubt deliver better electrochemical performances compared to NPFAs, as seen from its larger and more symmetrical redox peaks (redox reactions of Ni(II) and Ni(III)). In addition, the highly symmetric CV curves of the metal NFAs remained almost unchanged as the scan rate was increased from 2 to 50 mV s−1, and the peak potential shifted only ca. 93 mV for a 25-times increase in scan rate (seen from Fig. 4b), suggesting a lower polarization and excellent rate capability.26 In contrast, the NOFAs exhibit less symmetrical CV curves, and suffer severe polarization in the promoted scan rates. The anodic peaks of the both electrodes were shifted out of the measured window when the scan rate was higher than 20 mV s−1 (Fig. S5†). Fig. 4c shows the charge/discharge curves of the two electrodes collected at a current density of 5 A g−1. The charge/discharge curve of the NFA electrode is symmetrical and prolonged substantially over the NOFA electrodes, revealing a dramatically improved capacitive behavior. The IR drops of NFA and NOFA electrodes were 0.03 V and 0.06 V, respectively, suggesting decreased internal resistances for NFA. The galvanostatic discharge curves for the NFAs at various current densities are shown in Fig. 4d. Their specific capacitances derived from those discharge curves are plotted in Fig. 4e. When the current density was 5 A g−1, the specific capacitance of the NFAs was 1385 F g−1, which was 1010 F g−1 larger than that of the NOFAs. With charging–discharging rate increasing from 5 to 30 A g−1, the capacitances of the NFAs were ∼83%, which is much better than the NOFAs (∼17%). These results again indicate the superior rate capability of the NFAs. Excellent cycling stability is crucial for real supercapacitors operations. Herein, the long-term cycle stabilities of the NFAs were evaluated by repeating the charging–discharging test at a current density of 10 A g−1 for 5000 cycles. The specific capacitance as a function of the cycle number is presented in Fig. 4f. Capacitance retention of the NFAs was 96%, indicating good stabilities during the cycling test.
Electrochemical impedance spectroscopy (EIS) was further carried out to investigate the origin of the capacitance improvement for the metal NFAs. Fig. 5 shows the Nyquist plots with the high frequency regions of the spectra shown in the inset. In the EIS, the intercept on the real axis in the high frequency range provides the equivalent series resistance (ESR), which includes the inherent resistances of the electroactive material, bulk resistance of the electrolyte, and contact resistance at the interface between the electrolyte and the electrode. The magnitude of the ESRs obtained for NFAs and NOFAs was found to be 1.35 Ω and 1.56 Ω, respectively, which indicates an increased electrical conductivity of metal NFAs compared to the oxide electrodes. Furthermore, the charge transfer resistance (Rct) of the electrode material can be calculated from the diameter of the semicircle in the high frequency range. Herein, the Rct values of the NFAs and NOFAs were 0.72 Ω and 0.91 Ω, respectively, indicating smaller Rcts for the metal NFAs. This corresponds to their fast redox reaction rate and improved rate capability. The Warburg resistance, which describes the diffusion of redox ions in the electrolyte to the electrode interface, can be reflected from the slope of the EIS curve in the low frequency range. The higher slope for the NFA electrode indicates a faster ion diffusion rate compared to that of NOFA electrode. This means that the unique structure of the NFA electrode has a superior mass transport property. Overall, the higher specific capacitance and superior rate capability of the metal NPAs result from their improved electric conductivity, fast reaction kinetics, and mass transport properties. This lies in the metal conductive agents and the special porous hierarchical structures.
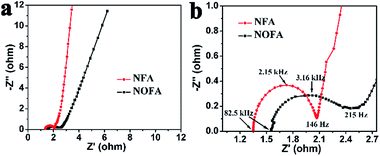 | ||
| Fig. 5 (a) Nyquist plot and (b) zoom-in of the high frequency region of the nickel nanoflake array (NFA) and nickel oxide nanoflake array (NOFA). | ||
In summary, 3D hierarchical structured Ni nanoparticles have been fabricated via a template-free method, including metal hydroxide arrays in situ growth on the Ni foam and the following non-contact Al-reduction processes. The non-contact Al-reduction processes were crucial for the generation of metal nanoparticles within the skeleton frames of hydroxide precursors, maintaining their pristine array structures. The porous NFAs had good electric conductivity and a large specific area. After electrochemical activation, the NFAs exhibited higher specific capacitance and better rate capabilities compared to the nickel oxide electrode. The NFAs also showed good long-term cyclic stability. These results suggest that the NFAs are promising for applications in low cost and high-capacity supercapacitors. The non-contact Al-reduction method may also provide a new way to fabricate novel nanostructured materials for high-performance electrochemical capacitors.
Acknowledgements
This study was supported financially by the NSF of China (Grant nos.61376056, 51125006, 91122034, 51121064) and the Science and Technology Commission of Shanghai (Grant no. 13JC1405700, 14520722000).Notes and references
- C. Liu, F. Li, L. P. Ma and H. M. Cheng, Adv. Energy Mater., 2010, 22, E28–E62 CrossRef CAS PubMed.
- J. R. Miller and P. Simon, Science, 2008, 321, 651–652 CrossRef CAS PubMed.
- P. Simon and Y. Gogotsi, Nat. Mater., 2008, 7, 845–854 CrossRef CAS PubMed.
- G. Wang, L. Zhang and J. Zhang, Chem. Soc. Rev., 2012, 41, 797–828 RSC.
- X. Zhang, W. Shi, J. Zhu, W. Zhao, J. Ma, S. Mhaisalkar, T. L. Maria, Y. Yang, H. Zhang, H. H. Hng and Q. Yan, Nano Res., 2010, 3, 643–652 CrossRef CAS.
- C. Zhou, Y. Zhang, Y. Li and J. Liu, Nano Lett., 2013, 13, 2078–2085 CrossRef CAS PubMed.
- X.-h. Xia, J.-p. Tu, Y.-q. Zhang, Y.-j. Mai, X.-l. Wang, C.-d. Gu and X.-b. Zhao, RSC Adv., 2012, 2, 1835–1841 RSC.
- K. K. Lee, S. Deng, H. M. Fan, S. Mhaisalkar, H. R. Tan, E. S. Tok, K. P. Loh, W. S. Chin and C. H. Sow, Nanoscale, 2012, 4, 2958 RSC.
- W. Wei, X. Cui, W. Chen and D. G. Ivey, Chem. Soc. Rev., 2011, 40, 1697–1721 RSC.
- R. Liang, H. Cao and D. Qian, Chem. Commun., 2011, 47, 10305–10307 RSC.
- S.-M. Bak, K.-H. Kim, C.-W. Lee and K.-B. Kim, J. Mater. Chem., 2011, 21, 1984–1990 RSC.
- M. Yu, W. Wang, C. Li, T. Zhai, X. Lu and Y. Tong, NPG Asia Mater., 2014, 6, e129 CrossRef CAS.
- Q. Lu, M. W. Lattanzi, Y. Chen, X. Kou, W. Li, X. Fan, K. M. Unruh, J. G. Chen and J. Q. Xiao, Angew. Chem., 2011, 123, 6979–6982 CrossRef.
- L. Liu, Y. Yu, C. Yan, K. Li and Z. Zheng, Nat. Commun., 2015, 6 Search PubMed.
- J. Kang, A. Hirata, H. J. Qiu, L. Chen, X. Ge, T. Fujita and M. Chen, Adv. Mater., 2014, 26, 269–272 CrossRef CAS PubMed.
- Q. Li, C.-L. Liang, X.-F. Lu, Y.-X. Tong and G.-R. Li, J. Mater. Chem. A, 2015, 3, 6432–6439 CAS.
- A. K. Singh, D. Sarkar, G. G. Khan and K. Mandal, J. Mater. Chem. A, 2013, 1, 12759–12767 CAS.
- Z. Tang, C. h. Tang and H. Gong, Adv. Funct. Mater., 2012, 22, 1272–1278 CrossRef CAS.
- H. Wu, M. Xu, H. Wu, J. Xu, Y. Wang, Z. Peng and G. Zheng, J. Mater. Chem., 2012, 22, 19821–19825 RSC.
- J. Jiang, J. Liu, X. Huang, Y. Li, R. Ding, X. Ji, Y. Hu, Q. Chi and Z. Zhu, Cryst. Growth Des., 2009, 10, 70–75 Search PubMed.
- L. Soriano, I. Preda, A. Gutiérrez, S. Palacín, M. Abbate and A. Vollmer, Phys. Rev., 2007, 75 Search PubMed.
- M. van Veenendaal and G. Sawatzky, Phys. Rev. Lett., 1993, 70, 2459–2462 CrossRef CAS PubMed.
- X. Liu, X. Wang, X. Yuan, W. Dong and F. Huang, J. Mater. Chem. A, 2016, 4, 167–172 CAS.
- X. Zhang, W. Shi, J. Zhu, W. Zhao, J. Ma, S. Mhaisalkar, T. L. Maria, Y. Yang, H. Zhang and H. H. Hng, Nano Res., 2010, 3, 643–652 CrossRef CAS.
- H. Liu, G. Wang, J. Liu, S. Qiao and H. Ahn, J. Mater. Chem., 2011, 21, 3046–3052 RSC.
- C. Yuan, J. Li, L. Hou, X. Zhang, L. Shen and X. W. D. Lou, Adv. Funct. Mater., 2012, 22, 4592–4597 CrossRef CAS.
Footnote |
| † Electronic supplementary information (ESI) available: The Experimental section, XRD results of Ni(OH)2·0.75H2O nanoflakes array on Ni foams, XRD results of NiO nanoflake powder and nickel nanoparticle powder, SEM images of Ni nanoparticles on Ni foam and NiO nanoflake array on Ni foam, CV curves of the NFA activation and NiO nanoflake array at a series of scan rate from 5 mV s−1 to 50 mV s−1. See DOI: 10.1039/c6ra01474g |
| This journal is © The Royal Society of Chemistry 2016 |

