DOI:
10.1039/C6RA01405D
(Paper)
RSC Adv., 2016,
6, 14199-14204
Fabrication of carbon-coated NiO supported on graphene for high performance supercapacitors†
Received
17th January 2016
, Accepted 22nd January 2016
First published on 26th January 2016
Abstract
In this work, carbon-coated NiO nanoparticles supported on graphene (NiO@C/graphene) have been synthesized by integrating an atomic layer deposition (ALD) technique with a simple acetylene decomposition method. Transmission electron microscopy, X-ray diffraction analysis, X-ray photoelectron spectroscopy and Raman results demonstrated that uniform carbon films were coated onto the surfaces of NiO nanoparticles supported on graphene. The electrochemical properties of the NiO@C/graphene were then investigated. The results showed that the special design enabled synergistic effects from graphene and the carbon layer to improve the electrochemical capacitive properties of NiO. As a supercapacitor electrode, the 400-NiO@C/graphene exhibits an initial specific capacitance of 408 F g−1 (1838 F g−1 for NiO) at 1 A g−1 and 68% is retained at 50 A g−1. After 2000 charge–discharge cycles, the specific capacitance improves the initial value of ∼28% at a high current density of 10 A g−1, suggesting a great potential for high performance supercapacitors.
Introduction
As a new type of energy storage device, supercapacitors provide an effective method for rapidly storing the excess electrical energy and thus are required in many areas, such as hybrid electric vehicles, large industrial equipment, consumer electronics and renewable energy power plants.1–5 Up to now, a considerable number of investigations have been focused on the design and synthesis of electrode materials because the performance of the supercapacitors depends intimately on the physical and chemical properties of their electrode materials.6 Among the various electrode materials, pseudocapacitive NiO based on faradic redox charge storage is considered to be relatively promising because of its high theoretical specific capacitance (∼2584 F g−1, within 0.5 V), rich resources and inexpensive cost.7–11 However, single metal oxides or inorganic salts usually lead to low specific capacitance, inferior rate performance and poor cycling stability in practical applications attributed to their densely packed structure, inherently poor electrical conduction and drastic volume change during the cycling process.12,13
In recent years, many researchers have made great efforts to address these problems. Among them, combining NiO with conductive carbon materials is considered to be an effective method to improve its electrochemical performance.14–16 As a prominent representative of carbon species, graphene displays outstanding properties that make them superior candidates for electrochemical applications, namely excellent electrical conductivity, high specific surface area and good stability.13,17–19 However, traditional methods to incorporate graphene with NiO could not fully capture the properties of graphene due to aggregation, phase separation, and poor connectivity between metal oxide and graphene. Moreover, it is also difficult to inhibit volume change of the bare NiO during the electrochemical process.20–23
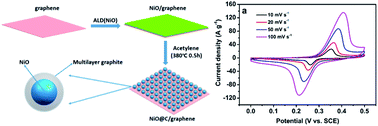
Herein, we report a feasible strategy for the synthesis of the carbon-coated NiO nanoparticles supported on graphene (NiO@C/graphene) and investigate their application as supercapacitor electrodes. The key difference of this method compared with previous reports is the design to enable synergistic effects from both graphene and carbon layer by using carbon layer as a protective outwear for the inhibition of volume change of NiO nanoparticles and graphene as a conductive substrate to provide electron conductance and high specific surface area. The process for preparation of the NiO@C/graphene nanocomposites can be divided into two steps as illustrated in Scheme 1. First, the NiO/graphene was synthesized through an atomic layer deposition (ALD) technique,24–27 in which NiO films can be uniformly deposited on the graphene nanosheets and integrated firmly with the surface of graphene. Second, the growth of NiO@C/graphene was performed at 380 °C for 30 min with acetylene as carbon source at atmospheric pressure.
 |
| Scheme 1 Schematic diagram of the preparation of the NiO@C/graphene composite. | |
Experimental
Preparation
Commercial graphene (Sinocarbon, ≥98.0 wt%) was used in this work. The ALD process was carried out in a home-made, closed type, hot-wall ALD reactor. Nickelocene (NiCp2) and O3 were used as precursors. Prior to ALD, the graphene was dispersed in ethanol by ultrasonic agitation and then dropped onto a quartz wafer. After being air-dried, the NiO nanoparticles were deposited by sequential exposure of the graphene to NiCp2 and O3. The deposition temperature was maintained at 150 °C, and NiCp2 was kept at 70 °C. After the ALD process, the samples were transferred to a furnace and heated at 380 °C in acetylene atmosphere for 0.5 h. Finally, the sample was collected and is denoted as X-NiO@C/graphene, where X means the cycle number of the NiO ALD.
Characterization
The X-ray diffraction (XRD) patterns were collected on a Bruker D8 Advance X-ray diffractometer with Cu Kα radiation (λ = 1.54178 Å) using a 40 kV operation voltage and 40 mA current. X-ray photoelectron spectroscopy (XPS) data were acquired using a PHI5000 Versaprobe-II spectrometer with a monochromatic Al Kα (1486.6 eV) source. Raman spectroscopy was performed on a Renishaw inVia Reflex Raman microscope using 514 nm green laser excitation. The transmission electron microscopy (TEM) and high-resolution TEM (HRTEM) images were taken on a JEOL JEM-2100 microscope instrument at an acceleration voltage of 200 kV. Thermogravimetric (TG) results were obtained by a thermal analysis system (Q600, TA, America) using ca. 5.0 mg of samples and a heating rate of 10 °C min−1 in air.
Electrochemical tests
The electrochemical tests were carried out in a CHI660D electrochemical workstation using a three-electrode system containing 2 M KOH electrolyte solution at room temperature. The working electrode was prepared by mixing active material, acetylene black, and polyvinylidene fluoride (PVDF, solve in N-methyl-2-pyrrolidone with a solid content of 10 g L−1) at a weight ratio of 8
:
1
:
1 and coated onto nickel foam. Saturated calomel electrode (SCE) and platinum foil were used as the reference and counter electrodes, respectively.
Results and discussion
XRD analysis was carried out to investigate the crystal phases of the as-synthesized products. Fig. 1a presents the XRD patterns of graphene, 400-NiO/graphene and 400-NiO@C/graphene. For the graphene, the diffraction peak at 24.7° can be attributed to the (002) planes of a graphitic structure with short-range order in stacked graphene sheets. Both 400-NiO@C/graphene and 400-NiO/graphene show the diffraction peaks at 2θ = 37.1°, 43.1° and 62.6° corresponding to the (111), (200) and (220) reflections of face-centered cubic NiO, respectively (JCPDS card 65-2901). Moreover, it is interesting that the (003) plane of NiO2 can be found for 400-NiO/graphene located at 18.6°, indicating that the strong oxidation ability of O3 in the present system likely induces higher oxidized forms of Ni. While for 400-NiO@C/graphene, no characteristic peaks of NiO2 can be detected possibly because NiO2 is converted into NiO by reduction with acetylene. There are no obvious carbon peaks in the XRD patterns of 400-NiO@C/graphene and 400-NiO/graphene, which is probably due to the poor crystallinity of carbon layer. The Raman spectroscopy is applied to further characterize the surface functionalities of samples. As shown in Fig. 1b, two broad peaks at 1350 and 1591 cm−1 are found in the three samples and can be assigned to the D and G bands of carbon materials, respectively. In the Raman spectra, the G band arises from the E2g stretching mode of graphite, which is associated with the vibration of sp2 bonded carbon atoms, whereas the D band reflects the graphite-structure sp3 defects. For 400-NiO@C/graphene, the position of the G band displays a blue shift in contrast to the well crystalline graphite materials (1575 cm−1), which suggests the presence of some defects.28,29
 |
| Fig. 1 (a) XRD patterns and (b) Raman spectra of graphene, 400-NiO/graphene and 400-NiO@C/graphene. | |
The XPS measurement was carried out to further analyze the composition and chemical state of elements in the samples. As shown in Fig. 2a and b, the XPS survey spectra suggest the presence of C, Ni and O elements in both 400-NiO/graphene and 400-NiO@C/graphene. After coated with carbon layer, it can be seen that the 400-NiO@C/graphene exhibits a stronger C 1s peak than 400-NiO/graphene. High-resolution XPS spectra of C 1s are shown in Fig. 2c and d. There are three types of carbon bonds for both 400-NiO/graphene and 400-NiO@C/graphene: C–C (284.8 eV), C–O (286.1 eV) and O–C
O (288.5 eV).18 Compare to that of the 400-NiO/graphene, the 400-NiO@C/graphene are almost non-existent oxygen functional groups mainly due to the reduction of acetylene during the heating process. In the Ni 2p spectra (Fig. 2e and f), the peaks appeared at 855.8 eV and 873.6 eV can be assigned to Ni 2p2/3 and Ni 2p1/2 spin–orbits of NiO, respectively.30 Different from 400-NiO/graphene, the 400-NiO@C/graphene displays two extra obvious peaks located at 853.2 eV and 870.4 eV, which can be ascribed to zero-valent nickel, suggesting the formation of Ni–C bonds on the surface of 400-NiO@C/graphene.31,32
 |
| Fig. 2 XPS survey spectra for (a) 400-NiO/graphene and (b) 400-NiO@C/graphene. High-resolution XPS spectra of C 1s for (c) 400-NiO/graphene and (d) 400-NiO@C/graphene. High-resolution XPS spectra of Ni 2p for (e) 400-NiO/graphene and (f) 400-NiO@C/graphene. | |
The structure and morphology of the graphene, 400-NiO/graphene and 400-NiO@C/graphene were further researched by TEM. The pristine graphene displays typical curved 2D structures with many stripelike crumples (Fig. 3a). After ALD process, a homogeneous NiO thin film on the surface of graphene can be observed (Fig. 3b and c). The lattice fringes from HRTEM image (Fig. 3d) also reveal the features of face-centered cubic NiO. After a heating process in acetylene, the low resolution TEM images show that the NiO films can be converted to uniform nanoparticles films (Fig. 3e and f). The inset in Fig. 3f provides the corresponding selected area electron diffraction (SAED) pattern recorded on an individual 400-NiO@C/graphene sheet. Several rings can be assigned to diffraction planes of the face-centered cubic phase of NiO, in agreement with the XRD data. The high-magnified TEM image further indicates that the NiO particles are coated by uniform carbon shells (Fig. 3g). The formed NiO@C core–shell structures are clearly visible due to their different contrasts. The average diameters of NiO nanoparticles measured by TEM images are about 5.2 nm (Fig. S1†). Fig. 3h shows a HRTEM image of an individual particle, in which the crystalline NiO is coated with about 4 nm thick carbon layer. It can be seen that the carbon layers still have some defects from the lattice fringes of shell part, which is consistent with the Raman results. The core part shows an interplanar distance of 0.209 nm, which can be indexed as (200) crystal plane of NiO.
 |
| Fig. 3 (a) TEM images of pristine graphene. (b and c) TEM and (d) HRTEM images of 400-NiO/graphene sample. (e–g) TEM and (h) HRTEM images of 400-NiO@C/graphene sample. | |
Actually, the growth temperature has an important influence on the structures of samples. When the reaction was conducted at 450 °C, the XRD demonstrates that only Ni diffraction peaks can be found (Fig. S2†). As reported previously, acetylene undergoes slight decomposition at high temperature, leading to the release of reducing hydrogen.33 Therefore, the present Ni should be from the NiO reduced by the produced hydrogen. Furthermore, instead of carbon-coated structures, plenty of fiber-like structures are found in the surface of graphene as Ni nanoparticles can play the role of catalysts to decompose acetylene for the growth carbon nanofibers (Fig. S3†).
The as-prepared 400-NiO@C/graphene was fabricated as supercapcitor electrodes to measure its capacitive performance. Cyclic voltammetry (CV), galvanostatic charge–discharge and electrochemical impedance spectroscopy (EIS) measurements were carried out in 2 M KOH solution at room temperature.
Fig. 4a shows the CV curves of the 400-NiO@C/graphene at different scan rates with a potential window of between 0 and 0.5 V (vs. SCE). The obvious redox peaks can be observed on each CV curve, which are resulted from the quasi-reversible redox reactions taking place on the surface or near surface of NiO nanoparticles, as shown in eqn (1).34 With increasing scan rate, the current response enhances gradually and the shapes of CV curves have almost no significant change, indicating that the electrode of 400-NiO@C/graphene has a good rate performance. Besides, the potential of redox peaks shift towards both ends, which is associated with some kinetic irreversibility in the electrochemical system. The CV curves of 400-NiO/graphene are shown in Fig. 4b, it can be clear seen that the shape of CV curve at 100 mV s−1 show slightly change, suggesting an inferior rate performance.
|
NiO + OH− ↔ NiOOH + e−
| (1) |
 |
| Fig. 4 CV curves of (a) 400-NiO@C/graphene and (b) 400-NiO/graphene at different scan rates. Galvanostatic charge–discharge curves of (c) 400-NiO@C/graphene and (d) 400-NiO/graphene at various current densities. Calculated specific capacitance for (e) the composites and (f) the NiO contribution in these composites as a function of current density. | |
Fig. 4c and d display the galvanostatic charge–discharge curves of 400-NiO@C/graphene and 400-NiO/graphene at different current densities, respectively. Consistent with the CV results, the 400-NiO@C/graphene presents a typical pseudo-capacitive behavior with highly nonlinear discharge curves. The almost same charge and discharge time means a high reversibility of the redox reaction. Whereas, the 400-NiO/graphene exhibits a low coulombic efficiency at 5 A g−1 and the potential window cannot reach 0.45 V at lower current density. The specific capacitance can be calculated from the discharge curves using the following eqn (2):35
where
Cm,
I,
t, Δ
V,
m are the specific capacitance (F g
−1), discharge current (A), discharge time (s), potential window (V) and mass of active material (g), respectively. The relationship between specific capacitance and current density is shown in
Fig. 4e. It is can be clearly seen that the specific capacitances of both 400-NiO@C/graphene and 400-NiO/graphene decrease gradually with the increased discharge current density due to the insufficient redox reaction time at high current density. Although the 400-NiO/graphene shows a higher specific capacitance of 445 F g
−1 at 5 A g
−1, the value belows to 400-NiO@C/graphene start from 10 A g
−1. For the 400-NiO@C/graphene, a specific capacitance of 408 F g
−1 at 1 A g
−1 can be obtained. Even at sky-high current density of 50 A g
−1, the 400-NiO@C/graphene electrode still delivers a high value of 277 F g
−1 (∼68% retention), which obviously exceeds to 400-NiO/graphene and most of the previously reported NiO-based composites,
36,37 displaying an excellent rate performance.
Fig. 4f depicts the calculated specific capacitance for NiO content at different current density according to the TGA results (Fig. S4
†). Apparently, the 400-NiO@C/graphene is far better than the 400-NiO/graphene, which demonstrates that the NiO@C core–shell structure can remarkably improve the utilization efficiency of NiO. Considering only 22.2 wt% of NiO contained in the 400-NiO@C/graphene composites (Fig. S4
†), the specific capacitance of the NiO nanoparticles alone can approach 1838 F g
−1 at 1 A g
−1.
ALD can deposit extremely conformal thin films with atomic-scale control.38,39 Therefore, we also prepared the sample with different cycles by same process to adjust the NiO thickness and studied their electrochemical performance. It can be found that the sample with 400 cycles delivers higher specific capacitance than others, suggesting a best matching of NiO content with carbon/graphene (Fig. S5†).
To further explore the electrochemical characteristics of 400-NiO@C/graphene and 400-NiO/graphene electrodes, the EIS measurement was performed (Fig. 5). Two distinct regions can be easily recognized from the Nyquist plot, an arc at a high frequency region and a straight line at a low frequency region. The intersection with the real axis (Z′) represents the equivalent series resistance (Rs) at the high frequency area. The semicircle corresponds to the pseudo-charge transfer resistance (Rct). Obviously, the 400-NiO@C/graphene electrode displays smaller Rs and Rct values, implying a good electrical conductivity, which is beneficial to the rate performance. Moreover, at the low frequency area, the closer vertical line suggests a nearly ideal capacitive behavior and low diffusion resistance.
 |
| Fig. 5 Nyquist plot of 400-NiO@C/graphene and 400-NiO/graphene. | |
The cycling stability of 400-NiO@C/graphene electrode was tested by galvanostatic charge–discharge at 10 A g−1 for 2000 cycles. As shown in Fig. 6a, the specific capacitance increases from initial 356 F g−1 to about 455 F g−1 (∼28% improvement) after 2000 cycles (Fig. 6b), presenting a slow upward trend, which should be ascribed to the increased effective interfacial area between NiO and electrolyte with the increased reaction time.
 |
| Fig. 6 (a) Cycling performance of 400-NiO@C/graphene measured at 10 A g−1 for 2000 cycles. (b) Galvanostatic charge–discharge curves of the last 4 cycles. | |
In the present work, the excellent capacitive performance can be explained in the following reasons. First, the introduction of graphene can significantly improve the overall electrical conductivity of composite (as proved by EIS), which facilitates to the charge transport and ion diffusion. Second, the carbon shells can play a cushion role for volume expansion of NiO during the charge–discharge process, enhancing the cycling stability. Third, ALD is a highly controllable coating technology that can produce NiO film with strong bonding force and uniform thickness. Thus, the obtained NiO@C after the heating process integrates firmly with the surface of graphene without agglomeration, further improving the utilization of active materials.
Conclusions
In summary, a controllable method to fabricate NiO@C/graphene composite nanostructures was developed and further explored for the application of supercapacitor electrode. Owing to perfect synergistic effects of graphene and carbon layer, the 400-NiO@C/graphene exhibits superior electrochemical properties including excellent rate performance and outstanding cycling stability when used as supercapacitor electrode materials. The initial specific capacitance of 400-NiO@C/graphene can reach 408 F g−1 (1838 F g−1 for NiO) at 1 A g−1 and still maintain 68% at 50 A g−1. After 2000 charge–discharge cycles, the specific capacitance improves the initial value of ∼28% at a high current density of 10 A g−1. These excellent capacitive performances demonstrate that NiO@C/graphene is a very promising material for supercapacitor applications.
Acknowledgements
This work was supported by the National Natural Science Foundation of China (11564011, 51362010), the Natural Science Foundation of Hainan Province (514207, 514212, 20152018), the Scientific Research Projects of Colleges and Universities of Hainan Province (HNKY2014-14), and the Scientific Research Projects of Hainan University (kyqd1502).
Notes and references
- P. Simon and Y. Gogotsi, Nat. Mater., 2008, 7, 845–854 CrossRef CAS PubMed.
- G. Zhang and X. W. D. Lou, Adv. Mater., 2013, 25, 976–979 CrossRef CAS PubMed.
- R. Rakhi, W. Chen, D. Cha and H. Alshareef, Nano Lett., 2012, 12, 2559–2567 CrossRef CAS PubMed.
- G. Q. Zhang, H. B. Wu, H. E. Hoster, M. B. Chan-Park and X. W. D. Lou, Energy Environ. Sci., 2012, 5, 9453–9456 CAS.
- A. S. Arico, P. Bruce, B. Scrosati, J.-M. Tarascon and W. Van Schalkwijk, Nat. Mater., 2005, 4, 366–377 CrossRef CAS PubMed.
- G. Wang, L. Zhang and J. Zhang, Chem. Soc. Rev., 2012, 41, 797–828 RSC.
- Y. Zhang and Z. Guo, Chem. Commun., 2014, 50, 3443–3446 RSC.
- W. Yu, X. Jiang, S. Ding and B. Q. Li, J. Power Sources, 2014, 256, 440–448 CrossRef CAS.
- G. S. Gund, D. P. Dubal, S. S. Shinde and C. D. Lokhande, ACS Appl. Mater. Interfaces, 2014, 6, 3176–3188 CAS.
- W. Ji, J. Ji, X. Cui, J. Chen, D. Liu, H. Deng and Q. Fu, Chem. Commun., 2015, 51, 7669–7672 RSC.
- G. Cheng, W. Yang, C. Dong, T. Kou, Q. Bai, H. Wang and Z. Zhang, J. Mater. Chem. A, 2015, 3, 17469–17478 CAS.
- Y.-z. Zheng, H.-y. Ding and M.-l. Zhang, Mater. Res. Bull., 2009, 44, 403–407 CrossRef CAS.
- J. Zhu, S. Chen, H. Zhou and X. Wang, Nano Res., 2012, 5, 11–19 CrossRef CAS.
- M. Zhi, C. Xiang, J. Li, M. Li and N. Wu, Nanoscale, 2013, 5, 72–88 RSC.
- H. Jiang, J. Ma and C. Li, Adv. Mater., 2012, 24, 4197–4202 CrossRef CAS PubMed.
- A. Paravannoor, S. V. Nair, P. Pattathil, M. Manca and A. Balakrishnan, Chem. Commun., 2015, 51, 6092–6095 RSC.
- Q. Liao, N. Li, S. Jin, G. Yang and C. Wang, ACS Nano, 2015, 9, 5310–5317 CrossRef PubMed.
- Z. Gao, J. Wang, Z. Li, W. Yang, B. Wang, M. Hou, Y. He, Q. Liu, T. Mann and P. Yang, Chem. Mater., 2011, 23, 3509–3516 CrossRef CAS.
- Z. Fan, J. Yan, L. Zhi, Q. Zhang, T. Wei, J. Feng, M. Zhang, W. Qian and F. Wei, Adv. Mater., 2010, 22, 3723–3728 CrossRef CAS PubMed.
- N. B. Trung, T. Van Tam, D. K. Dang, K. F. Babu, E. J. Kim, J. Kim and W. M. Choi, Chem. Eng. J., 2015, 264, 603–609 CrossRef CAS.
- B. Zhao, J. Song, P. Liu, W. Xu, T. Fang, Z. Jiao, H. Zhang and Y. Jiang, J. Mater. Chem., 2011, 21, 18792–18798 RSC.
- Y. Jiang, D. Chen, J. Song, Z. Jiao, Q. Ma, H. Zhang, L. Cheng, B. Zhao and Y. Chu, Electrochim. Acta, 2013, 91, 173–178 CrossRef CAS.
- Y. Liu, G. Yuan, Z. Jiang, Z. Yao and M. Yue, J. Alloys Compd., 2015, 618, 37–43 CrossRef CAS.
- G. Wang, Z. Gao, G. Wan, S. Lin, P. Yang and Y. Qin, Nano Res., 2014, 7, 704–716 CrossRef CAS.
- M. Liu, X. Li, S. K. Karuturi, A. I. Y. Tok and H. J. Fan, Nanoscale, 2012, 4, 1522–1528 RSC.
- S. Boukhalfa, K. Evanoff and G. Yushin, Energy Environ. Sci., 2012, 5, 6872–6879 CAS.
- G. Wang, Z. Gao, S. Tang, C. Chen, F. Duan, S. Zhao, S. Lin, Y. Feng, L. Zhou and Y. Qin, ACS Nano, 2012, 6, 11009–11017 CrossRef CAS PubMed.
- A. Ferrari, J. Meyer, V. Scardaci, C. Casiraghi, M. Lazzeri, F. Mauri, S. Piscanec, D. Jiang, K. Novoselov and S. Roth, Phys. Rev. Lett., 2006, 97, 187401 CrossRef CAS PubMed.
- F. Tuinstra and J. L. Koenig, J. Chem. Phys., 1970, 53, 1126–1130 CrossRef CAS.
- J. Yan, Z. Fan, W. Sun, G. Ning, T. Wei, Q. Zhang, R. Zhang, L. Zhi and F. Wei, Adv. Funct. Mater., 2012, 22, 2632–2641 CrossRef CAS.
- N. Mahata, A. F. Cunha, J. J. Órfão and J. L. Figueiredo, ChemCatChem, 2010, 2, 330–335 CrossRef CAS.
- N. Mahata, A. F. Cunha, J. J. Órfão and J. L. Figueiredo, Chem. Eng. J., 2012, 188, 155–159 CrossRef CAS.
- G. Wang, G. Ran, G. Wan, P. Yang, Z. Gao, S. Lin, C. Fu and Y. Qin, ACS Nano, 2014, 8, 5330–5338 CrossRef CAS PubMed.
- S.-I. Kim, J.-S. Lee, H.-J. Ahn, H.-K. Song and J.-H. Jang, ACS Appl. Mater. Interfaces, 2013, 5, 1596–1603 CAS.
- W. Ni, B. Wang, J. Cheng, X. Li, Q. Guan, G. Gu and L. Huang, Nanoscale, 2014, 6, 2618–2623 RSC.
- B. Zhao, H. Zhuang, T. Fang, Z. Jiao, R. Liu, X. Ling, B. Lu and Y. Jiang, J. Alloys Compd., 2014, 597, 291–298 CrossRef CAS.
- C. Wu, S. Deng, H. Wang, Y. Sun, J. Liu and H. Yan, ACS Appl. Mater. Interfaces, 2014, 6, 1106–1112 CAS.
- G. Wang, X. Peng, L. Yu, G. Wan, S. Lin and Y. Qin, J. Mater. Chem. A, 2015, 3, 2734–2740 CAS.
- G. Wan, G. Wang, X. Huang, H. Zhao, X. Li, K. Wang, L. Yu, X. Peng and Y. Qin, Dalton Trans., 2015, 44, 18804–18809 RSC.
Footnote |
† Electronic supplementary information (ESI) available: TEM images, size distribution analysis of NiO, XRD pattern and TGA spectra. See DOI: 10.1039/c6ra01405d |
|
This journal is © The Royal Society of Chemistry 2016 |
Click here to see how this site uses Cookies. View our privacy policy here.