Yong Pan*ab,
Ting Lia,
Jie Chenga,
Donatello Telescac,
Jeffrey I. Zinkb and
Juncheng Jianga
aJiangsu Key Laboratory of Hazardous Chemicals Safety and Control, Nanjing Tech University, Nanjing, Jiangsu 210009, China. E-mail: yongpan@njtech.edu.cn
bDepartment of Chemistry & Biochemistry, University of California, Los Angeles, California 90095, USA
cDepartment of Biostatistics, University of California, Los Angeles, California 90095, USA
First published on 23rd February 2016
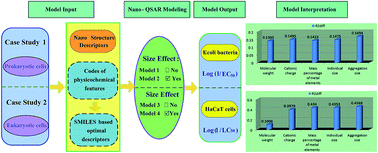
Computational approaches have evolved as efficient alternatives to understand the adverse effects of nanoparticles on human health and the environment. The potential of using Quantitative Structure–Activity Relationship (QSAR) modeling to establish statistically significant models for predicting the cytotoxicity of various metal oxide (MeOx) nanoparticles (NPs) has been investigated. A novel kind of nanospecific theoretical descriptor was proposed by integrating codes of certain physicochemical features into SMILES-based optimal descriptors to characterize the nanostructure information of NPs. The new descriptors were then applied to model MeOx NP cytotoxicity to both Escherichia coli bacteria and HaCaT cells for comparison purposes. The effects of size variation on the cytotoxicity to both types of cells were also investigated. The four resulting QSAR models were then rigorously validated, and extensively compared to other previously published models. The results demonstrated the robustness, validity and predictivity of these models. Predominant nanostructure factors responsible for MeOx NP cytotoxicity were identified through model interpretation. The results verified different mechanisms of nanotoxicity for these two types of cells. The proposed models can be expected to reliably predict the cytotoxicity of novel NPs solely from the newly developed descriptors, and provide guidance for prioritizing the design and manufacture of safer nanomaterials with desired properties.
The evaluation of the toxic effects was usually performed using experimental in vivo toxicological studies and in vitro short-term cell-based assays. However, toxicological tests are costly, laborious, time-consuming and sometimes unethical, making it impractical to test all the NPs-based products available. Therefore, there is an imperative need to develop efficient computational in silico methods, such as Quantitative Structure–Activity Relationship (QSAR), to screen and predict the toxicity of NPs in a rapid and cost-efficient way prior to their synthesis.
QSAR is a mathematical method that relates the properties of interest to the molecular structures of chemicals which are represented by a variety of molecular descriptors. This computational method is based on the assumption that the variation in the properties or biological activities of a chemical is determined by the changes in its molecular structure. QSAR can be expected to capture the complex relationships between the molecular structures (microscopic) and properties or activities (macroscopic) of chemicals without requiring detailed knowledge of the mechanisms of interaction. Also, it is time- and money-saving, and could reduce the number of animal testing as well as reveal the toxicity mechanism. Consequently, QSAR is widely applied in drug discovery and physicochemical properties modeling, which have been extensively reviewed elsewhere.19–22 Its growing importance is also accepted by regulators for the assessment and management of new industrial chemicals, such as the European REACH as well as the Australian NICNAS.
Recently, more and more investigations revealed that there is a strong need to extend the traditional QSAR paradigm to NPs and to develop “nano-QSAR” models for predicting the activity/property of newly synthesized NPs as well as guiding the experimental design of new NPs with improved activity.2,23–25 In the report on nanosafety published in 2013 by the European Commission, development of appropriate nano-QSAR models to identify high concern NPs and predict relevant endpoints of toxicity and ecotoxicity had been considered to be of prime importance for NPs hazard assessment. However, although QSAR has achieved substantial progress in recent years for modeling the traditional chemicals, its application to NPs is still limited. The reasons may be mainly attributed to NPs' more complex and less amenable features to “nano” structure characterization, endpoint description, and physical interpretation than those for traditional chemicals. Particularly, because the exact composition of a given NP is usually not known and some highly complex atoms may be included in large three-dimensional nano-structures, the classical molecular descriptors are unable to express specificity of “nano” structures, leading to the lack of sufficient molecular descriptors appropriate for nano-QSAR modeling.
Recently, a few efforts have been made to develop nano-QSAR models to correlate nano-structures with activities of NPs, such as cytotoxicity,26–30 cellular uptake,31–35 and smooth cell apoptosis.35 The nano-structure characteristics of NPs can be usually described by either experimentally measured physicochemical properties (i.e. size, shape, surface area, zeta potential, overall charge) or theoretically calculated molecular descriptors (i.e. quantum-mechanical descriptors, periodic table-based descriptors, SMILES based descriptors). However, it should be mentioned that in most cases the determination of the experimental descriptors itself is always laborious and time-consuming, thus the data of these descriptors are always unknown, especially for the NPs which are newly developed or even not yet synthesized. As for the most employed quantum-mechanical descriptors, certain quantum-chemical background is required to be able to perform the calculations, and the descriptors are a little bit computationally demanding for such large NP systems comprising hundreds of atoms. Besides, most existing studies have been carried out on modeling toxicity of NPs to prokaryotic systems (i.e. Escherichia coli bacteria, E. coli), while very few studies have focused on toxicity to eukaryotic systems. Information is only limited on the modeling of toxicity of metal oxide (MeOx) NPs to a human keratinocyte (HaCaT) cell line for dermal exposure.28,30
In this study, we aim to present new promising nano-specific descriptors to develop reliable, predictive and freely-accessible nano-QSAR models for predicting the cytotoxicity of MeOx NPs. The new descriptors were improved and developed from the traditional SMILES-based optimal descriptors, and capable of characterizing the structural and chemical properties of MeOx NPs. The new descriptors were applied to model MeOx NPs' cytotoxicity to both E. coli bacteria (prokaryotic cells) and HaCaT cells (eukaryotic cells) for comparison purpose, leading to models with high statistical quality as well as acceptable interpretability. Moreover, the effect of size variation on cytotoxicity of MeOx NPs to both cells were considered and investigated here, since most of the existing researches always nullify a typical problem that many activities or properties of NPs change for different size ranges. After implementing extensive validation using multiple strategies, the obtained QSAR models are expected to provide critical support for predicting the toxicological effects of novel NPs solely from their nano structures, as well as designing and manufacturing safer NPs with desired properties.
However, after a critical analysis of the results obtained from the developed nano-QSAR models, some drawbacks of the used SMILES-based descriptors can be found for describing the endpoints for some NPs. For example, some different MeOx NPs may contain the same descriptor values and thus lead to the same predicted endpoint values for the developed models, although their experimental endpoint values might be quite different indeed. Moreover, interpretability of nano-QSAR models developed from SMILES based descriptors is limited, since such descriptors are obtained solely from SMILES notations. Consequently, to overcome the defect of traditional SMILES-based optimal descriptors, some additional features could be considered and included into the descriptors to predict and interpret the endpoint of NPs more accurately.
Hence in this study, a novel kind of nano-structure descriptor is proposed to build up predictive models for cytotoxicty of MeOx NPs. Some basic physicochemical features, such as molecular weight, cationic charge, and mass percentage of metal elements, were taken into account and included into the SMILES based optimal descriptors to improve the characterization of nano-structure information. That is to say, MeOx NPs can be represented by SMILES-based optimal descriptors integrating codes of certain physicochemical features. We named the corresponding new descriptors as Improved SMILES-Based Optimal Descriptors, which are calculated as following:
| DCW(threshold, Nepoch) = ∑ CW(Sk) + ∑ CW(SSk) + ∑ CW(Ck) + ∑ CW(CCk) |
The SMILES can be obtained by common software like ChemSketch, and the codes of features can be defined by the following scheme:36,37
(I) Standardization of feature Xk based on the formula
(II) Distinction of physicochemical features in light of scale (Fig. 1) into one of classes from 1 to 9. Liters of A, B, C represented molecular weight, cationic charge, and mass percentage of metal elements, respectively.
![]() | ||
| Fig. 1 Distinction of standardized physicochemical features into classes 1 to 9 according to its value. | ||
The construction of Sk (or Ck) and SSk (or CCk) could be represented as the following:
| ABCDE → A, B, C, D, E |
| ABCDE → AB, BC, CD, DE |
The optimal descriptors are then calculated with the correlation weights of active physicochemical features by the Monte Carlo optimization. The threshold is coefficient for classification of features into two classes (noise and active). The Nepoch is the number of epochs of the Monte Carlo optimization.
The optimization is the following:37 for each attribute, CW is determined initially by setting the start values of all CWs to 1 ± 01* random. The random is generator of random value of range (0, 1). The regular order of number of attributes (i.e., 1, 2, 3, 4, 5,…) is replaced by a random sequence (e.g., 3, 1, 5, 2, 4,…).
A starting correlation coefficient (R1) between endpoint and descriptor on the training set is calculated. In a generated random sequence, each attribute correlation weight CWi was modified with the algorithm.
| (1) ΔCWi := 0.001 × CWi; Eps := 0.01 × ΔCWi; |
| (2) CWi := CWi + ΔCWi; |
(3) Calculation of R2 (the correlation coefficient after modifying CWi);
(4) If R2 > R1, then R1 := R2; go to step 2;
| (5) CWi := CWi − ΔCWi; |
| (6) ΔCWi := −0.5 × ΔCWi |
(7) If absolute value (ΔCWi) > Eps then go to step 2.
The steps of 1–7 are carried out for all CWs, and one can repeat this algorithm from point of generation of random sequence. If the increasing of correlation coefficient becomes less than 0.001, the process will stop.
Data on these features of various MeOx NPs can be easily obtained from molecular formula and information acquired from periodic table, which are presented in the ESI.†
Moreover, since size has been proven to play an important role for both bioactivity of NPs38 and their toxicity,39 understanding its effect on activities of NPs is necessary to design NPs with desired features. Interestingly, the widely used quantum-chemical descriptors for nanotoxicity modeling were always calculated based on the assumption that the simplified clusters must be of the same size. Moreover, most previous studies40–42 revealed that the most significant size-dependent changes of NPs' properties occur below about 5 nm, while the particle size did not affect activity for NPs with sizes between 15 and 90 nm, since all nanopowders resulted in similarly sized aggregated particles in water suspension, regardless of the powder size.43 Therefore, the property changes for NPs with sizes between 15 and 90 nm had always been neglected.
In this study, in order to further verify the size effects of MeOx NPs on their cytotoxicity, we also included the individual sizes and aggregation sizes as the codes of physicochemical features into the new improved descriptors to develop corresponding QSAR models for comparison purpose. Experimental data on the individual sizes and aggregation sizes of various MeOx NPs are taken from the literature28 and presented in the ESI.†
In this way, two different forms of the new improved SMILES-based optimal descriptors (namely size-independent and size-dependent) were employed to model the cytotoxicity to both E. coli bacteria and HaCaT cells of diverse MeOx NPs, respectively.
| MeOx | Experimental values | Model 1 | Model 2 | Set | ||
|---|---|---|---|---|---|---|
| DCW | Predicted values | DCW | Predicted values | |||
| Al2O3 | 2.49 | 9.284 | 2.500 | 17.354 | 2.456 | Training |
| Bi2O3 | 2.82 | 11.128 | 2.990 | 20.833 | 2.950 | Training |
| CuO | 3.2 | 12.316 | 3.306 | — | — | Training |
| Fe2O3 | 2.29 | 9.671 | 2.603 | 16.725 | 2.367 | Training |
| In2O3 | 2.81 | 9.877 | 2.658 | 19.201 | 2.718 | Training |
| SiO2 | 2.2 | 7.160 | 1.935 | 15.263 | 2.159 | Training |
| SnO2 | 2.01 | 7.754 | 2.093 | 14.236 | 2.014 | Training |
| TiO2 | 1.74 | 7.013 | 1.896 | 12.475 | 1.764 | Training |
| Y2O3 | 2.87 | 9.877 | 2.658 | 19.831 | 2.808 | Training |
| ZnO | 3.45 | 12.316 | 3.306 | 24.314 | 3.444 | Training |
| CoO | 3.51 | 12.376 | 3.322 | 25.659 | 3.635 | Test |
| Cr2O3 | 2.51 | 9.796 | 2.636 | 17.984 | 2.546 | Test |
| La2O3 | 2.87 | 10.752 | 2.889 | 18.485 | 2.617 | Test |
| NiO | 3.45 | 12.974 | 3.481 | 23.054 | 3.265 | Test |
| Sb2O3 | 2.64 | 8.738 | 2.354 | 19.201 | 2.718 | Test |
| V2O3 | 3.14 | 9.695 | 2.609 | 19.330 | 2.737 | Test |
| ZrO2 | 2.15 | 7.160 | 1.935 | 13.735 | 1.942 | Test |
| MeOx | Experimental values | Model 3 | Model 4 | Set | ||
|---|---|---|---|---|---|---|
| DCW | Predicted values | DCW | Predicted values | |||
| Al2O3 | 1.85 | 20.318 | 1.818 | 23.842 | 1.856 | Training |
| Bi2O3 | 2.5 | 26.579 | 2.468 | 32.010 | 2.491 | Training |
| Cr2O3 | 2.3 | 24.772 | 2.280 | 29.555 | 2.300 | Training |
| In2O3 | 2.92 | 31.196 | 2.947 | 37.523 | 2.919 | Training |
| La2O3 | 2.87 | 30.570 | 2.882 | 36.861 | 2.868 | Training |
| NiO | 2.49 | 28.849 | 2.704 | 31.841 | 2.478 | Training |
| Sb2O3 | 2.31 | 25.055 | 2.310 | 29.764 | 2.316 | Training |
| SnO2 | 2.67 | 28.619 | 2.680 | 34.274 | 2.667 | Training |
| V2O3 | 2.24 | 24.203 | 2.221 | 28.698 | 2.233 | Training |
| WO3 | 2.56 | 27.409 | 2.554 | 33.026 | 2.570 | Training |
| ZnO | 3.32 | 33.342 | 3.170 | 42.750 | 3.326 | Training |
| ZrO2 | 2.02 | 22.159 | 2.009 | 26.010 | 2.024 | Training |
| Mn2O3 | 2.64 | 28.312 | 2.648 | — | — | Training |
| CoO | 2.83 | 25.846 | 2.392 | 30.912 | 2.406 | Test |
| Fe2O3 | 2.05 | 21.794 | 1.971 | 24.791 | 1.930 | Test |
| SiO2 | 2.12 | 21.056 | 1.895 | 24.716 | 1.924 | Test |
| TiO2 | 1.76 | 21.282 | 1.918 | 22.564 | 1.756 | Test |
| Y2O3 | 2.21 | 21.635 | 1.955 | 25.632 | 1.995 | Test |
Both squared correlation coefficient for fitting (R2) and Root-Mean-Square Error (RMSE) were employed to indicate the model calibration ability, while both the internal and external validations were employed for predictive capability. Here the most reliable internal validation method of leave-many-out (LMO, 20% out) cross-validation (QLMO2) was employed to indicate the model robustness and internal predictive ability. The external validation is a significant and necessary validation method used to determine both the generalizability and true predictive capability of the QSAR models for new NPs. Here a separate test sub-set of each dataset which was kept out during the training process was used for external validation. Moreover, in order to avoid obtaining the QSAR results by chance or obtaining non-general conclusions, all the developed models were tested on a sufficiently large number of compounds (20% of the dataset) in the test sub-sets.45 The developed models were also subjected to Y-randomization test to check the model reliability and robustness.46–49
| log(1/EC50) = 0.0321 (±0.1443) + 0.2658 (±0.0141) × DCW(6,11), n = 10, R2 = 0.8891, QLMO2 = 0.8378, s = 0.179, F = 164, p < 0.0001 |
| log(1/EC50) = −0.0076 (±0.0306) + 0.1420 (±0.0020) × DCW(6,17), n = 9, R2 = 0.9824, QLMO2 = 0.9745, s = 0.007, F = 391, p < 0.0001 |
It should be mentioned that there were no individual and aggregation sizes information available in the literature for CuO NP. Thus the original dataset for model 1 was reduced to 16 when developing model 2 for evaluating the size effects of NPs on their cytotoxicity.
Both models were then utilized to predict the log(1/EC50) values of the 7 NPs in the test set for external validation. The predicted values were presented in Table 1, while the main statistical parameters were shown in Table 3. One can see that both models are statistically satisfactory, with the RMSE values for both sub-sets as low as possible. Plots of the predicted log(1/EC50) values against the experimental ones for both models were shown in Fig. 2, which indicated a reasonable agreement between the predicted and experimental values across the entire dataset.
| Endpoints | Models | Training set | Test set | ||||
|---|---|---|---|---|---|---|---|
| R2 | RMSE | n | R2 | RMSE | n | ||
| E. coli | Puzyn et al.26 | 0.85 | — | 10 | 0.83 | 0.19 | 7 |
| Sizochenko et al.28 | 0.93 | 0.13 | 13 | 0.78 | 0.32 | 3 | |
| Model 1 | 0.8891 | 0.181 | 10 | 0.8181 | 0.257 | 7 | |
| Model 2 | 0.9824 | 0.065 | 9 | 0.8670 | 0.216 | 7 | |
| HaCaT cells | Gajewicz et al.30 | 0.93 | 0.12 | 10 | 0.83 | 0.13 | 8 |
| Sizochenko et al.28 | 0.96 | 0.10 | 14 | 0.92 | 0.12 | 3 | |
| Model 3 | 0.9606 | 0.075 | 13 | 0.8281 | 0.250 | 5 | |
| Model 4 | 0.9997 | 0.007 | 12 | 0.9905 | 0.206 | 5 | |
![]() | ||
| Fig. 2 Comparisons between the predicted and experimental log(1/EC50) values of toxicity to E. coli. | ||
Moreover, it is noteworthy that the results obtained by model 2 are better than those by model 1, for both the training and test sets, as the R2 and RMSE values have been obviously improved. That is to say, comparing to model 1 without considering the size effect, model 2 considering the size effect here can offer a better predictive ability.
| log(1/LC50) = −0.2909 (±0.0664) + 0.1038 (±0.0027) × DCW(1,3), n = 13, R2 = 0.9606, QLMO2 = 0.9393, s = 0.008, F = 268, p < 0.0001 |
| log(1/LC50) = 0.0012 (±0.0048) + 0.0778 (±0.0001) × DCW(1,3), n = 12, R2 = 0.9997, QLMO2 = 0.9996, s = 0.007, F = 1273, p < 0.0001 |
The predicted log(1/LC50) values for both models are presented in Table 2. Both models are statistically satisfactory with the RMSE values for both sub-sets as low as possible. Plots of the predicted values against the experimental ones for both models were shown in Fig. 3.
![]() | ||
| Fig. 3 Comparisons between the predicted and experimental log(1/LC50) values of toxicity to HaCaT cells. | ||
Also, it should be noticed that the performance of model 4 are obviously superior to those of model 3, especially for the test set, although model 3 also satisfies the minimum criteria for a successful QSAR model (R2 > 0.6, QLMO2 > 0.5).50 This strongly suggested that the particle sizes had a significant effect on the cytotoxicity of MeOx NPs to HaCaT cells.
| Probe of Y-scrambling | E. coli | HaCaT cells | ||||||
|---|---|---|---|---|---|---|---|---|
| Model 1 | Model 2 | Model 3 | Model 4 | |||||
| Training set | Test set | Training set | Test set | Training set | Test set | Training set | Test set | |
| R12 | 0.013 | 0.030 | 0.004 | 0.156 | 0.131 | 0.294 | 0.006 | 0.102 |
| R22 | 0.192 | 0.062 | 0.321 | 0.069 | 0.066 | 0.054 | 0.029 | 0.002 |
| R32 | 0.233 | 0.376 | 0.192 | 0.280 | 0.056 | 0.182 | 0.225 | 0.018 |
| R42 | 0.033 | 0.045 | 0.348 | 0.231 | 0.030 | 0.152 | 0.003 | 0.255 |
| R52 | 0.011 | 0.125 | 0.010 | 0.003 | 0.065 | 0.195 | 0.001 | 0.283 |
| R62 | 0.056 | 0.018 | 0.041 | 0.034 | 0.234 | 0.171 | 0.095 | 0.019 |
| R72 | 0.364 | 0.113 | 0.213 | 0.465 | 0.013 | 0.14 | 0.003 | 0.273 |
| R82 | 0.325 | 0.213 | 0.192 | 0.242 | 0.270 | 0.248 | 0.019 | 0.127 |
| R92 | 0.337 | 0.005 | 0.215 | 0.205 | 0.032 | 0.142 | 0.055 | 0.026 |
| R102 | 0.004 | 0.233 | 0.029 | 0.013 | 0.005 | 0.064 | 0.041 | 0.122 |
| Average Rx2 | 0.157 | 0.122 | 0.157 | 0.170 | 0.090 | 0.164 | 0.048 | 0.123 |
| Original R2 | 0.889 | 0.818 | 0.982 | 0.867 | 0.961 | 0.828 | 0.999 | 0.991 |
Moreover, the residuals between the predicted and experimental values for all the developed models were calculated and shown in Fig. 4 and 5. As most of the residuals are randomly distributed on both sides of the zero baseline without obvious regularity, one may conclude that there are no systematic errors exist in developing the presented models.
All the results discussed above showed that the presented models positively pass internal and external validations with satisfactory stability and predictivity, which can be reliably used to predict the toxicity of MeOx NPs. Considering the limited experimental data available and the complex nature of cytotoxicity of NPs, it was not possible to further improve the model predictions beyond the current results.
This work also demonstrated that the newly proposed improved SMILES-based optimal descriptors can be successfully employed to model the complex toxicity of MeOx NPs to both prokaryotic and eukaryotic cells. Once properly developed, the nano-QSAR models can provide predictions of the toxicity of MeOx NPs quickly using only SMILES structures and some basic physicochemical properties. The SMILES derived solely from the molecular structures can be generated by freely accessible software such as ChemSketch and CORAL, while the employed physicochemical properties can be easily obtained from molecular formula and periodic table.
:
1 is suggested46). If there are too few samples or too many descriptors inputting in the QSAR model, the risk of overfitting is fairly high. Regarding the model performance, our model 2 showed a better calibration ability for the training set (0.9824 vs. 0.93), as well as a much better predictive ability for the test set (0.8670 vs. 0.78). Regarding the modeling methods employed, Sizochenko et al.'s model was established by using Random Forest (RF) regression, while model 2 was developed by employing the multiple regressions (MLR) technique. Compared with the ensembled RF model which can not be visually presented, model 2 was more simple and intuitive. Considering the fact that the descriptors employed in both models are easily available, model 2 is considered to be easier to apply due to its transparent feature.Consequently, the presented nano-QSAR models can be considered to be able to predict the toxicity of MeOx NPs to both prokaryotic and eukaryotic systems with some obvious superiority in comparison to the previously developed models.
There are two main types of mechanisms of MeOx NPs' toxicity reported in the literature. The first type (Mechanism I) involves the detachment of metal cations from the surface of MeOx, while the second one (Mechanism II) is related to the redox properties of the MeOx' surfaces (transfer of electrons between the surface of MeOx and intracellular redox couples).51–53 Both processes lead to the formation of highly reactive and less specific hydroxyl radicals, which could be the main factors in charge of inducing oxidative stress in the cells.
In this study, a total of five basic physicochemical features were included into the SMILES-based optimal descriptors to improve the characterization of nano-structure information and build up predictive models. Sensitivity analysis was performed to determine the relative importance of each feature towards the toxicity of the NPs to both cells. The R2 value for the new reduced model on the training set was computed when the ith feature is excluded from the original model. The process is repeated for each feature. Then differences between the R2 of the original model and the reduced ones were calculated and shown as R2diffi (see Table 5). It is obvious that the most important feature is the one that leads to the highest value of R2diffi. The values of R2diffi for both models were plotted in Fig. 6.
| Features | EC50 | LC50 | ||||
|---|---|---|---|---|---|---|
| Original R2 | Reduced R2 | R2diffi | Original R2 | Reduced R2 | R2diffi | |
| Molecular weight | 0.9824 | 0.8429 | 0.1395 | 0.9997 | 0.8991 | 0.1006 |
| Cationic charge | 0.8329 | 0.1495 | 0.6018 | 0.3979 | ||
| Mass percentage of metal elements | 0.8401 | 0.1423 | 0.5657 | 0.4340 | ||
| Individual size | 0.8349 | 0.1475 | 0.5644 | 0.4353 | ||
| Aggregation size | 0.8130 | 0.1694 | 0.5428 | 0.4569 | ||
According to the results of sensitivity analysis, the features are ranked according to their corresponding relative importance as follows:
(1) For QSAR model of toxicity to E. coli: aggregation size > cationic charge > individual size > mass percentage of metal elements > molecular weight;
(2) For QSAR model of toxicity to HaCaT cells: aggregation size > individual size > mass percentage of metal elements > cationic charge > molecular weight.
The individual size and aggregation size were found to be the most important factors for the cytotoxicity to both E. coli and HaCaT cell, especially for the latter. It can thus be concluded that the size effects of MeOx NPs on their cytotoxicity were still found to be significant for NPs with sizes studied here (between 15 and 150 nm), at least for the HaCaT cells. That is to say, the particle size did affect activity for the NPs with sizes between 15 and 150 nm. However, most previous studies revealed that the most significant size-dependent changes of toxicity of the NPs occur below about 5 nm, while for NPs with sizes between 15 and 90 nm, the toxicity changes are always neglected. The possible reasons for the discrepancy may be attributed to the fact that the literature findings may be significant for the E. coli (prokaryotic cells), while for the eukaryotic HaCaT cells, it may be not obvious. Also, as has been stated in previous studies, the toxicity of MeOx increases with a decreasing size.54–56 It can be explained by both mechanisms discussed above. Firstly, along with the increase of the ratio of surface area to volume, the total number of atoms at the NP surface will increase. Moreover, because the surface atoms will form fewer chemical bonds than the interior ones, they are less stable and could be more easily detached from the surface. This process is in agreement with Mechanism I of nanotoxicity discussed above. Meanwhile, as very small NPs behave more like single molecules instead of bulk crystals, the differences in physicochemical properties (including redox properties) between the NPs and the bulk should be significant, especially for those of very small sizes, for which large fractions of atoms are present at the surface. This process is in agreement with Mechanism II discussed above. However, it should also be pointed out that, the toxicity of MeOx increases with a decreasing size, but become insignificant at sizes above certain values (dependent on the particular MeOx).
The cationic charge is another important physicochemical feature to interpret and predict the cytotoxicity of MeOx. As can be seen from Table S1,† those oxides with low cationic charge (like CuO, ZnO, CoO and NiO) usually indicate strong reductive properties (easy detachment of the metal cation), which enhance their cytotoxicity to the E. coli. That is to say, with an increase in the cationic charge of MeOx NPs, the cytotoxicity to E. coli will decrease for most MeOx NPs. This mechanism is in agreement with Mechanism I of toxicity discussed above. As for the HaCaT cells, there is no obvious relationship between the cytotoxicity and cationic charge for most MeOx NPs, which indicated the different mechanism of toxicity existed between prokaryotic and eukaryotic systems.
The relative contributions of mass percentage of metal elements are different in both models. Compared to E. coli, this feature, which is related to the number of metal atoms in a crystal, has a relatively higher impact on HaCaT cells. The cytotoxicity to both cells will decrease with an increase in the mass percentage of metal elements for MeOx NPs.
The comparison studies of the toxicity of MeOx NPs to both cells verified the hypothesis that different modes of toxic action occur between prokaryotic and eukaryotic systems.
(1) The new developed descriptors can be obtained directly from SMILES and some common physicochemical features without computationally demanding calculations requiring any quantum-chemical background. These reproducible descriptors can also efficiently encode cytotoxicity of MeOx NPs leading to models with high statistical quality as well as certain interpretability. It could be assumed that the new descriptors could be further applied to other unexplored inorganic compounds.
(2) We have successfully developed a set of statistically significant and robust nano-QSAR models for predicting toxicity of MeOx NPs to both the E. coli bacteria and human keratinocytes. The presented models were also conceptually simple, computationally inexpensive, easy to apply, and with acceptable model interpretability, when comparing to the literature models.
(3) The individual size and aggregation size were found to be the most important factors for the cytotoxicity to both E. coli and HaCaT cells, especially for the latter. Also, MeOx having low cationic charge usually exhibit the strong reductive properties, which enhances their cytotoxicity to the E. coli bacteria and vice versa. The developed nano-QSAR models revealed and verified the differences in the mechanisms of toxicity of MeOx NPs to prokaryotic and eukaryotic systems.
(4)This study can provide a new way for predicting cytotoxicity for new MeOx NPs or for other NPs for which experimental values are unknown. Also, the developed models have potential applications in improving the experimental design of safer NPs and enabling their prioritization for virtual screening.
Footnote |
| † Electronic supplementary information (ESI) available: The experimental toxicity values as well as corresponding physicochemical feature values for each metal oxide nanoparticle. See DOI: 10.1039/c6ra01298a |
| This journal is © The Royal Society of Chemistry 2016 |