DOI:
10.1039/C6RA01275B
(Paper)
RSC Adv., 2016,
6, 33868-33879
Molecular characteristics of collagen extracted from the starry triggerfish skin and its potential in the development of biodegradable packaging film†
Received
15th January 2016
, Accepted 23rd March 2016
First published on 24th March 2016
Abstract
Collagen from alternative sources is being considered for various industrial applications. This study presents the extraction of collagen, a product of high value, from the skin of starry triggerfish (Abalistes stellatus). The feasibility of utilising the extracted collagens for fabrication of biodegradable food packaging film via casting method has also been investigated. The extracted acid solubilised collagen (ASC) and pepsin solubilised collagen (PSC) with yields of 7.1 ± 0.2% and 12.6 ± 0.1% (wet weight basis), respectively, were identified as type I collagen. ATR-FTIR spectra displayed that both ASC and PSC molecules had an intact triple helical structure stabilised mainly by hydrogen bonds. The net charge of ASC and PSC became zero at pHs of 5.6 and 5.4, respectively as determined by zeta potential titration. Furthermore, ASC based packaging film showed the highest tensile strength (TS), elastic modulus (E) and contact angle (θ), but the lowest elongation at break (EAB) and water vapour permeability (WVP) (P < 0.05), compared with the PSC film. Increased glass-transition temperature (Tg) and endothermic melting temperature (Tm) accompanied with higher enthalpy (ΔH) were detected in the ASC film, indicating a strong protein–protein interaction in the film network. Based on thermal analysis, the ASC film contained higher heat-stable mass residues (30.9%, w/w) as compared to the PSC film (14.3%, w/w) in the temperature range of 50–600 °C. The microstructure of the ASC film had a finer and smoother surface without layering or cracking phenomenon; however, a coarser surface was observed in the PSC film. Therefore, the skin of starry triggerfish could serve as a potential source of collagen for food packaging film applications.
1. Introduction
Collagen is an extracellular matrix component that is frequently used as a biomaterial.1 Type I collagen, the most common type of collagen, is the predominant component of connective tissues such as skin, bones, tendons, dentin, cornea, vascular systems or fibrous capsules of internal organs.2,3 Type I collagen is known as fibrillar collagen, and plays a structural role by contributing to the molecular architecture, shape and mechanical properties of skin tissues.4,5 The traditional sources of collagen and collagen-derived products are bovine and porcine skins and bones. Nevertheless, porcine collagen is unacceptable for some religions, while those from bovine sources are at risk of contamination with foot-and-mouth disease and bovine spongiform encephalopathy (BSE).6 As a consequence, marine collagen and its products are in very high demand due to the lack of disease transmission and dietary restriction. From the fish processing operations, a large amount of collagen-rich by-products (60–70%) including skins, bones, scales, fins, head, guts and frame are discarded, which causes pollution and emit offensive odours.2,7 It is imperative to develop a procedure for utilising these by-products to provide a practically feasible and economically viable solution that could lead to an increased revenue, energy-conserving, profitability for fish-processors and green approach in terms environmental protective aspect and waste management benefits. Therefore, these underutilised resources have attracted the increasing attention as the raw material for marketable value-added product such as collagen, gelatine, hydrolysate, etc. Among the fish processing waste, fish skin is promising raw material for collagen extraction as about 70–80% of its dry matter is collagen, and thus could be used as a replacement for mammalian sources.2 Nevertheless, a low yield of collagen is obtained with the traditional process using acetic acid as the extraction solvent.2 The appropriate concentration of pepsin has been reported to cleave peptides in the telopeptide region, thereby increasing the collagen yield and decreasing the time of extraction process without any detrimental effect on the integrity of collagen structure.1 Due to the enormous amount of fish viscera, especially stomach, pepsin of fish origin could be recovered and used to maximise the yield of collagen from fish skin.1
Collagen has a wide range of applications in various branches of industries due to its excellent film-forming ability, low-antigenicity, low-allergenicity, non-toxicity, biocompatibility and biodegradability. Due to the strong mechanical properties, collagen films could be used in food packaging industry. Collagen films could become an integral/edible part of meat products, thus they can function to provide safety benefits, control undesirable changes, reduce the shrink loss of meat and meat based products during storage, thereby extending the shelf life and retains their visual appeal for longer period.8 Collagen has been used for producing edible casings for meat processing industries (sausages/salami/snack sticks) and drug delivery carriers or wound dressings in the medical fields.9 Fibrillar collagens are very well suited for the production of edible sausage casings and films, since they form readily stable networks that are able to shrink and stretch to accommodate contraction and expansion of meat batter during continuous processing.10 Apart from that collagen with high market value can be used for medical and tissue engineering as well as bioengineered teeth, skin tissue, etc.
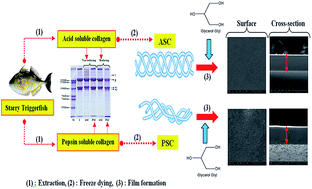
Starry triggerfish (Abalistes stellatus) belongs to the order Tetraodontiformes and is a member of the Balistidae family. This species is used for surimi and fillet production, in which a large amount of skin is produced as by-product. Due to its thick skin, it could be potential source of collagen, especially when fish pepsin is employed as the extraction aid. The collagen extraction from fish skin would not only increase the added value to these by-products, but also accelerate the development of fish processing industries and reduce environmental pollution. However, no information regarding the molecular characteristics and film-forming ability of collagen from the skin of this species has been reported. Therefore, the objective of present study was to extract and comparatively characterise the acid solubilised collagen (ASC) and pepsin solubilised collagen (PSC) from the skin of starry triggerfish. Moreover, the extracted collagen from triggerfish skin was used for the development of biodegradable food packaging film in order to replace the conventional petroleum based plastic packaging films. The mechanical and thermal properties of collagen based films were determined with a view to facilitate their application in food packaging industry.
2. Materials and methods
2.1. Chemicals
Bovine haemoglobin, β-mercaptoethanol (β-ME), L-tyrosine and bovine serum albumin were purchased from Sigma Chemical Co. (St. Louis, MO, USA). High molecular weight marker was purchased from GE Healthcare UK (BKM, UK). Trichloroacetic acid, Folin–Ciocalteu's phenol reagent, glacial acetic acid, glycerol, sodium hydroxide (NaOH) and tris(hydroxylmethyl) aminomethane were obtained from Merck (Darmstadt, Germany). Sodium dodecyl sulphate (SDS), N,N,N′,N′-tetramethyl ethylene diamine (TEMED) and Coomassie blue R-250 were procured from Bio-Rad Laboratories (Hercules, CA, USA). All the chemicals used in this study were of analytical grade.
2.2. Fish skin and stomach preparation
The skin of starry triggerfish (A. stellatus) and stomach of albacore tuna (Thunnus alalunga) was obtained from local surimi processing plant, Perak, Malaysia. The samples were packed in polythene bags and kept in ice using a skin/ice ratio of 1
:
2 (w/w) and transported within 3 h to the School of Industrial Technology, Universiti Sains Malaysia, Penang, Malaysia. The skin was denuded manually and the cleaned skin was washed with iced tap water (0–2 °C). The prepared skin was then cut into small pieces (0.25 × 0.25 cm2) to increase its surface area. Both prepared skin and stomach were placed in polyethylene bags and stored at −20 °C until use. The storage time was less than 2 months.
2.3. Preparation of stomach extract
The frozen stomach of albacore tuna was thawed using running water (26–28 °C) until the core temperature reached −2 to 0 °C. The sample was cut into pieces (1 × 1 cm2) and finely ground in liquid nitrogen using a National blender (Model MX-T2GN, Taipei, Taiwan) to a powder form according to the method of Ahmad and Benjakul.1 Stomach powder was suspended in 50 mM sodium phosphate buffer (pH 7.2) at a ratio of 1
:
10 (w/v). The mixture was stirred continuously at 4 °C for 30 min. The suspension was centrifuged at 7700 × g for 30 min at 4 °C using a Beckman Coulter centrifuge (Model Avanti J-E, CA, USA) to remove the tissue debris. The supernatant was collected and referred to as ‘stomach extract’. The protein content in the stomach extract was measured as per the Lowry method using bovine serum albumin as a standard.11
2.4. Assay of proteolytic activity
Prior to assay, the stomach extract from albacore tuna was adjusted to pH 2 with 1 M HCl and the mixture was allowed to stand at 4 °C for 10 min as described by Nalinanon et al.12 The treated stomach extract was centrifuged at 5000 × g for 10 min at 4 °C using a refrigerated centrifuge. The acidified supernatant was collected and used as the sources of activated pepsin.
Proteolytic activity of acidified stomach extract from albacore tuna was determined using haemoglobin as a substrate as per the method of Nalinanon et al.12 To initiate the reaction, 200 μL of stomach extract were added into the assay mixture containing 200 μL of 2% (w/v) haemoglobin, 200 μL of distilled water and 625 μL of McIlvaine's buffer [0.2 M Na-phosphate and 0.1 M Na-citrate, pH 2.0]. Appropriate dilution was made to ensure that the amount of enzyme was not excessive for available substrate in the assay system. The reaction was conducted at 50 °C for 20 min. To terminate enzymatic reaction, 200 μL of 50% (w/v) trichloroacetic acid (TCA) were added. Unhydrolysed protein substrate was allowed to precipitate for 15 min at 4 °C, followed by centrifuging at 4725 × g for 10 min at room temperature (26–28 °C) using a MIKRO 20 centrifuge (Hettich Zentrifugen, Tuttlingen, Germany). The oligopeptide content in the supernatant was measured by the Lowry method using tyrosine as a standard.11 One unit of activity was defined as the amount releasing 1 μmol of tyrosine per min (μmol Tyr per min). A blank was performed in the same manner, except that the acidified stomach extract was added into the reaction mixture after the addition of 50% (w/v) TCA.
2.5. Extraction of collagen
All procedures were carried out at 4 °C with a gentle stirring. The collagen from the skin of starry triggerfish was extracted following the method of Ahmad and Benjakul1 with a slight modification. Skin was soaked in 0.1 M NaOH with a skin/solution ratio of 1
:
20 (w/v) with the continuous stirring to remove non-collagenous proteins for 6 h. The alkaline solution was changed every 2 h. The alkaline treated skin was then washed with cold water until the pH of the wash water became neutral or faintly basic. Residual fat in the skin was removed using 10% (v/v) butyl alcohol with a skin/solution ratio of 1
:
10 (w/v) for 18 h with a change of solution every 6 h. Defatted skin was thoroughly washed with 15 volumes of cold water (4–5 °C). The defatted skin was soaked in 0.5 M acetic acid with a skin/solution ratio of 1
:
15 (w/v) for 48 h in the absence and presence of acidified stomach extract at a level of 25 units per g of defatted skin. The mixture was filtered with two layers of cheesecloth to remove undissolved debris. The filtrate was added with NaCl to obtain the final concentration of 2.6 M in the presence of 0.05 M tris(hydroxymethyl) aminomethane (pH 7.0). The resultant precipitate was collected by centrifuging at 20
000 × g for 60 min at 4 °C. The pellets were dissolved in 10 volumes of 0.5 M acetic acid and dialysed against 9 volumes of 0.1 M acetic acid and distilled water, respectively. The dialysate was finally freeze-dried using a Model Coolsafe 55, Scanvac, (Coolsafe, Lynge, Denmark). The dried powder extracted in the absence and presence of stomach extract was referred to as ASC and PSC, respectively. The yield of ASC and PSC was calculated and expressed as dry matter/wet weight of skin. ASC and PSC were then subjected to following analysis.
2.6. Amino acid analysis
ASC and PSC samples were hydrolysed under reduced pressure in 4 M methane sulfonic acid containing 0.2% (v/v) 3-(2-aminoethyl)indole at 115 °C for 24 h. For tryptophan determination, the samples were hydrolysed by 3 N mercaptoethanesulphonic acid to avoid the decomposition of tryptophan. The hydrolysates were neutralised with 3.5 M NaOH and diluted with 0.2 M citrate buffer (pH 2.2). An aliquot of 0.4 mL was applied to an amino acid analyser (MLC-703; Atto Co., Tokyo, Japan). The degree of hydroxylation of proline was calculated as the percentage of hydroxyproline from total imino acids.
2.7. SDS-polyacrylamide gel electrophoresis (SDS-PAGE)
SDS-PAGE was performed by the method of Laemmli.13 The ASC and PSC samples were dissolved in 5% (w/v) SDS and the mixtures were incubated at 85 °C for 1 h. The mixture was centrifuged at 4000 × g for 5 min at room temperature to remove undissolved debris. Solubilised samples were mixed at 1
:
1 (v/v) ratio with the sample buffer [0.5 M Tris–HCl, pH 6.8, containing 4% (w/v) SDS, 20% (v/v) glycerol and 0.1% (w/v) bromophenol blue] in the presence or absence of 10% (v/v) β-ME. The mixtures were boiled in boiling water for 2 min. Samples (15 μg protein) were loaded onto polyacrylamide gels comprising of 7.5% running gel and 4% stacking gel and subjected to electrophoresis at a constant current of 15 mA per gel using a Mini Protein II unit (Bio-Rad Laboratories, Inc., Richmond, CA, USA). After electrophoresis, gel was stained with 0.05% (w/v) Coomassie blue R-250 in 15% (v/v) methanol and 5% (v/v) acetic acid and destained with 30% (v/v) methanol and 10% (v/v) acetic acid. High molecular weight marker (GE Healthcare, Aylesbury, UK) was used to estimate the molecular weight of proteins. Type I fish skin collagen was used as a standard.
2.8. ATR-FTIR analysis
ASC and PSC samples were subjected to attenuate total reflectance-Fourier transform infrared spectroscopy (ATR-FTIR). FTIR spectrometer (Model Equinox 55, Bruker, Ettlingen, Germany) equipped with a horizontal ATR trough plate crystal cell (45° ZnSe; 80 mm long, 10 mm wide and 4 mm thick) (PIKE Technology Inc., Madison, WI, USA) was used. For spectra analysis, the collagen samples were placed onto the crystal cell and the cell was clamped into the mount of FTIR spectrometer. The spectra in the range of 600–4000 cm−1 with automatic signal gain were collected in 32 scans at a resolution of 4 cm−1 and were rationed against a background spectrum recorded from the clean empty cell at 25 °C. Analysis of spectral data was carried out using the OPUS 3.0 data collection software programme (Bruker, Ettlingen, Germany). Prior to data analysis, the spectra of ASC and PSC were first normalised to the band at amide III, and a linear baseline correction was then applied on all the spectra.
2.9. UV-Vis absorption
UV-Vis absorption spectra of ASC and PSC samples were recorded using UV-Vis spectrophotometer (Model UV-1800 Shimadzu, Kyoto, Japan). ASC and PSC solutions were prepared by dissolving the desired quantity (5 mg mL−1) of collagen in 0.5 M acetic acid. Prior to the measurement, the base line was set with 0.5 M acetic acid. The spectra was obtained by scanning the wavelength of ASC and PSC solution in the range of 190–500 nm with a scan speed of 50 nm min−1 at room temperature.
2.10. Differential scanning calorimetry
Differential scanning calorimetry (DSC) of ASC and PSC samples was run following the method of Rochdi et al.14 with a slight modification. The samples were rehydrated by adding deionised water or 0.05 M acetic acid to dried samples at a sample/solution ratio of 1
:
40 (w/v). The mixtures were allowed to stand for 2 days at 4 °C. DSC was performed using a differential scanning calorimeter (Perkin Elmer, Model DSC7, Norwalk, CA, USA). Temperature calibration was run using the indium thermogram. The accurate weight of samples was placed in aluminium pans and then pans were hermetically sealed. The samples were scanned at 1 °C min−1 over the range of 20–50 °C using iced water as the cooling medium. An empty pan was used as the reference. Total denaturation enthalpy (ΔH) was estimated by measuring the area under the endothermic peak in the DSC thermogram. The denaturation temperature (Tm) was estimated from the endothermic peak of DSC thermogram.
2.11. Measurement of ζ-potential
ASC and PSC samples were dissolved in 0.5 M acetic acid at a concentration of 0.5 mg mL−1. The mixture was stirred at 4 °C for 12 h. The ζ-potential of each sample (20 mL) was measured using a zeta potential analyser (ZetaPALS, Brookhaven Instruments Co., Holtsville, NY, USA). The ζ-potential of samples adjusted to different pHs with 1 M nitric acid or 1 M KOH using an autotitrator (BI-ZTU, Brookhaven Instruments Co., Holtsville, NY, USA) was determined. The pH rendering zero ζ-potential was obtained from the titration curve.
2.12. Fabrication of ASC and PSC based films for food packaging applications
ASC and PSC based films were prepared according to the casting method reported by Kozlowska et al.15 with a slight modification. The collagen samples were dissolved in 0.5 M acetic acid to obtain film-forming solution (FFS) with a concentration of 2% (w/v). Glycerol as plasticiser was added to FFS at the concentration of 25% (w/w) based on the dry weight of collagen, and the air bubbles in FFS were removed by a vacuum oven in ice bath. Subsequently, a volume of 8 mL FFS was poured onto a rimmed silicone resin plate (5 × 5 cm2) and dried in an environmental chamber (PSX-330H; Laifu Technology Co., Ltd., Ningbo, China) at 25 ± 0.5 °C and 50 ± 5% relative humidity (RH). The resulting collagen based films were manually peeled off and conditioned at 25 ± 0.5 °C and 50 ± 5% RH for 48 h prior to analyses.
For DSC, TGA and SEM studies, films were conditioned in a dessicator containing dried silica gel for 1 week to minimise the plasticising effect of water, followed by drying in a dessicator containing P2O5 gel for 2 weeks at room temperature (28–30 °C) to obtain the most dehydrated films (≤4% moisture content).
2.13. Analyses
2.13.1. Measurement of stress–strain properties. The stress–strain properties, such as tensile strength (TS), elastic modulus (E) and elongation at break (EAB) of collagen based films were determined as described by Iwata et al.16 using the Universal Testing Machine (Lloyd Instrument, Hampshire, UK). The test was performed in the controlled room at 25–28 °C and ∼50 ± 5% RH. Ten films (2 × 5 cm2) with the initial grip length of 3 cm were used for testing. The films were clamped and deformed under tensile loading using a 100 N load cell with the cross-head speed of 30 mm min−1 until the samples were broken. The TS was expressed in MPa and calculated by: |
 | (1) |
where Pmax is the maximum force (N) necessary to pull the sample apart, and A is the initial cross-sectional area of the sample film (m2) determined by multiplying the film width by the film thickness.Percentage elongation at break is the amount of uniaxial strain at fracture and was calculated by:
|
 | (2) |
where
lb is the film elongation at the moment of failure and
lo is the initial grip length (3 cm) of samples multiplied by 100.
Elastic modulus was expressed in MPa and was determined by calculating the slope of the elastic (linear) region of an engineering stress–strain curve:
|
 | (3) |
where Δ
S is the change in tensile stress and Δ
e is the change in tensile strain over the elastic region.
2.13.2. Water vapour permeability (WVP). WVP was measured using gravimetric modified cup method based on ASTM method (American Society for Testing and Materials) as described by Shiku et al.17 Briefly, collagen based films were sealed on an aluminium permeation cup containing dried silica gel (0% RH) with silicone vacuum grease and rubber gasket, and held with four screws around the cup's circumference. After measuring the initial weight, test cups were placed in a desiccator containing the distilled water (30 °C, ∼50 ± 2% RH). Subsequently, test cups were weighed to the nearest 0.0001 g with an electronic balance (Model CPA225D, Sartorious Corp., Goettingen, Germany) at 1 h intervals over an 8 h period. A plot of weight gained versus time was used to determine the WVP and the slope of the linear portion of this plot represented the steady state amount of water vapour diffusing through the film per unit of time (g h−1). Five films were used for analysis and WVP of the film was calculated as follows: |
WVP (g m−1 s−1 Pa−1) = wlA−1t−1(P2 − P1)−1
| (4) |
where w is the weight gain of the cup (g); l is the film thickness (m); A is the exposed area of film (m2); t is the time of gain (s); (P2 − P1) is the vapour pressure difference across the film (4244.9 Pa at 30 °C).
2.13.3. Contact angle measurement. Contact angle (θ) of collagen based films was measured in a conditioned room (25 °C) by the sessile drop method using contact angle meter (Model KSV CAM 101, KSV Instruments, Ltd., Helsinki, Finland), equipped with image analysis software. Briefly, film sample (2 × 2 cm2) was placed on a movable platform and levelled horizontally. A droplet of ultra-pure water (30 μL) was placed on a film surface using 500 μL microsyringe (Hamilton Robotics Inc., Bonaduz, GR, Switzerland) attached with a needle of 0.75 mm diameter. Image analyses were carried out using image recorder CAM 200 software and the contact angles were noted.
2.13.4. Differential scanning calorimetry. Thermal properties of collagen based films were determined using differential scanning calorimeter. Temperature calibration was performed using the indium thermogram. The films (4–5 mg) were accurately weighed into aluminium pans, hermetically sealed and scanned over the temperature range of −30 to 200 °C (1st heating scans) and −30 to 300 °C (2nd heating scans) with a heating rate of 10 °C min−1. The dry ice was used as a cooling medium and the system was equilibrated at −50 °C for 5 min prior to the scan. The empty aluminium pan was used as a reference. The glass transition temperature (Tg) was calculated as the inflexion point of the base line, caused by the discontinuity of the specific heat of the sample. The melting temperature (Tm) was estimated from the endothermic peak of DSC thermogram and transition enthalpy (ΔH) was determined from the area under the endothermic peak. All these properties were calculated with help of the DSC-7 software.
2.13.5. Thermogravimetric analysis. The dried collagen based films were scanned using a thermogravimetric analyser (Perkin Elmer, Model TGA-7, Norwalk, CT, USA) from 40 to 600 °C at a rate of 10 °C min−1. Nitrogen was used as the purge gas at a flow rate of 20 mL min−1. The percent weight loss (%) versus temperature plots were taken for thermogravimetric analysis (TGA) and derivative weight loss (%) against temperature was taken for differential thermogravimetric analysis (DTG).
2.13.6. Microstructure. Microstructure of upper surface and cryo-fractured cross-section of the collagen based films was visualised using a scanning electron microscope (Model JSM-5800 LV, JEOL, Tokyo, Japan) at an accelerating voltage of 10 kV. The collagen based films were cryo-fractured by immersion in liquid nitrogen. Prior to visualisation, the collagen based films were mounted on brass stub and sputtered with gold in order to make the sample conductive, and photographs were taken at 8000× magnification for surface. For cross-section, cryo-fractured films were mounted around stubs perpendicularly using double sided adhesive tape, coated with gold and observed at the 5000× magnification.
2.14. Statistical analyses
All experiments were performed in triplicate and a completely randomised design (CRD) was used. Data were presented as means ± standard deviation and the probability value of <0.05 was considered significant. Analysis of variance (ANOVA) was performed and mean comparisons were done by Duncan's multiple range tests. Analysis was performed using a SPSS package (SPSS 11.0 for windows, SPSS Inc, Chicago, IL, USA).
3. Results and discussion
In recent years, a trial has been continuously performed to extract the collagen from the marine sources for further applications in food and nutraceutical industries. Although fish collagen is an alternative to the commercially available mammalian collagens, but so far, there has been a gap between the scientific interest and the wide industrial application of this source of collagen. In this work, we reported the extraction and characterisation of acid solubilised collagen (ASC) and pepsin solubilised collagen (PSC) from starry triggerfish skin. The collagen extraction from fish skin trimmings will not only provide scope for the secured disposal of the solid waste but also would be an option for producing a valuable product, which will bring about significant returns. Due to the environmental concerns, the use of biodegradable packaging material has recently attracted considerable interest as a substitute for petroleum based plastic packaging. This study highlights the feasibility of utilising ASC and PSC for the development of biodegradable food packaging films.
3.1. Yield of ASC and PSC from the skin of starry triggerfish
Yields of ASC and PSC extracted from the skin of starry triggerfish were 7.1 ± 0.2% and 12.6 ± 0.1% (wet weight basis), respectively. Triggerfish skin contained the highly ordered type I collagen fibres at the level of 24.6 g/100 g as determined by hydroxyproline content. Yields based on the initial collagen content in the triggerfish skin or percent recovery (%) for ASC and PSC were 28.9% and 51.3%, respectively. During the extraction process, the skin of triggerfish was not completely solubilised by 0.5 M acetic acid or pepsin, as shown by the lower yield of ASC and PSC. This result was in agreement with Ahmad et al.2 who reported the incomplete solubilisation of unicorn leather jacket skin in 0.5 M acetic acid. This observation suggested that the collagen molecules in triggerfish skin were most likely cross-linked by covalent bonds through the condensation of aldehyde groups with lysine and hydroxylysine in the telopeptide region, leading to decreased solubility of collagen in acid.18 From the review literature, the yields of ASC and PSC from unicorn leather jacket skin were 4.2% and 8.5% (wet weight basis), respectively.1,2 The differences in extraction yields and collagen recovery between different species might be governed by varying cross-linking of collagen fibrils in the raw material. The higher yield of PSC as compared to ASC suggested that stomach extract (tuna pepsin) facilitated the extraction of collagen from triggerfish skin. Pepsin has the potential to cleave specifically at the telopeptide region of collagen molecules without damaging the integrity of triple-helix.1 Therefore, pepsin could be used as an effective aid for increasing the collagen yield from the skin of starry triggerfish.
3.2. Amino acid profile of ASC and PSC from the skin of starry triggerfish
Amino acid profile of ASC and PSC extracted from the skin of starry triggerfish is shown in Table 1. Both collagens contained glycine (319–322 residues/1000 residues) as the major amino acid, followed by alanine (140–144 residues/1000 residues), proline (107–109 residues/1000 residues) and hydroxyproline (79–84 residues/1000 residues). Generally, glycine in collagen represents nearly one third of the total residues and occurs as every third residue in collagen except for the first 14 amino acid residues from the N-terminus and the first 10 residues from the C-terminus.19 The imino acid content (proline + hydroxyproline) of ASC and PSC was 193 and 186/1000 residues, which was higher than those of most fish collagens such as ocellate puffer collagen (170 residues/1000 residues).18 The variation in imino acid content amongst different species is mostly due to different living environments of habitat, particularly temperature.20,21 Hydroxylysine (4–5 residues/1000 residues) was found in both ASC and PSC from starry triggerfish skin. It was found that the ASC contained a slightly higher imino acid content than the PSC. The degree of hydroxylation of proline in ASC and PSC was calculated to be 43.5% and 42.5%, respectively. It was suggested that the teleopeptides removed by pepsin digestion contained fewer imino acids. As a result, lower proportion of imino acids was found in PSC. No cysteine and tryptophan were detected in either ASC or PSC. Generally, type I collagen has low amounts of cysteine (∼0.2%) and methionine (∼1.2–1.3%).22 The amino acid composition of collagens from starry triggerfish skin was found to be almost similar to those of collagen from other freshwater fish including common carp, channel catfish and silver carp.23
Table 1 Amino acid composition of ASC and PSC extracted from the skin of starry triggerfish (expressed as residues/1000 residues)
Amino acids |
ASCa |
PSCb |
ASC: acid solubilised collagen. PSC: pepsin solubilised collagen. |
Aspartic acid/asparagine |
46 |
50 |
Threonine |
25 |
26 |
Serine |
35 |
37 |
Glutamic acid/glutamine |
73 |
75 |
Glycine |
322 |
319 |
Alanine |
144 |
140 |
Cysteine |
0 |
0 |
Valine |
18 |
20 |
Methionine |
13 |
12 |
Isoleucine |
10 |
8 |
Leucine |
16 |
19 |
Tyrosine |
4 |
3 |
Phenylalanine |
14 |
12 |
Hydroxylysine |
5 |
4 |
Lysine |
26 |
30 |
Histidine |
6 |
7 |
Arginine |
50 |
52 |
Tryptophan |
0 |
0 |
Hydroxyproline |
84 |
79 |
Proline |
109 |
107 |
Imino acid |
193 |
186 |
3.3. Protein pattern of ASC and PSC from the skin of starry triggerfish
Protein pattern of ASC and PSC extracted from the skin of starry triggerfish determined under reducing and non-reducing conditions is illustrated in Fig. 1. Both ASC and PSC were composed of a heterotrimer of two α1-chains and one α2-chain with the molecular weight of 119–121 and 112–117 kDa, respectively. High molecular weight components, including β-chain (dimer), γ-chain (trimer) as well as the cross-linked constituents were also observed in both ASC and PSC. The ratio of α1/α2 chain was approximately 2
:
1 in ASC and PSC, and both collagen samples were most likely classified as type I collagen.20 A slight difference in the protein pattern was noticeable in PSC, compared with ASC. Slight degradation of major proteins with the concomitant formation of low molecular weight peptides was noticeable when pepsin from albacore tuna stomach was used. It was suggested that pepsin from albacore tuna stomach was able to hydrolyse tropocollagen as indicated by the decreased band intensity of β- and α-chains. It was noted that molecular weights of α-chains of PSC was slightly lower than that of ASC. Hence, it can be inferred that pepsin most likely cleaved some peptides at telopeptide region. As a consequence, a slight decrease in molecular weight of PSC was noticeable, in comparison with that of ASC. This result indicated that pepsin used in this study could cleave intermolecular cross-links of α-chains. It was demonstrated that two types of intermolecular bonds, side-to-side and end-to-end bond, in collagen could easily be cleaved by pepsin, whereas head-to-tail bond is relatively pepsin resistant.24 Drake et al. reported that most of intra- and intermolecular cross-links found in collagen occur through the telopeptide region.25 No differences in the electrophoretic patterns of ASC and PSC were noticeable in the presence and absence of β-ME. This indicated that there was no disulphide bond in ASC and PSC. The result was in accordance with the absence of cysteine in ASC and PSC (Table 1).
 |
| Fig. 1 SDS-PAGE pattern of ASC and PSC from the skin of starry triggerfish under reducing and non-reducing conditions. M: high molecular weight markers, I: type I fish skin collagen, ASC: acid solubilised collagen and PSC: pepsin solubilised collagen. | |
3.4. Thermal denaturation of ASC and PSC from the skin of starry triggerfish
Thermal transitions of ASC and PSC from the skin of starry triggerfish dispersed in 0.05 M acetic acid or deionised water are depicted in Fig. 2. Endothermic peaks with the denaturation temperatures (Tm) of 31.4 ± 0.5 and 29.2 ± 0.5 °C were found in ASC and PSC dispersed in 0.05 M acetic acid, respectively. When ASC and PSC were suspended in deionised water, Tm of 35.9 ± 0.5 and 33.6 ± 0.8 °C was observed, respectively. It was noted that Tm shifted to a lower temperature (P < 0.05), when ASC and PSC were dispersed in acetic acid. The results suggested that intramolecular hydrogen bonds stabilising the triple helix structure of collagen might be disrupted to some levels, in the presence of acetic acid, mainly due to the repulsion of collagen molecules in acidic solution. This alteration resulted in the decrease in Tm. Furthermore, the different Tm noticed in collagen samples was due to the different medium used for suspending ASC and PSC. Nevertheless, the differences in ΔH were noticeable among ASC and PSC. For collagen dispersed in acetic acid or deionised water, the lowest ΔH was found in PSC, compared with ASC (P < 0.05). The differences in Tm and ΔH among ASC and PSC samples might be governed by the composition and sequence of amino acid as well as the tertiary structure of collagen. Tm of ASC and PSC samples from the skin of starry triggerfish were much lower than that of pig skin collagen (37 °C) and that of calf skin collagen (40.8 °C).26,27 This fact clearly indicated that collagen from triggerfish skin was less stable than mammalian collagen. Nevertheless, ASC and PSC from triggerfish skin showed the higher Tm than collagen from other fish species, such as ocellate puffer fish (28.0 °C) and grass carp (24.6 °C).18,28 In general, Tm of collagen is influenced by the imino acid content. The higher imino acid content could be associated with increased Tm.18 Factors influencing the thermal properties of collagen include the content of imino acid, degree of hydroxylation of proline and the content of the glycine-proline-hydroxyproline sequence.29 The thermal transition temperature of the collagen triple helix is attributed to the hydrogen bonded networks, mediated by water molecules, which connect the hydroxyl group of hydroxyproline in one strand to the main chain amide or carboxyl groups of another chain.30 Therefore, the differences in hydroxyproline content might determine the thermal transition temperatures of collagens from different fish species.
 |
| Fig. 2 DSC thermograms of ASC and PSC from the skin of starry triggerfish dispersed in 0.05 M acetic acid (a) and in deionised water (b). ASC: acid solubilised collagen and PSC: pepsin solubilised collagen. | |
3.5. ATR-FTIR of ASC and PSC from the skin of starry triggerfish
FTIR spectra of ASC and PSC extracted from the skin of starry triggerfish are depicted in Fig. 3. The major absorption bands in the spectra of both ASC and PSC were described in Table 2. The spectra of both ASC and PSC had great similarity to each other, which suggested that their chemical compositions were similar.31 For amide I band, ASC had the lowest wavenumber, indicating the interaction of C
O with the adjacent chains, while PSC had the highest wavenumber. Generally, the shift to the lower wavenumber indicated the existence of hydrogen bonds in collagen.32 The amide III band in ASC and PSC suggested the presence of triple helical structure. The triple helical structure of ASC and PSC was also confirmed from IR ratio between amide III and 1450 cm−1 which was approximately 1. The other bands, arising from the stretching vibrations of N–H group and showing the existence of hydrogen bonds in ASC and PSC appeared at 3293.3 and 3295.3 cm−1, respectively, corresponding to amide A, which occurs commonly in the range of 3280–3300 cm−1. The amide B absorption bands for ASC and PSC were observed at the wavenumber of 2910-5-3078.2 cm−1 and 2908.6–3081.6 cm−1, respectively. The slight differences noted in peak heights and wavenumbers among ASC and PSC was correlated with the differences in functional groups and intra- and intermolecular interaction. Thus, fish pepsin used as extraction aid might affect the resulting PSC to some extent.
 |
| Fig. 3 FTIR spectra of ASC and PSC from the skin of starry triggerfish. ASC: acid solubilised collagen and PSC: pepsin solubilised collagen. | |
Table 2 General peak assignments in the FTIR spectra of ASC and PSC
Assignments |
Wavenumber (cm−1) |
ASCa |
PSCb |
ASC: acid solubilised collagen. PSC: pepsin solubilised collagen. |
Amide I: C O stretching |
1633.9 |
1636.1 |
Amide II: N–H bending |
1545.2 |
1546.9 |
Amide III: C–H stretching |
1236.8 |
1237.2 |
Amide A: N–H stretching |
3415.9 |
3433.2 |
N–H stretching when involved in hydrogen bonding |
3293.3 |
3295.3 |
Amide B: CH3 asymmetric stretching |
3078.2 |
3081.6 |
Amide B: CH2 asymmetric stretching |
2910.5 |
2908.6 |
CH3 symmetric stretching |
2837.2 |
2841.1 |
3.6. UV-Vis spectra of ASC and PSC from the skin of starry triggerfish
UV-Vis spectra of ASC and PSC extracted from the skin of starry triggerfish are depicted in Fig. S1.† ASC and PSC gave superimposed spectra which were characteristic of type I collagen.33 In UV region, a distinct absorption peaks for ASC and PSC arose at 230 nm corresponding to the n → π* transitions of C
O in the peptide bonds of polypeptides chains.34 The absorbance peak in the 230–240 nm was considered as a suitable wavelength for detecting type I collagen. In addition, there was absorbance between 200 and 220 nm, which was attributed to collagen peptide bonds. The absence or weak absorbance at 250–280 nm showed that both ASC and PSC lacked aromatic amino acids, such as tyrosine and phenylalanine, which are sensitive chromophores and absorb UV light at 283 and 251 nm, respectively. The absorption peaks observed were in agreement with the results from Nalinanon et al.35
3.7. ζ-Potential of ASC and PSC from the skin of starry triggerfish
The ζ-potential values representing the surface charge of ASC and PSC measured as a function of pH are shown in Fig. 4. The surface net charge of ASC and PSC decreased as the pH increased and became zero at pH of 5.6 and 5.4, respectively. Protein molecules in an aqueous system have zero net charge at their isoelectric points (pI), in which the positive charges are balanced out by the negative charges.36 At the pH near the isoelectric point, collagen molecules are unstable and tend to coagulate or flocculate due to increased hydrophobic interaction among collagen molecules. The pIs of ASC and PSC were in acidic range, possibly due to the higher density of carboxyl groups. It was noted that the molecular charge of ASC and PSC remained very low in the alkaline region. This might be associated with the low solubility of ASC and PSC in the alkaline pH range, in which the repulsion force between the molecules with the negative charge was not sufficient to cause the complete solubilisation. The slight difference in the pI of ASC and PSC might be caused by the differences in amino acid composition and configuration between collagens.
 |
| Fig. 4 Zeta potential of ASC and PSC from the skin of starry triggerfish at different pHs. ASC: acid solubilised collagen and PSC: pepsin solubilised collagen. Bars represent the standard deviation (n = 3). | |
3.8. Characteristics of collagen based films
The thickness and mechanical properties expressed as tensile strength (TS), elastic modulus (E) and elongation at break (EAB) of ASC and PSC films are given in Table 3. No significant difference in thickness was noted between ASC and PSC films (P > 0.05). ASC film had the highest TS and E, but lowest EAB (P < 0.05), compared with PSC film. Higher TS and E values indicating greater film strength and stiffness, whilst lower EAB is an indicator of less stretch-ability prior to breakage. Based on the results, ASC film was more rigid and less extensible than the PSC film due to strong interaction among high molecular weight collagen chains via hydrogen bonding. Consequently, the lower TS and E but higher EAB in PSC film was due to the decreased structural cohesion via weaker chain-to-chain interaction or less junction zones. In addition, the apparent flexibility in both ASC and PSC films was coincidental with presence of glycerol in the film forming solution. Glycerol in the film matrix acts as a plasticiser between the polymer chains and impeded the association or interaction of protein chains, thereby yielding the weaker film network.37 As a consequence, the collagen matrix is more flexible and α-, β-, γ-chains can slide past each other more readily during tensile deformation. In general, mechanical properties of packaging films are largely associated with the nature and the chemical structure of film forming materials.5 Therefore, these differences in mechanical properties between ASC and PSC films might be governed by complex interactions determined by the amino acid composition and the ratio of α/β-chains present in the collagen.38 Furthermore, the molecular weight distribution and imino acid content of collagen play a key role in the mechanical properties of resulting films.
Table 3 Mechanical properties and water vapour permeability (WVP) of ASC and PSC films prepared by casting technique. Values are given as mean ± SD (n = 3). Different letters in the same row indicate significant differences (P < 0.05)
Properties |
ASC film |
PSC film |
Thickness (μm) |
28.6 ± 2.0a |
28.8 ± 3.1a |
Tensile strength (MPa) |
46.7 ± 6.5a |
34.2 ± 5.2b |
Elongation at break (%) |
28.5 ± 4.4b |
39.6 ± 4.71a |
Elastic modulus (MPa) |
167.5 ± 35.8a |
88.3 ± 22.1b |
WVP (g m−1 s−1 Pa−1) |
4.8 ± 0.7b |
6.6 ± 0.8a |
Contact angle (θ) |
92.5 ± 0.1a |
90.3 ± 0.1b |
Water vapour permeability values (WVP) of ASC and PSC films are shown in Table 3. ASC film had the lowest WVP, compared with PSC film (P < 0.05). The lower WVP of ASC film was coincidental with the highest TS (Table 3). In general, the migration of moisture through films is governed by film network. Films with the denser structure could lower the migration of moisture more effectively than those with less compactness.37 Furthermore, water vapour transfer normally occurs through the hydrophilic portion of film network and depends on hydrophilic/hydrophobic ratio of film constituents.5 The highest WVP in PSC was correlated with the increased amino and carbonyl groups present at the teleopetide regions, which could form the hydrogen bond with water molecules. The highest free amino and carbonyl groups exposed on film surface could play role in determining the hydrophilicity of film. Hoque et al. stated that carbonyl and amino groups with increasing numbers could form hydrogen bonds with water molecules to a higher degree, thereby increasing the WVP of the resulting film.39
Water contact angle values (θ) of ASC and PSC films are shown in Fig. S2.† As it is shown in Table 3, contact angle values of ASC and PSC films were 92.5° ± 0.1 and 90.3° ± 0.1, respectively. The results indicated that ASC film was slightly hydrophobic than PSC film. The higher contact angle value of ASC film was correlated with the lower WVP value. Generally, if the water contact angle is smaller than 90°, the solid surface is considered hydrophilic and if the water contact angle is larger than 90°, the solid surface is considered hydrophobic.40
Thermal properties expressed as glass transition temperature (Tg), endothermic melting temperature (Tm) and enthalpy (ΔH) of ASC and PSC films are shown in Fig. 5. Tg is associated with molecular segmental motion of disordered (amorphous) structure.5 From the thermograms of 1st heat scanning (−30 °C to 200 °C) shown in Fig. 5a, higher Tg was noted in ASC film (52.6 °C) in comparison with PSC film (46.3 °C) related with the plasticised collagen-rich phase. The addition of glycerol as a plasticiser in both ASC and PSC films impeded protein–protein interaction in film network, thereby increasing the mobility of collagen chain. A similar trend was found in the Tm of these collagen films. Endothermic peaks with the Tm at 126.5 and 114.8 °C were observed for ASC and PSC films, respectively. Tm is associated with the helix–coil transition, disruption of molecular ordered structure (turn or random coils) stabilised by various interactions, and changes from the native state of collagen to denatured state.41 Tm is also associated with the evaporation of residual, strongly hydrogen bonded water responsible for the stability of the triple helix conformation of collagen macromolecules.5 The end result of the thermal denaturation of collagen is random fragmentation of the collagen fibrils. In general, the differences in Tg and Tm between ASC and PSC films were due to the differences in sequence of amino acids as well as the complex interactions determined by the amino acids composition. The decreased Tg and Tm of PSC film was due to the molecular weight lowering caused by pepsin digestion, especially in the telopeptide region. The configuration of protein and the way the inter-junction was developed to form the strong film network were crucial for thermal stability. In addition, a higher enthalpy was also observed for ASC film (ΔH = 4.2 J g−1), compared with that of PSC film (ΔH = 3.5 J g−1). The weaker film structure had the lower thermal stability, which required a lower enthalpy for destroying the intermolecular interaction. The major factors influencing the thermal stability of collagen films include the content of imino acid, degree of hydroxylation of proline and the content of the glycine–proline–hydroxyproline sequence. From the thermograms of 2nd heat scanning (−30 °C to 300 °C) shown in Fig. 5b, ASC and PSC films showed one-step like transition at the Tm of 233.2 °C and 225.6 °C with an enthalpy area (ΔH) of 17.1 J g−1 and 16.9 J g−1, respectively. These endothermic peaks were apparently related with the complete decomposition of triple helical collagen structure caused by the irreversible breakdown of intra- and intermolecular bonds. The higher values of Tm and ΔH observed in the 2nd heating scans were assigned mainly to the breaking of the direct hydrogen bonds between α-chains. For the 2nd heating scan of ASC and PSC film, no Tg was observed since the absorbed water acting as plasticiser might be removed during the 1st heating scan. As a consequence, the interaction between collagen molecules was enhanced which led to the formation of more rigid film network.40 Additionally, the higher value of ΔH (16.9–17.1 J g−1) required for disrupting the film network possibly explained the increase in crystallinity behaviour of collagen films.
 |
| Fig. 5 DSC thermograms of 1st heating scan (a) and 2nd heating scan (b) of ASC and PSC based films prepared by casting technique. ASC: acid solubilised collagen and PSC: pepsin solubilised collagen. | |
TGA and DTG curves revealing thermal degradation behaviour of ASC and PSC films are shown in Fig. 6. Their degradation temperatures (Td) and weight loss (Δw) are presented in Table 4. Three main stages of weight loss were observed in both films. The first stage weight loss of ASC film (Δw1 = 5.0%) and PSC film (Δw1 = 5.8%) was observed at the onset temperature (Td1) of 54.3 °C and 40.6 °C, mostly associated with the continuous loss of free water adsorbed in the film. The second stage weight loss of ASC film (Δw2 = 27.9%) appeared at the onset temperature of 220.1 °C (Td2), while PSC film showed weight loss (Δw2 = 37.0%) at the onset temperature (Td2) of 168.9 °C. This change was mostly associated with the loss of glycerol compound (plasticiser) and smaller size protein fraction, as well as structurally bound water. The results indicated that ASC film had higher thermal stability compared to the PSC film, as evidenced by the higher Td2. The third stage of weight loss of ASC film (Δw3 = 36.2%) and PSC film (Δw3 = 42.9%) was observed approximately at onset temperature (Td3) of 355.0 °C and 331.7 °C, respectively, mostly associated with the loss of high molecular weight protein fractions. An enhanced thermal stability of ASC film was attributed to the interaction between collagen chains and higher imino acid content, thereby yielding the stronger film network, thus leading to the higher heat resistance of the resulting film, compared with PSC film. Additionally, all films had residual mass (representing char content) at 600 °C in the range of 14.3–30.9%. Slight variation in char content was most likely due to different composition and domain or cross-links in collagen structure.
 |
| Fig. 6 TGA and DTG curves of ASC and PSC based films prepared by casting technique. ASC: acid solubilised collagen and PSC: pepsin solubilised collagen. | |
Table 4 Thermal degradation temperature (Td, °C) and weight loss (Δw, %) of ASC and PSC filmsa
Samples |
Δ1 |
Δ2 |
Δ3 |
Residues (%) |
Td1 onset (°C) |
Δw1 (%) |
Td2 onset (°C) |
Δw2 (%) |
Td3 onset (°C) |
Δw3 (%) |
Δ1, Δ2 and Δ3 denote the first, second and third stage weight loss, respectively, of film during TGA heating scan. |
ASC film |
54.3 |
5.0 |
220.1 |
27.9 |
355.0 |
36.2 |
30.9 |
PSC film |
40.6 |
5.8 |
168.9 |
37.0 |
331.7 |
42.9 |
14.3 |
SEM micrographs of the surface (A) and cryo-fractured cross-section (B) of ASC and PSC films are shown in Fig. 7. ASC had the compact, smooth and homogeneous surface without layering and cracking phenomenon, indicating an ordered film matrix. This was accompanied with the better mechanical properties of ASC film. PSC film had slightly irregular and coarser surface, and micro-fibrous structure (characteristics of collagen fibrils), due to entanglement of different chains via covalent and non-covalent bonding, enhancing the roughness and discontinuity of film surface. The reduced continuity and lack of cohesive structure integrity of PSC film network therefore lowered the strength of film. These differences in microstructure of ASC and PSC films were caused by the varying arrangements of protein molecules during film formation.37 Moreover, non-porous, smooth and compact cross-section was noticeable in both ASC and PSC films, indicating good structural integrity. The result suggested that both films were stabilised by protein–protein interaction which might possibly led to the enhanced compactness of film network in cross-section.
 |
| Fig. 7 SEM micrographs of surface (a) and cryo-fractured cross-section (b) of ASC and PSC based films prepared by casting technique. ASC: acid solubilised collagen and PSC: pepsin solubilised collagen. | |
4. Conclusion
Based on the results, ASC and PSC could be successfully extracted from the skin of starry triggerfish. Higher yield of PSC was extracted as compared to ASC. The extracted collagens had high electrophoretic purity similar to that of type I fish skin collagen containing heterotrimer of two α1 chains and one α2 chain without disulphide bond. Both collagens retained the integrated triple helical structure during the extraction process and their isoelectric point (pI) was within acidic range. In addition, the distinct amino acid composition and denaturation temperature were noted in ASC and PSC. ASC exhibited high thermal stability in comparison with PSC, owing to the higher imino acid content. Furthermore, ASC film exhibited better mechanical and thermal properties due to distinctive domains corresponding to the aggregated ordered structures. Higher contact angle (θ) and lower WVP were obtained in ASC film. Moreover, ASC film has smoother and homogenous surface than PSC film, and no obvious signs of phase separation between film components were observed, thereby confirming their potential use as food packaging material. In general, the results indicated the feasibility of using the triggerfish skin as a good alternative source of realistic high-quality collagen for high value applications that could enhance the sustainability of fish processing industries.
Acknowledgements
The authors would like to express their sincere thanks to School of Industrial Technology, Universiti Sains Malaysia and Institute of Nutrition (INMU), Mahidol University for the research facilities and financial support.
References
- M. Ahmad and S. Benjakul, Food Chem., 2010, 120, 817–824 CrossRef CAS.
- M. Ahmad, S. Benjakul and S. Nalinanon, Food Hydrocolloids, 2010, 24, 588–594 CrossRef CAS.
- S. Gorgieva and V. Kokol, in Biomaterials Applications for Nanomedicine, ed. R. Pignatello, InTech, 2011 Search PubMed.
- D. Liu, X. Zhang, T. Li, H. Yang, H. Zhang, J. M. Regenstein and P. Zhou, Food Biosci., 2015, 9, 68–74 CrossRef CAS.
- M. Ahmad, N. M. Hani, N. P. Nirmal, F. F. Fazial, N. F. Mohtar and S. R. Romli, Prog. Org. Coat., 2015, 84, 115–127 CrossRef CAS.
- J. M. Regenstein, M. M. Chaudry and C. E. Regenstein, Compr. Rev. Food Sci. Food Saf., 2003, 2, 111–127 CrossRef.
- F. Shahidi, in Seafoods: Chemistry, Processing Technology and Quality, ed. F. Shahidi and J. R. Botta, Springer, US, 1994, pp. 320–334 Search PubMed.
- T. Janjarasskul and J. M. Krochta, Annu. Rev. Food Sci. Technol., 2010, 1, 415–448 CrossRef CAS PubMed.
- E. A. Baldwin and J. Bai, in Edible Coatings and Films to Improve Food Quality, 2nd edn, ed. E. A. Baldwin, R. Hagenmaier and J. Bai, CRC Press, 2011 Search PubMed.
- D. J. Bridgeford, US3917862 A, 1975.
- O. H. Lowry, N. J. Rosebrough, A. L. Farr and R. J. Randall, J. Biol. Chem., 1951, 193, 265–275 CAS.
- S. Nalinanon, S. Benjakul, W. Visessanguan and H. Kishimura, J. Food Sci., 2008, 73, C413–C419 CrossRef CAS PubMed.
- U. K. Laemmli, Nature, 1970, 227, 680–685 CrossRef CAS PubMed.
- A. Rochdi, L. Foucat and J.-P. Renou, Food Chem., 2000, 69, 295–299 CrossRef CAS.
- J. Kozlowska, A. Sionkowska, J. Skopinska-Wisniewska and K. Piechowicz, Int. J. Biol. Macromol., 2015, 81, 220–227 CrossRef CAS PubMed.
- K. I. Iwata, S. H. Ishizaki, A. K. Handa and M. U. Tanaka, Fish. Sci., 2000, 66, 372–378 CrossRef CAS.
- Y. Shiku, P. Yuca Hamaguchi, S. Benjakul, W. Visessanguan and M. Tanaka, Food Chem., 2004, 86, 493–499 CrossRef CAS.
- Y. Zhang, W. Liu, G. Li, B. Shi, Y. Miao and X. Wu, Food Chem., 2007, 103, 906–912 CrossRef CAS.
- O. R. Fennema, Food Chemistry, CRC Press, 3rd edn, 1996 Search PubMed.
- J. H. Muyonga, C. G. B. Cole and K. G. Duodu, Food Chem., 2004, 85, 81–89 CrossRef CAS.
- F. A. Johnston-Banks, in Food Gels, ed. P. Harris, Springer, Netherlands, 1990, pp. 233–289 Search PubMed.
- R. Owusu-Apenten, Food Protein Analysis: Quantitative Effects On Processing, CRC Press, 2002 Search PubMed.
- R. Duan, J. Zhang, X. Du, X. Yao and K. Konno, Food Chem., 2009, 112, 702–706 CrossRef CAS.
- B. K. Zimmermann, J. Pikkarainen, P. P. Fietzek and K. Kühn, Eur. J. Biochem., 1970, 16, 217–225 CrossRef CAS PubMed.
- M. P. Drake, P. F. Davison, S. Bump and F. O. Schmitt, Biochemistry, 1966, 5, 301–312 CrossRef CAS PubMed.
- T. Ikoma, H. Kobayashi, J. Tanaka, D. Walsh and S. Mann, Int. J. Biol. Macromol., 2003, 32, 199–204 CrossRef CAS PubMed.
- R. Komsa-Penkova, R. Koynova, G. Kostov and B. Tenchov, Biophys. Chem., 2000, 83, 185–195 CrossRef CAS PubMed.
- T. Nagai, Y. Araki and N. Suzuki, Food Chem., 2002, 78, 173–177 CrossRef CAS.
- T. V. Burjanadze, Biopolymers, 2000, 53, 523–528 CrossRef CAS PubMed.
- I. R. Babu and K. N. Ganesh, J. Am. Chem. Soc., 2001, 123, 2079–2080 CrossRef CAS PubMed.
- J. Bandekar, Biochim. Biophys. Acta, 1992, 1120, 123–143 CrossRef CAS.
- H. Li, B. L. Liu, L. Z. Gao and H. L. Chen, Food Chem., 2004, 84, 65–69 CrossRef CAS.
- I. Caputo, M. Lepretti, C. Scarabino, C. Esposito and A. Proto, Anal. Biochem., 2012, 421, 92–96 CrossRef CAS PubMed.
- S. A. Oladepo, K. Xiong, Z. Hong and S. A. Asher, J. Phys. Chem. Lett., 2011, 2, 334–344 CrossRef CAS PubMed.
- S. Nalinanon, S. Benjakul, H. Kishimura and K. Osako, Food Chem., 2011, 125, 500–507 CrossRef CAS.
- P. L. R. Bonner, Protein Purification, Garland Science, 2007 Search PubMed.
- M. Ahmad, S. Benjakul, T. Prodpran and T. W. Agustini, Food Hydrocolloids, 2012, 28, 189–199 CrossRef CAS.
- L. Tang, S. Chen, W. Su, W. Weng, K. Osako and M. Tanaka, Process Biochem., 2015, 50, 148–155 CrossRef CAS.
- M. S. Hoque, S. Benjakul and T. Prodpran, Food Hydrocolloids, 2011, 25, 82–90 CrossRef CAS.
- M. Ahmad, N. P. Nirmal and J. Chuprom, RSC Adv., 2015, 5, 99044–99057 RSC.
- M. S. Hoque, S. Benjakul, T. Prodpran and P. Songtipya, Int. J. Biol. Macromol., 2011, 49, 663–673 CrossRef CAS PubMed.
Footnote |
† Electronic supplementary information (ESI) available. See DOI: 10.1039/c6ra01275b |
|
This journal is © The Royal Society of Chemistry 2016 |
Click here to see how this site uses Cookies. View our privacy policy here.