Xinjie
Zhang
a,
Xin
Wang
a,
Ke
Chen
a,
Jie
Cheng
a,
Nan
Xiang
*ab and
Zhonghua
Ni
*a
aSchool of Mechanical Engineering, and Jiangsu Key Laboratory for Design and Manufacture of Micro-Nano Biomedical Instruments, Southeast University, Nanjing, 211189, China. E-mail: nan.xiang@seu.edu.cn; nzh2003@seu.edu.cn
bState Key Laboratory of Fluid Power and Mechatronic Systems, Zhejiang University, Hangzhou, 310027, China
First published on 18th March 2016
In this paper, we propose a passive flow regulator with a five-layer structure for high-throughput flow-rate control in microfluidic environments. The stacking architecture of the regulator effectively prevents the membrane breakage encountered in previously reported high-throughput flow regulators. To investigate the flow regulation characteristics of our passive flow regulator, a prototype device is integrated into the fluid circuit of a gas-driven flow system, and the flow rate outputs of the device under continuously increased gas pressures are measured. A three-phase regulation process, including an unstable phase, a saturated phase and a stable phase, is observed in the obtained flow-rate curves, and constant output flow rates are achieved at a low threshold pressure. In addition, we investigate the flow autoregulation capability of our flow regulator under periodically varied pressures. Good flow stabilization of the gas-driven flow system is achieved even under dramatically fluctuating pressures. Our passive flow regulator can be applied in many microfluidic environments where low-cost pressure sources (e.g., micropumps or gas tanks) are used while a precise flow rate is required.
An ideal microfluidic flow control unit should have the advantages of low cost, small size, easy integration, and flow control precision. With a miniaturized flow control unit integrated into the microfluidic system, the device can output constant flow rates for various biomedical applications. For example, point-of-care diagnostic devices5 and drug delivery systems6 often require a low-cost and flexible sample control unit to stably and precisely supply the reagent. Currently, microfluidic valves offer an elegant and effective solution for the above demand. As a control unit or actuator for fluid manipulation, microfluidic valves with various functional architectures have been successfully invented.7–12 These reported microfluidic valves could precisely control the fluid flow rate via active external control units13,14 or passive variation of channel architectures.15–18 The active methods enable precise flow manipulation through conscious operations from operators, and thus seem to be more flexible for some applications.19–21 However, the dependence on external units remains a major issue, which may affect the final cost and volume of the integrated microfluidic system. In comparison to the active methods, passive valves are more convenient for microfluidic system integration as they can automatically regulate flow rates without complex feedback. Specifically, Cousseau et al.22 proposed a flow stabilizer using a silicon membrane to provide a stable flow rate (1 ml h−1) for drug delivery systems. Kartalov et al.15,23 developed a flow autoregulatory device with an in-built push-up valve, and proposed a theoretical model to predict the flow behavior. Yang et al.16 reported the use of a check valve with a thin flap to accomplish constant flow control up to 1.2 ml min−1 at high pressures of over 200 kPa. Doh et al.17 presented a parallel membrane valve to obtain a constant flow rate up to 1.46 ml min−1 with a low threshold pressure of less than 50 kPa. All of the previously-reported passive valve devices have been proven to be effective for outputting constant fluid flows and perform well with small flow rate variations. Although many efforts have been made in developing passive valve devices, there is still room for improvement in the structures of the device so as to optimize the fabrication process and hence improve the flow regulation performances.
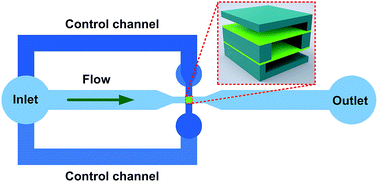
In this work, we propose a microfluidic passive flow regulator with an in-built five-layer structure valve for high-throughput flow-rate control in microfluidic environments, and the dynamic flow regulation characteristics of the regulator are systematically investigated in a series of experiments. Specifically, we analyze the detailed flow regulation process of the regulator by constructing a gas-driven flow system. Then, the flow regulation characteristics of our regulator in sinusoidal-varying or pulsation pressure environments are investigated.
To demonstrate the working principle of our passive flow regulator more clearly, we built and solved a Fluid–Structure Interaction (FSI) model to simulate the performances of the regulator using COMSOL Multiphysics® software, as shown in Fig. 2. The numerical simulation results clearly show the status of the membrane deformation and the distribution of the liquid flow velocity. The flow-rate curve in Fig. 2d demonstrates that the flow rate achieves a constant value when the applied pressure is higher than the threshold value.
In our flow regulator, the parameters of the in-built membrane valve (i.e., width W, height H, length L, and membrane thickness, see Fig. 3c) are of vital importance to the output flow rate and the threshold pressure. To achieve a potential high flow rate, the width of the contraction channel (i.e., valve width) was set at a relatively high value of 150 μm. The height of the contraction channel (i.e., valve height) and the widths of the two aligned control channels (i.e., valve length) were designed to be 70 μm and 300 μm respectively so as to obtain a low threshold pressure. The membrane thickness was designed to be 10 μm to obtain a good elastic property of the membrane film. To minimize the regulator resistance, the width of the main channel was set to be 600 μm, and the length of the contraction channel was set to be 1 mm. To eliminate the surface tension effect, the widths and heights of the control channels were set to be 600 μm and 100 μm, respectively.
Fig. 4b shows the forward and reverse flow performances of our passive flow regulator under a working pressure continuously increasing from 5 kPa to 50 kPa in 10 s. The forward flow curve represents the automatic flow regulation behavior of the flow regulator. Due to the nonlinear relationship between the pressure and the output flow rate, the whole flow regulation process can be divided into three phases which are the unstable phase, the saturated phase and the stable phase. At the first stage, the flow rate increases linearly with an increase of pressure, and the linear flow performance shows the obviously unstable flow regulation behavior of the regulator. After that, the flow rate increases slowly to achieve a maximum value at the saturated pressure, exhibiting a significant nonlinear flow behavior. In the end, the flow rate fluctuates slightly to reach a constant value, which is totally independent of the continuously increased pressures. To make a quantitative analysis of the flow performances, the output flow rate variation was measured in the whole flow regulation process. It was observed that when the pressure is higher than 25 kPa, the flow rate variation is less than 4.8%, and the initial maximum flow rate was found at a pressure of ∼35 kPa. Therefore, the threshold and the saturated pressures were determined to be 25 kPa and 35 kPa, respectively. When the pressure was increased from 35 kPa to 50 kPa, a constant flow rate of 1490 ± 18 μl min−1 with a variation of 1.2% was observed, which demonstrates the excellent autoregulation capability of our regulator. To understand the reverse flow performance of the regulator, we plotted the reverse flow-rate curve as a function of the input working pressure, and the curve shows that the reverse flow rate increases in proportion to the pressure, and the detailed flow-rate values are far higher than that of the forward flow at the highest pressure. The significantly different forward and reverse flow characteristics of the regulator will be useful in microfluidic applications in which constant forward fluid injection and high-speed backward flow are needed.
Fig. 5a shows the flow rates versus the sinusoidal varying pressures (at a time period of 60 s) over 180 s. Under periodic variation pressures, the output flow rates also exhibit periodic fluctuations with the same frequency of pressures, and the flow rate was measured to be 1417 ± 60 μl min−1 with a variation of 4.2%, which demonstrates the constant flow regulation performance of our flow regulator at such a low pressure frequency (1/60 Hz). It is noted that when the pressure is increased from 25 kPa to 50 kPa in the first half period, the saturated pressure was found under the pressure of ∼35 kPa. When the pressure is decreased from 50 kPa to 25 kPa in the second half period, we observed that there exists an approximately saturated pressure of ∼29 kPa. Due to the existence of two saturated pressures, the flow regulator generates a long flow stable phase which occupies about 72% of a pressure period. This interesting phenomenon of two saturated pressures demonstrates that the flow regulator experiences a complete flow regulation process in the long pressure period, and it achieves a long flow stable phase in the above process.
To investigate the flow autoregulation performances at a higher pressure frequency, we set the period of the sinusoidal varying pressure to be 2 s, which delivers a high pressure frequency of 1/2 Hz. The obtained relationship curve between the flow rate and the pressure is shown in Fig. 5b. As can be observed from this figure, the flow rate shows a periodic fluctuation according to the pressure frequency, and the flow stable phase disappears, which leaves only one saturated pressure in a period. The saturated pressure was found to be close to 50 kPa, and the measured flow-rate variation is ∼5.3%, which is slightly higher than the conditions of the long pressure period. These findings indicate that when varying pressure is applied to the flow regulator at a high frequency, the flow resistance of the membrane-valve based flow regulator cannot immediately compensate for the abrupt increase of pressure, which results in the excess sample fluid being pumped through the flow regulator under high pressure. As a comparison, we measured the output flow rate of the same gas-driven flow system without a membrane valve by replacing the regulator with a simple flow resistor. As can be found from the figure, due to the nature of constant flow resistance, the flow rate output of the flow resistor shows a dramatically sinusoidal fluctuation with a high variation of ∼26.9%. Therefore, we concluded that even at a high pressure variation frequency, our passive flow regulator still possesses a stable flow autoregulation function.
We next studied the influence of fluctuating flow rates on the total flow volume output of our flow regulator. The test time duration was set to be 60 s, and the flow volumes were measured at pressure periods of 60 s and 2 s, respectively. We plotted the flow volume curves as a function of time, as shown in Fig. 5c. It is observed from the figure that both of the two curves show a good linearity between the flow volume and the test time, and the volume at a short pressure period is almost identical to that at a long pressure period. The calculated difference between the total flow volumes at the two pressure periods is only ∼10.14 μl. Considering the high outflow volumes (average volume of ∼1433.5 μl) of the flow regulator, this small volume difference caused by the changing of pressure periods can be neglected for most microfluidic applications.
In order to understand the flow saturation performances of our flow regulator at varied pressure frequencies, we measured the saturated pressures and the output flow rates at varied pressure frequencies of 1/60 Hz (period 60 s), 1/8 Hz (period 8 s), 1/4 Hz (period 4 s) and 1/2 Hz (period 2 s), as illustrated in Fig. 5d. It can be seen from the inset figure that there is only one saturated pressure in a period at frequencies of 1/8 Hz, 1/4 Hz and 1/2 Hz, but not for the frequency of 1/60 Hz. In addition, we found that the saturated pressure increases to be close to the upper pressure limit with an increase of frequency. Since the saturated pressure directly determines the time duration of the saturated and stable phases, the longest flow stable phase is achieved at the lowest frequency of 1/60 Hz while the longest saturated phase is obtained at the highest frequency of 1/2 Hz. In addition, we found that the saturated flow rate also shows a linear relationship with the frequency. It can be concluded that with the increase of the pressure variation frequency, the stable flow output by the regulator gradually transfers to be a fluctuating flow, and thus the flow stabilization of the regulator decreases.
Fig. 6a shows the flow autoregulation characteristics under pulsed pressures at a period of 6 s. When the pressure is quickly changed from 25 kPa to 50 kPa, the flow rate increases abruptly to reach a peak value at first, and then decreases continuously to achieve a constant value. As a comparison, when the pressure is changed from the high value (50 kPa) to the low value (25 kPa), the flow rate quickly decreases to achieve a valley value at first, then increases gradually for a while, and decreases again to obtain a stable flow rate. We thought that the pulsation behavior of the flow rate is caused by the mutual interaction between the gas-driven flow system and the flow regulator. Due to the delayed response of the flow regulator under a pulsation pressure, the flow resistance of the regulator doesn’t change immediately to compensate for the abruptly fluctuating pressure, which results in the output of a pulsation flow rate. We also observed that when a high pressure pulsation is output, the output pressure is regulated to be the working pressure within 0.2 s. However, the flow rate is delayed to achieve a stable status for ∼1 s. Similarly, when a low pressure pulsation is output, the flow rate is delayed to be stable for ∼1.7 s. Although the flow regulator exhibits unstable flow pulsation behaviors (flow-rate variation of ∼10.6%), the total time durations of the two unstable flow phases (flow-rate variation is larger than 5%) are less than 0.85 s, which can be ignored in the conditions of a long time period pulsation.
To probe the flow autoregulation of our flow regulator at a higher pulsation frequency, the pressure period was changed to be 2 s (see Fig. 6b). The flow regulator shows similar pulsation flow behaviors to the long pressure period experiment (period of 6 s), and the flow rates fluctuate according to the pulsation frequency. We measured and compared the peak and valley values of the flow rates under the two frequency conditions, and found that the amplitudes of the two values at the high frequency are smaller than that at the low frequency. The calculated flow-rate variation at the high frequency is ∼9.5%, and is lower than that of the low frequency, which demonstrates that the flow regulator retains a good flow regulation property at such a high pulsation frequency. As a comparison, we also investigated the flow performances of the flow resistor at the high pulsation frequency. The flow-rate curve output by the flow resistor shows a dramatic pulsation with a variation of over 30%.
We next investigated the total flow volumes of our flow regulator at the above two pressure periods within 24 s, as illustrated in Fig. 6c and d. Both of the two flow volume curves show a good linearity, and the slopes (23.981 μl s−1 for the period of 6 s, and 23.983 μl s−1 for the period of 2 s) of the two fitted curves are almost the same, which indicates the robust response of the flow regulator on varied pulsation pressures. The calculated difference between the total flow volumes at the two pressure periods is ∼6.52 μl, and the volume variation is ∼0.57%, which further validates the flow stabilization of the flow regulator.
To demonstrate the consistency of the flow autoregulation at different operational cycle times, we measured and calculated the average flow rates of our flow regulator within every cycle time. The pressure variation period in the experiment was set to be 2 s, and 12 operational cycle times were applied. The plotted curve of the average flow rate as a function of cycle time is shown in Fig. 6e. A small average flow-rate fluctuation was found in these cycle times, and the average flow-rate error is about 3.61 μl min−1, which delivers a variation of ∼0.12%. The obtained data strongly validate the good flow regulation consistency of our flow regulator in all of the test cycle times.
To demonstrate the advantages of our passive flow regulator, we compare the functional performances of our regulator with previously-reported passive devices. We found that most of the devices with a single membrane-valve structure generate a very small flow rate at the level of μl min−1 which is far from enough for most high-throughput applications.15,22,23 Other types of devices with parallel membrane structures can output a maximum flow rate of ∼1.46 ml min−1 under a low threshold pressure of 35 kPa.17 However, these devices are difficult to fabricate since the thin PDMS membranes in these devices can be broken easily during the demolding process. By contrast, the stacking architecture of our regulator effectively prevents the membrane from being broken. In addition, a high flow rate of ∼1.42 ml min−1 can be achieved in our regulator at a much lower threshold pressure of ∼25 kPa. These unique features of our flow regulator would be very useful in microfluidic applications where low-cost pressure sources and precise flow rates are required.
This journal is © The Royal Society of Chemistry 2016 |