DOI:
10.1039/C6RA01067A
(Paper)
RSC Adv., 2016,
6, 32874-32880
CdS-modified porous foam nickel for label-free highly efficient detection of cancer cells
Received
13th January 2016
, Accepted 22nd March 2016
First published on 24th March 2016
Abstract
CdS-modified foam nickel (FN) was successfully constructed for the effective detection of cancer cells based on an electrochemiluminescence (ECL) technique. CdS-modified FN substrates show high ECL intensity, fast response and nice stability, which provides a new platform for the realization of an ECL sensor for the cancer cells. Two successive modification steps of 3-aminopropyltriethoxysilane (APS) and gold nanoparticles onto CdS-modified FNs not only offer substrates for conjugation of antibodies, but also effectively enhance the ECL signal, thus leading to an ECL immunosensor with high performance. Due to the large specific surface area of the FN electrodes, this biosensor, with a detection range from 200 to 10
000 cells per mL, has a detection limit of 78 cells per mL. The selectivity, stability and reproducibility of this biosensor were also demonstrated, which indicate its promising potential for clinical diagnosis.
Introduction
Electrogenerated chemiluminescence (ECL) is a process in which electrogenerated radicals form excited species emitting light with no requirement of external light sources. There are many virtues of this technique,1 especially given the effective control of potentials in the whole processes, which opens a way for ECL to be utilized in detection of different biomolecules,2 including DNA,3,4 antigens,5,6 and cells.7 In this respect, pioneering work was reported by Bard et al. based on the investigation of ECL of Si nanocrystals,8 thereafter followed by many investigations in analytical chemistry based on different materials of II–VI nanocrystals,9,10 carbon dots,11,12 or gold clusters.13,14
The sensitivity is always a key parameter for the design of biosensors, since many early disease diagnosis can be realized only under high sensitivity.15 In this regard, up to now researchers have developed a host of different ways to enhance the sensitivity of the biosensors. For example, based on signal amplification technique, Jie et al. synthesized a probe of dendrimer/CdSe@ZnS quantum dots (QD) nanoclusters, of which the sensitivity of ECL was enhanced by modifying more QD nanoparticles within the limited area.16 Similar to this method, a cycle-amplifying technique17 was also developed via isothermal amplification reactions, which was successfully utilized for the ultra-sensitive detection of single nucleotide polymorphisms.18
Beside these, another effective way to enhance the sensitivity was to create different materials, like various core–shell structures of CdSe,19 CdSe/CdS,20 TiO2/CdTe/CdS,21 TiO2/CdS,22,23 CdTe/CdS/ZnS,24 PAA–Ru@SiO2 nanoparticles (NPs),25 CdSeTe/CdS/ZnS,26 Au/CeO2 nanopartilces,27 even including some more complicated core–shell structures, such as, gold/silica/CdSe/CdS QD nanostructure which was fabricated and successfully utilized for the ultrasensitive detection of carcinoembryonic antigen28 or the detection of α-1-fetoprotein by using Ru/silica@gold composites.29 Apart from these, recent study also showed carbon nanotubes (CNTs) could enhance the ECL property of CdS QDs by reducing the injection barrier of electrons to the QDs.30,31 For example, Nie et al.2 reported a work based on the one-step electrodeposition of indole-6-carboxylic acid monomers and carboxylic groups terminated multiwall carbon nanotubes, which offered a larger surface area and a considerable amount of functionalized carboxylic acid groups, thus making it a good platform for the conjugation with CdSe nanoclusters as luminescent particles. Based on this platform, alpha-fetoprotein was efficiently detected, with high sensitivity and excellent reproducibility. Similarly, another carbon material, graphene oxide,32 was shown to be utilized in the fabrication of a biosensor of DNA molecules to enhance the electron transfer rate and thus leading to the enhancement of the sensitivity of ECL detection. Also, graphene/ruthenium complex composites were prepared for the biosensing of α-fetoprotein, with a low detection limit.33 Moreover, silver nanowires were also introduced into the ECL system for the detection of human IgG.34 Due to the large surface area ratio, the detection limit was as low as 1.0 × 10⁻¹² g mL−1. All the above endeavors made great contributions for the enhancement of sensitivity. While they are mainly conducted based on gold electrodes,35 glassy carbon electrodes,36 or ITO electrodes.37 Previously, although LAPONITE® network thin film38 and poly(5-formylindole)39 were utilized for the biosensing of glucose with good detection efficiency, there are still few reports about the investigation of substrates/electrodes with large specific surface area for the enhancement of sensitivity.
Hence, porous foam nickel came to our mind with its fantastic conductivity and large specific surface area.40,41 FN has previously been utilized for the distribution of magnetic beads, which utilized the property of its porous structure.42 Inspired by this work, the porous structure with large surface area can be utilized for the attachment of QDs to obtain a platform for the detection of biomolecules with good electron transfer rate and a relatively larger amount of QDs within limited area.
In addition, cancer is still a most pressing health concern nowadays.43 It is no doubt that rapid and simple techniques for identifying subtypes of cancer cells would be significant for monitoring the progress of diseases. Most current methods have complicated operations, tedious analysis process, and expensive instrumentation. A good candidate would be ECL biosensor, because of its properties of cost-effectiveness and low background.44
In this study, human hepatoma (HepG2 cells) were detected based on the CdS-modified foam nickel (FN) substrate using ECL technique. Poly(allylamine hydrochloride) (PAH) was utilized for changing the surface charge, followed by the in situ synthesis of CdS on FN, which enlarged the amount of CdS within limited area, thus leading to a relative high ECL intensity. Then, 3-aminopropyl-triethoxysilane was utilized for the immobilization of gold nanoparticles, which acted as the linkers of antibodies. At last, the development of an ECL immunosensor for cancer cells was realized by the specific bonding between antibodies and the cells. With the increase of cells attached to the surface of FN surface, the impedance of this system would decline on account of the decrease of electron transfer rate. As a result, cancer cells were quantitatively detected. In particular, the large specific surface area of FN was beneficial for the immobilization of more QDs, which possessed strong intensity during the detection, thus making it an ideal choice for ECL immunal sensing. The detection limit was greatly improved to 78 cells per mL, which is better than many current methods.16,17 Due to the excellent selectivity, reproducibility and stability, this system offered a different platform for the detection of cancer cells.
Experimental section
Materials
Poly(allylamine hydrochloride) (PAH), chloroauric acid (HAuCl4), sodium citrate, sodium sulfide (Na2S), cadmium chloride (CdCl2), potassium persulfate (K2S2O8), potassium chloride (KCl), potassium ferrocyanide (K4Fe(CN)6), APS (3-aminopropyltriethoxysilane), sodium hydrogen phosphite (Na2HPO4), bovine serum albumin (BSA) and sodium dihydrogen phosphite (Na2HPO4) were all purchased from Sigma-Aldrich. Foam nickel substrate was purchased from Linyi Gelon LIB Co., Ltd. HepG2 cells, Hela cells, Ramos cancer cells and control normal cells were purchased from the Chinese Academy of Medical Sciences. The cell density was counted using a hemocytometer, which was performed prior to any experiments. During all experiments, the cells were kept in a refrigerator at 4 °C. RPMI 1640 medium, fetal bovine serum (FBS) and penicillin–streptomycin were bought from Thermo Scientific Inc., Bremen, Germany. Millipore Milli-Q water with a resistivity of 18.0 MΩ cm was adopted for all aqueous solution preparation.
Synthesis of gold nanoparticles (AuNPs)
A previous literature was adopted for the synthesis of gold nanoparticles with a few modifications.45–47 In brief, 300 mL of water was added into a round bottom flask, followed by heated to boiling in water bath. Then 12 mg of HAuCl4 was added in the water with stirring. A 1.8 mL of sodium citrate (1 wt%) solution was then quickly injected into the above solution, followed by the injection of 10 mg of HAuCl4 solution. This step was repeated for 6 times until there is no solution left.
Details of ECL detection
A model MPI-A ECL analyzer (Xi'an Remax Electronic Science and Technology Co. Ltd, Xi'an, China) was employed for the ECL emission detection based on a three-electrode system at room temperature. A CdS-modified foam nickel working electrode with a 5 mm2 working area, a Pt counter electrode and a saturated calomel reference electrode (SCE) constitute the whole system. The solution for the electrochemical measurement contains 0.1 M PBS (pH 7.4), 0.05 M K2S2O8 and 0.1 M KCl. During the whole detection process, the voltage of the PMT was set as −800 V. As to the details of the detection of cancer cells, the ECL responses to different concentrations of HepG2 cells were measured. The FN electrodes were incubated with different concentrations of HepG2 cells for 0.5 h, and the corresponding ECL signals were recorded.
Characterization details
A Hitachi SU-70 Schottky field emission gun SEM (FEG) were applied for the images of the samples. EDS analysis was performed by using an EX-250 (Horiba, Japan) attachment. TEM images were recorded on a JEOL JSM-6700F instrument (Hitachi).
UV-vis spectra measurement
A UV-3600 spectrophotometer (Shimadzu, Japan) was used for the UV-vis absorption spectra. The FN substrate with CdS was put into the cell for the measurement with 10 mm path length.
Contact angle measurement
Water contact angle (WCA) was measured using a JC-2000D contact angle meter (Zhongyikexin Sci. & Tech. Co. Ltd., China) by the sessile water drop method with 2 μL water drops.48 The WCA values were recorded after 3 s from droplet deposition.
Cell culture
HepG2, HeLa and Ramos cells (purchased from Chinese Academy of Sciences Cell Library) were cultured in RPMI 1640 medium supplemented with 10% FBS (heat-inactivated) and 100 mg mL−1 penicillin–streptomycin in a 5% CO2 atmosphere at 37 °C. After culturing for 2 days, the cells were collected and separated from the medium by centrifugation at 1000 rpm for 3 min, and then washed twice with a sterile PBS solution (pH 7.2). A homogeneous cell suspension was obtained by redispersing the cell sediment in the 1640 cell culture medium. The cell number was determined using a Petroff-Hausser cell counting chamber.
Results and discussion
Preparation and characterization of CdS-modified FN substrates
The modification of FN substrate was conducted using a layer-by-layer technique. Briefly, the FN substrate (Fig. 1a) was immersed in a solution containing poly(allylamine hydrochloride) (2.0 mg mL−1). After 30 min adsorption and airing, there was a thin layer of PAH on the FN via the covalent interaction between amino group and nickel atoms (Fig. 1b), followed by dipping in Cd and S ions (10 mM) successively for 3 times (Fig. 1c), thus leading to the in situ synthesis of CdS.
 |
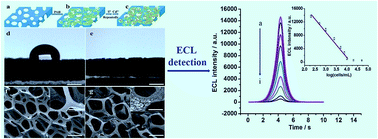
| Fig. 1 Schematic illustration of the synthesized process of CdS-modified FN substrate (a–c) (not to scale). Images of contact angle measurement of the cleaned FN substrate before (d) and after (e) modification of CdS. SEM images of FN substrates before (f) and after (g) modification with CdS. The inset images are high-resolution results. Scale bars equal 500 μm in (d) and (e), 100 μm in (f) and (g) and inset images. | |
The FN substrate was hydrophobic with a contact angle of 112.4 ± 3.5° (Fig. 1d), which caused the hard absorption of ions to the FN surface and trapping of bubbles. After the modification of PAH, the FN substrate showed good hydrophilicity and water could go through the substrate easily, with no bubble trapped in the substrate. Furthermore, according to previous report, there are positive charges on the surface of PAH.49 Thus, S ions were prioritized to be attracted by electrostatic interactions,50,51 as shown in Fig. 1e. When there was no CdS on the FN surface, the surface was very smooth (Fig. 1f). While once CdS was generated, the surface became rough, suggesting the successful in situ synthesis of CdS on the surface of PAH-modified FN substrate (Fig. 1g). This was further confirmed by the study of UV-vis adsorption spectra and energy-dispersive spectroscopy (EDS).
As demonstrated in Fig. 2a, the strong peak at 650 nm, and a weak peak at 450 nm which were attributed to CdS, confirmed the successful fabrication procedure. Similar conclusion was also obtained from EDS. There was only nickel element in Fig. 2b, while Cd and S elements appeared after the in situ synthesis, which could be seen from the characteristic peaks (Fig. 2c). Other small peaks came from PAH. In order to show the morphology of generated CdS particles using ionic layer absorption method, copper grid was utilized as the substrate for the in situ fabrication of CdS particles, which was imaged by TEM (Fig. 3). Clear structure of the particles can be observed, which further proved the efficiency of ionic layer absorption method.
 |
| Fig. 2 The UV-vis absorption spectra of CdS-modified FN substrate (a). EDS spectra of pure FN substrate (b) and CdS-modified FN substrate (c). | |
 |
| Fig. 3 TEM image of CdS particles obtained on the copper grid, using ionic layer absorption method. | |
Comparison of CdS-modified FN substrate, CdS-modified gold electrode, and CdS-modified ITO electrode
To evaluate the advantages of the FN substrate, a comparison experiment was conducted using gold and ITO electrodes. These two different electrodes were dipped into S and Cd ions solution (10 mM) successively for 3 times after the modification of PAH, respectively. Then the ECL intensity was obtained by measuring in PBS (pH 7.4), containing 0.05 M K2S2O8 and 0.1 M KCl, with the same PMT voltage of −800 V. From Fig. 4, it can be seen clearly that the electrodes showed different effect on the ECL intensity. The intensity of modified gold and ITO electrodes had low intensity, which was about one fourth of that of the modified FN substrate. Significantly, the FN substrate showed the strongest signal, which was attributed to the large specific surface ratio.
 |
| Fig. 4 ECL-potential curves of CdS-modified FN electrode (a), CdS-modified gold electrode (b), and CdS-modified ITO electrode (c) in PBS (0.1 M, pH 7.4 containing 0.1 M KCl and 0.05 M K2S2O8). The scan rate was 100 mV s−1 and the PMT voltage was −800 V. The inset CV plot is from CdS-modified FN electrode. | |
The electrochemical and ECL behaviour of CdS-modified FN substrate
An ECL-potential curve of CdS-modified FN electrode was shown in Fig. 4, with the inset image of CV plot. An ECL peak at −1.46 V appeared during the cathodic process, which was the result of the reaction between CdS and S2O82− ions. The possible ECL mechanisms were described using the following equations, which were consistent with the previous assumptions.52,53 CdS on the electron surface can obtain electrons first, forming CdS˙− radicals (eqn (1)), in the meanwhile, the coreactant in the solution can also obtain electrons, with the formation of SO42− and SO4˙− radicals (eqn (2)). CdS˙− and SO4˙− radicals are at unstable status and react with each other, with the generation of SO42− and excited CdS* (eqn (3)). The excited CdS* get back to the ground state with emission (eqn (4)). |
S2O82− + e− → SO42− + SO4˙−
| (2) |
|
SO4˙− + CdS˙− → SO42− + CdS*
| (3) |
Fabrication and optimization of ECL sensor
Preparation and characterization of ECL biosensor. Scheme 1 showed the fabrication process of the ECL immunosensor. The FN electrode with CdS (step a) was covered by APS to avoid falling off while detection (step b). Subsequently, Au NPs were deposited on the surface of APS (step c), followed by the attachment of antibodies (step d). Then, BSA was adopted to passivate the sensing surface (step e), followed by the detection of cells (step f).
 |
| Scheme 1 Schematic illustration of the fabrication process of the ECL biosensor. | |
The fabrication process of ECL biosensor was well monitored by ECL technique. The four processes were conducted including the bare FN electrode (Fig. 5a), CdS modified FN electrode (Fig. 5b), APS/AuNPs/CdS modified FN electrode (Fig. 5c), and antibody on the surface of APS/AuNPs/CdS modified FN electrode (Fig. 5d). There was almost no signal of bare FN electrode (Fig. 5a). When CdS was deposited on the surface of FN electrode, the ECL intensity went up to 15
500 (Fig. 5b). After the modification of APS/AuNPs, the intensity was further enhanced to 16
950 (Fig. 5c), due to the good conductivity of APS and AuNPs. When the epithelial cell-specific markers (antibodies) attached to the surface, due to the blocking effect of electron transfer, the ECL intensity declined to 14
700 (Fig. 5d). However, this intensity was still higher than the previous reports, which can be contributed to the high specific area ratio of FN substrate.
 |
| Fig. 5 ECL–time curves: (a) bare FN electrode, (b) FN electrode with CdS, (c) (b) + APS/AuNPs, and (d) (c) + antibody on the FN electrode. All the detection were conducted in PBS (0.1 M, pH 7.4 containing 0.1 M KCl and 0.05 M K2S2O8), with the scan rate of 100 mV s−1. The PMT voltage was −800 V. | |
Effect of incubation time and pH value on the immunoreaction
Given that the effect of the incubation time and pH value on the reaction between the antibodies and cells, thus the detection performance of the biosensor could be varied accordingly. To investigate so, five different incubation time were chosen for the reaction between antibody and cell (1000 cells per mL), ranging from 10 to 50 min, shown in Fig. 6a. There was a declining tendency of ECL intensity with the growth of the incubation time with a plateau appeared after 30 min. Hence, the incubation time for the detection was determined to be 30 min in our study. Similarly, five different pH values were selected for the reaction between antibody and cell, in Fig. 6b. From the results, one can see that when the pH value was 7.4, the intensity decreased to the lowest. Therefore, pH 7.4 was chosen as the optimised value for all the detection process.
 |
| Fig. 6 ECL-incubation time curve (a) and ECL-pH value curve (b) in PBS (0.1 M, pH 7.4 containing 0.1 M KCl and 0.05 M K2S2O8), with the scan rate of 100 mV s−1 and the PMT voltage of −800 V. | |
Cell detection
The cell detection was conducted under the above optimal detection conditions, with an incubation time of 30 min and pH value of 7.4. The calibration plot of the determination of cell was shown in Fig. 7, where the ECL intensity declined linearly with the concentration of cell. The detection range was from 200 to 10
000 cells per mL, with a detection limit of 78 cells per mL at 3σ. The regression equation was expressed as IECL = 31
273.85 − 7345.73
log
C (IECL is the ECL intensity; C equals the concentration of cells, cells per mL; R2 = 0.989). We believe that the low detection limit can be attributed to the high specific surface ratio of FN substrate. Also from the linear equation, the concentration of cell can be quantitatively obtained. When the concentration was larger than 10
000 cells per mL, the intensity reached a plateau, indicating that all binding sites of the antibodies were occupied by the cells.
 |
| Fig. 7 ECL intensity–time curves for various concentrations of cells. The concentrations of cells (cells mL−1) are as follows: (a) 0, (b) 200, (c) 500, (d) 1000, (e) 2500, (f) 5000, (g) 7500, (h) 10 000, and (i) 20 000. The inset shows the calibration curve for HepG2 cells determination. | |
Selectivity, reproducibility, stability and versatility of the designed biosensor
It is well-known that selectivity, reproducibility and stability are the three important parameters for a good biosensor. Accordingly, for our constructed model, its selectivity was evaluated first. HepG2 cells, Hela cells, Ramos cells and normal cells were selected due to the similar physical and chemical properties. The FN biosensors were immersed into different cell solution (1000 cells per mL), respectively. Subsequently, these biosensors with different cells were detected using ECL technique after carefully rinsing to remove the cells attached to the surface without specific bonding. The ECL intensity of the FN biosensor with comparison cells decreased a little, while the other FN biosensor with target cells had excellent responses to cell with a concentration of 200 to 10
000 cells per mL (Fig. 7). The decline of the ECL intensity of the FN biosensor for sample b, c, and d, could be mainly contributed to the porous structure of FN substrate (Fig. 8), which might trap few cells. However, trapping can only have little effect after carefully washing.
 |
| Fig. 8 Plotting of ECL intensity versus different samples the concentrations of 1000 cells per mL. (a) HepG2 cell, (b) Hela cell, (c) Ramos cell and (d) normal cell. | |
Second, to test the reproducibility of this biosensor, intra- and inter-assay were conducted to evaluate the coefficients of variation.10 The intra-assay experiments were conducted with five duplicated detection with the same concentration of cell (5000 cells per mL). After calculation, an intra-assay coefficient of variation was 6.1%. The inter-assay experiments were completed with five biosensors prepared on the same FN electrode to detect cell concentration (5000 cells per mL). Similarly, after calculation, the inter-assay coefficient of variation on five biosensors was 8.3%. All the data well showed the good reproducibility of the constructed biosensor.
Third, the stability of the sensor after a long time storage was well confirmed by storing. The biosensor in PBS (pH 7.4) at 4 °C over 20 days, with 97.3% of the initial ECL intensity well remained. This might be also due to the fact that the good stability of all the material utilized in the fabrication of this biosensor.
Fourth, the versatility of this biosensor can be realized by modifying other types of antibody to the FN substrate, i.e., to detect Hela cells, the responding antibody needs to be modified on to the FN substrate. Thus, this biosensor can be modified and utilized for detection of different types of cells.
Preliminary analysis of real samples
To further verify the practical utility of this approach, cancer human serum samples containing some concentration of HepG2 cells were detected using our design (shown in Table 1), compared with traditional ELISA method, although ELISA is not the best method for direct cell detection, from which we can see the great potential of this design for future clinical applications.
Table 1 Determination of cell concentration in serum by ELISA and this design
|
ELISA methoda [cell per mL] |
This designa [cell per mL] |
Relative standard deviation [%] |
The average value of three successive determinations. |
Sample 1 |
569 |
512 |
7.46 |
Sample 2 |
976 |
908 |
5.10 |
Sample 3 |
4736 |
4387 |
5.41 |
Sample 4 |
9569 |
10 642 |
7.50 |
Conclusions
CdS-modified porous FN substrates, with large specific surface ratio, were successfully constructed and utilized for the biosensing of cells. Due to the large specific surface ratio, the electron transfer rate between the electrode and the solution was enhanced, and the amount of QDs was increased within limited area, thus leading to a relatively higher ECL signal, based on which a cancer cell biosensor was fabricated with good selectivity, sensitivity, stability and reproducibility. This porous substrate offered a new platform for the detection of cancer cells in clinical area, proved by the preliminary detection of real serum samples.
Acknowledgements
X. H gratefully acknowledges the financial support from the Thousand Young Talent Program and National Natural Science Foundation of China (no. 21474025, 21504020). G. Y is grateful for the financial support from the National Natural Science Foundation of China (no. 61473095).
Notes and references
- B. Zhuo, Y. Li, A. Zhang, F. Lu, Y. Chen and W. Gao, J. Mater. Chem. B, 2014, 2, 3263–3270 RSC.
- G. Nie, C. Li, L. Zhang and L. Wang, J. Mater. Chem. B, 2014, 2, 8321–8328 RSC.
- M.-S. Wu, L.-J. He, J.-J. Xu and H.-Y. Chen, Anal. Chem., 2014, 86, 4559–4565 CrossRef CAS PubMed.
- Y. Li, X. Luo, Z. Yan, J. Zheng and H. Qi, Chem. Commun., 2013, 49, 3869–3871 RSC.
- M. Liu, Y. Ye, C. Yao, W. Zhao and X. Huang, J. Mater. Chem. B, 2014, 2, 6626–6633 RSC.
- G. Jie and J. Yuan, Anal. Chem., 2012, 84, 2811–2817 CrossRef CAS PubMed.
- D. Liu, L. Wang, S. Ma, Z. Jiang, B. Yang, X. Han and S. Liu, Nanoscale, 2015, 7, 3627–3633 RSC.
- Z. Ding, B. M. Quinn, S. K. Haram, L. E. Pell, B. A. Korgel and A. J. Bard, Science, 2002, 296, 1293–1297 CrossRef CAS PubMed.
- J. Lei and H. Ju, TrAC, Trends Anal. Chem., 2011, 30, 1351–1359 CrossRef CAS.
- J. F. Rusling, G. W. Bishop, N. M. Doan and F. Papadimitrakopoulos, J. Mater. Chem. B, 2014, 2, 12–30 RSC.
- J. Li, N. Wang, L. Chen, L. Yuan, L. Zhou, R. Shen and Q. Cai, Analyst, 2013, 138, 2038–2043 RSC.
- X. T. Zheng, A. Ananthanarayanan, K. Q. Luo and P. Chen, Small, 2015, 11, 1620–1636 CrossRef CAS PubMed.
- L. Li, H. Liu, Y. Shen, J. Zhang and J.-J. Zhu, Anal. Chem., 2011, 83, 661–665 CrossRef CAS PubMed.
- K. N. Swanick, M. Hesari, M. S. Workentin and Z. Ding, J. Am. Chem. Soc., 2012, 134, 15205–15208 CrossRef CAS PubMed.
- L. Wu, J. Wang, L. Feng, J. Ren, W. Wei and X. Qu, Adv. Mater., 2012, 24, 2447–2452 CrossRef CAS PubMed.
- G. Jie, L. Wang, J. Yuan and S. Zhang, Anal. Chem., 2011, 83, 3873–3880 CrossRef CAS PubMed.
- G. Jie, J. Yuan and J. Zhang, Biosens. Bioelectron., 2012, 31, 69–76 CrossRef CAS PubMed.
- H. Zhou, J. Liu, J.-J. Xu and H.-Y. Chen, Chem. Commun., 2011, 47, 8358–8360 RSC.
- G. Jie, Y. Qin, Q. Meng and J. Wang, Analyst, 2015, 140, 79–82 RSC.
- G. Jie, J. Zhang, G. Jie and L. Wang, Biosens. Bioelectron., 2014, 52, 69–75 CrossRef CAS PubMed.
- X. Tong, P. Sheng, Z. Yan, X. Wang, J. Cai and Q. Cai, Sens. Actuators, B, 2014, 198, 41–48 CrossRef CAS.
- L. Wang, S. Ma, X. Wang, D. Liu, S. Liu and X. Han, J. Mater. Chem. B, 2013, 1, 5021–5027 RSC.
- Y.-Y. Song, Q.-L. Zhuang, C.-Y. Li, H.-F. Liu, J. Cao and Z.-D. Gao, Electrochem. Commun., 2012, 16, 44–48 CrossRef CAS.
- J. Wang, X. Jiang, H. Han and N. Li, Electrochem. Commun., 2011, 13, 359–362 CrossRef CAS.
- Z.-L. Ge, T.-M. Song, Z. Chen, W.-R. Guo, H.-P. Xie and L. Xie, Anal. Chim. Acta, 2015, 862, 24–32 CrossRef CAS PubMed.
- L. Li, Y. Chen, Q. Lu, J. Ji, Y. Shen, M. Xu, R. Fei, G. Yang, K. Zhang and J.-R. Zhang, Sci. Rep., 2013, 3, 1529 Search PubMed.
- L.-R. Hong, Y.-Q. Chai, M. Zhao, N. Liao, R. Yuan and Y. Zhuo, Biosens. Bioelectron., 2015, 63, 392–398 CrossRef CAS PubMed.
- G.-F. Jie, P. Liu and S.-S. Zhang, Chem. Commun., 2010, 46, 1323–1325 RSC.
- S. Yuan, R. Yuan, Y. Chai, L. Mao, X. Yang, Y. Yuan and H. Niu, Talanta, 2010, 82, 1468–1471 CrossRef CAS PubMed.
- G. Jie, P. Liu, L. Wang and S. Zhang, Electrochem. Commun., 2010, 12, 22–26 CrossRef CAS.
- G. Nie, Z. Bai, W. Yu and L. Zhang, J. Polym. Sci., Part A: Polym. Chem., 2013, 51, 2385–2392 CrossRef CAS.
- Y. Wang, J. Lu, L. Tang, H. Chang and J. Li, Anal. Chem., 2009, 81, 9710–9715 CrossRef CAS PubMed.
- F.-N. Xiao, M. Wang, F.-B. Wang and X.-H. Xia, Small, 2014, 10, 706–716 CrossRef CAS PubMed.
- T. Huang, Q. Meng and G. Jie, Biosens. Bioelectron., 2015, 66, 84–88 CrossRef CAS PubMed.
- G. Jie, L. Wang and S. Zhang, Chem.–Eur. J., 2011, 17, 641–648 CrossRef CAS PubMed.
- Z. Lin, J. Chen and G. Chen, Electrochim. Acta, 2008, 53, 2396–2401 CrossRef CAS.
- Y. Sato and K. Uosaki, J. Electroanal. Chem., 1995, 384, 57–66 CrossRef.
- S.-N. Ding, B.-H. Gao, D. Shan, S. Cosnier and Y.-M. Sun, RSC Adv., 2012, 2, 10813–10816 RSC.
- G. Nie, Z. Bai, W. Yu and J. Chen, Biomacromolecules, 2013, 14, 834–840 CrossRef CAS PubMed.
- Y. Yuan, X. Xia, J. Wu, J. Yang, Y. Chen and S. Guo, Electrochim. Acta, 2011, 56, 2627–2632 CrossRef CAS.
- C. Zhang, H.-C. Yang, L.-S. Wan, H.-Q. Liang, H. Li and Z.-K. Xu, ACS Appl. Mater. Interfaces, 2015, 7(21), 11567–11574 CAS.
- T. M. Straub, B. P. Dockendorff, M. D. Quiñonez-Díaz, C. O. Valdez, J. I. Shutthanandan, B. J. Tarasevich, J. W. Grate and C. J. Bruckner-Lea, J. Microbiol. Methods, 2005, 62, 303–316 CrossRef CAS PubMed.
- G.-S. Qian, R. K. Ross, M. C. Yu, J.-M. Yuan, Y.-T. Gao, B. E. Henderson, G. N. Wogan and J. D. Groopman, Cancer Epidemiol., Biomarkers Prev., 1994, 3, 3–10 CAS.
- L. Chen, Q. Cai, F. Luo, X. Chen, X. Zhu, B. Qiu, Z. Lin and G. Chen, Chem. Commun., 2010, 46, 7751–7753 RSC.
- J. He, L. Wang, Z. Wei, Y. Yang, C. Wang, X. Han and Z. Nie, ACS Appl. Mater. Interfaces, 2013, 5, 9746–9751 CAS.
- Y. Sun and Y. Xia, Science, 2002, 298, 2176–2179 CrossRef CAS PubMed.
- L. Wang, Y. Liu, J. He, M. J. Hourwitz, Y. Yang, J. T. Fourkas, X. Han and Z. Nie, Small, 2015, 11, 3762–3767 CrossRef CAS PubMed.
- X. Han, L. Wang and X. Wang, Adv. Funct. Mater., 2012, 22, 4533–4538 CrossRef CAS.
- Q. Liu, B. Yu, W. Ye and F. Zhou, Macromol. Biosci., 2011, 11, 1227–1234 CrossRef CAS PubMed.
- F. Liu, F. Sun and Q. Pan, J. Mater. Chem. A, 2014, 2, 11365–11371 CAS.
- Y. Liu, K. Ai and L. Lu, Chem. Rev., 2014, 114, 5057–5115 CrossRef CAS PubMed.
- W. Miao, Chem. Rev., 2008, 108, 2506–2553 CrossRef CAS PubMed.
- G. Jie, B. Liu, H. Pan, J.-J. Zhu and H.-Y. Chen, Anal. Chem., 2007, 79, 5574–5581 CrossRef CAS PubMed.
|
This journal is © The Royal Society of Chemistry 2016 |
Click here to see how this site uses Cookies. View our privacy policy here.